OCZ's Agility 2 Reviewed: The First SF-1200 with MP Firmware
by Anand Lal Shimpi on April 21, 2010 7:22 PM ESTWhile it happens a lot less now than a couple of years ago, I still see the question of why SSDs are worth it every now and then. Rather than give my usual answer, I put together a little graph to illustrate why SSDs are both necessary and incredibly important.
Along the x-axis we have different types of storage in a modern computer. They range from the smallest, fastest storage elements (cache) to main memory and ultimately at the other end of the spectrum we have mechanical storage (your hard drive). The blue portion of the graph indicates typical capacity of these storage structures (e.g. 1024KB L2, 1TB HDD, etc...). The further to the right you go, the larger the structure happens to be.
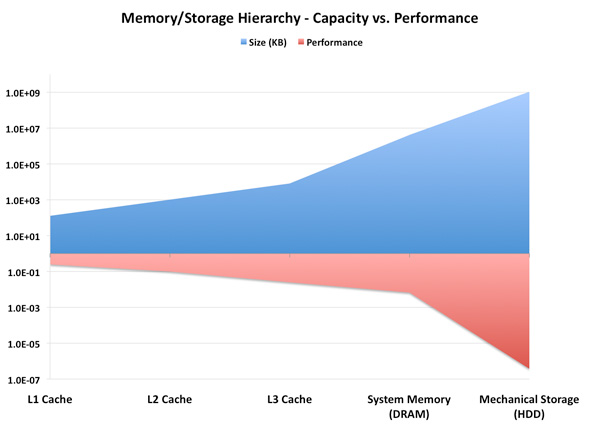
The red portion of the graph lists performance as a function of access latency. The further right you go, the slower the storage medium becomes.
This is a logarithmic scale so we can actually see what’s going on. While capacity transitions relatively smoothly as you move left to right, look at what happens to performance. The move from main memory to mechanical storage occurs comes with a steep performance falloff.
We could address this issue by increasing the amount of DRAM in a system. However, DRAM prices are still too high to justify sticking 32 - 64GB of memory in a desktop or notebook. And when we can finally afford that, the applications we'll want to run will just be that much bigger.
Another option would be to improve the performance of mechanical drives. But we’re bound by physics there. Spinning platters at more than 10,000 RPM proves to be power, sound and reliability prohibitive. The majority of hard drives still spin at 7200 RPM or less.
Instead, the obvious solution is to stick another level in the memory hierarchy. Just as AMD/Intel have almost fully embraced the idea of a Level 3 cache in their desktop/notebook processors, the storage industry has been working towards using NAND as an intermediary between DRAM and mechanical storage. Let’s look at the same graph if we stick a Solid State Drive (SSD) in there:
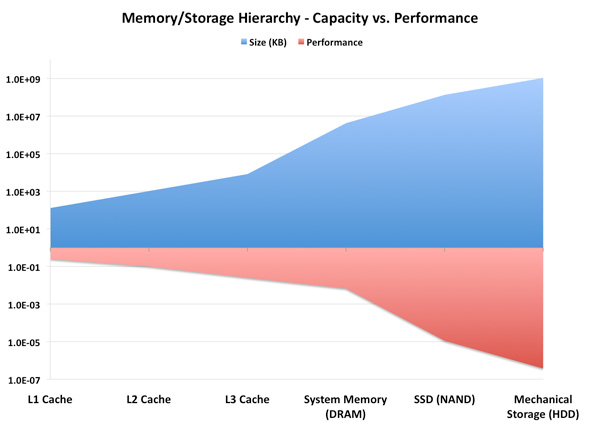
Not only have we smoothed out the capacity curve, but we’ve also addressed that sharp falloff in performance. Those of you who read our most recent VelociRaptor VR200M review will remember that we recommend a fast SSD for your OS/applications, and a large HDD for games, media and other large data storage. The role of the SSD in the memory hierarchy today is unfortunately user-managed. You have to manually decide what goes on your NAND vs. mechanical storage, but we’re going to see some solutions later this year that hope to make some of that decision for you.
Why does this matter? If left unchecked, sharp dropoffs in performance in the memory/storage hierarchy can result in poor performance scaling. If your CPU doubles in peak performance, but it has to wait for data the majority of the time, you’ll rarely realize that performance increase. In essence, the transistors that gave your CPU its performance boost will have been wasted die area and power.
Thankfully we tend to see new levels in the memory/storage hierarchy injected preemptively. We’re not yet at the point where all performance is bound by mass storage, but as applications like virtualization become even more prevalent the I/O bottleneck is only going to get worse.
Motivation for the Addiction
It’s this sharp falloff in performance between main memory and mass storage that makes SSDs so enticing. I’ve gone much deeper into how these things work already, so if you’re curious I’d suggest reading our SSD Relapse.
SSD performance is basically determined by three factors: 1) NAND, 2) firmware and 3) controller. The first point is obvious; SLC is faster (and more expensive) than MLC, but is limited to server use mostly. Firmware is very important to SSD performance. Much of how an SSD behaves is determined by the firmware. It handles all data mapping to flash, how to properly manage the data that’s written on the drive and ensures that the SSD is always operating as fast as possible. The controller is actually less important than you’d think. It’s really a combination of the firmware and controller that help determine whether or not an SSD is good.
For those of you who haven’t been paying attention, we basically have six major controller manufacturers competing today: Indilinx, Intel, Micron, Samsung, SandForce and Toshiba. Micron uses a Marvell controller, and Toshiba has partnered up with JMicron on some of its latest designs.
Of that list, the highest performing SSDs come from Indilinx, Intel, Micron and SandForce. Micron makes the only 6Gbps controller, while the rest are strictly 3Gbps. Intel is the only manufacturer on our shortlist that we’ve been covering for a while. The rest of the companies are relative newcomers to the high end SSD market. Micron just recently shipped its first competitive SSD, the RealSSD C300 as did SandForce.
We first met Indilinx a little over a year ago when OCZ introduced a brand new drive called the Vertex. While it didn’t wow us with its performance, OCZ’s Vertex seemed to have the beginnings of a decent alternative to Intel’s X25-M. Over time the Vertex and other Indilinx drives got better, eventually earning the title of Intel alternative. You wouldn’t get the same random IO performance, but you’d get better sequential performance and better pricing.
Several months later OCZ introduced another Indilinx based drive called Agility. Using the same Indilinx Barefoot controller as the Vertex, the only difference was Agility used 50nm Intel or 40nm Toshiba NAND. In some cases this resulted in lower performance than Vertex, while in others we actually saw it pull ahead.
OCZ released many other derivatives based on Indilinx’s controller. We saw the Vertex EX which used SLC NAND for enterprise customers, as well as the Agility EX. Eventually as more manufacturers started releasing Indilinx based drives, OCZ attempted to differentiate by releasing the Vertex Turbo. The Vertex Turbo used an OCZ exclusive version of the Indilinx firmware that ran the controller and external DRAM at a higher frequency.
Despite a close partnership with Indilinx, earlier this month OCZ announced that its next generation Vertex 2 and Agility 2 drives would not use Indilinx controllers. They’d instead be SandForce based.


60 Comments
View All Comments
ogc - Thursday, April 22, 2010 - link
That file 512mb in size which compresses 1000x seems to simply full of zeros, so it represents best case performance for sandforce. On the other hand pure random writes are not expected in typical computer usage so they also are not very meaningful. Any chance to feed iometer with data from your storage bench for example?arehaas - Thursday, April 22, 2010 - link
I actually think random writes with compressed files are meaningful.JPEG files are highly compressed - you can gain only 1-3% by zipping them. Those who work with such files a lot - write to the disk or move around jpegs or similar compressed graphic and video files - should be paying most attention to these new tests for Sandforce. It may be a good idea to add the results for all (most) drives to the page with random writes chart as another chart "Random Writes - Compressed files".
arehaas - Thursday, April 22, 2010 - link
Thanks to the new tests, it appears the charts of rnd or seq writes are currently misleading with respect to Sandforce, if most of your important files (e.g., for a graphic designer) are compressed. The charts are easier to read than text. Currently, one has to flip pages to and from the "Random Data performance page" in order to get the true picture. Maybe Anand can add a bar with "Corsair with compressed data" to the read/write charts? Thanks.davepermen - Thursday, April 22, 2010 - link
I guess that drive is not that well suited for video editing, where you have mostly random data (compressed and uncompressed, both look rather random to the drive). it wouldn't be bad in any way, just lose it's peak performance.FragKrag - Thursday, April 22, 2010 - link
Up until about a week or two ago I was set on an Intel X25-M G2 80GB, but now I'm not so sure anymore. If I got a Vertex 2/Agility 2, it would be a 50GB version... decisions decisions.Oh, and prompted by this article, I looked for the pricing of the Vertex Indilinx on Newegg, and I found this 50GB Vertex LE at $200
http://www.newegg.com/Product/Product.aspx?Item=N8...
never knew they had a 50GB run of Vertex LEs...
willscary - Thursday, April 22, 2010 - link
After my problems last week, I ended up going back to the Crucial M225 series with the Indilinx controller. It is not quite as fast, but it does have a 5 year warranty. I paid $325 for the 128GB drives and a very low $579 for a 256GB drive from Newegg.I have been using these drives in several machines since the beginning of the year. They all support TRIM and I have had no problems. They are very fast in daily use. I had hoped the Sandforce drives would be faster, but I guess I will have to wait for a later date to find out (I will be purchasing another pair of computers in July after the new fiscal year begins...perhaps I will purchase the Sandforce SSDs at that time).
Look09 - Thursday, April 22, 2010 - link
What happens when you use TrueCrypt to encrypt your OS.? Does it then random-write everything and indilinx is better? Does it make the Vertex 2 much better? Or no difference?Ryan Smith - Thursday, April 22, 2010 - link
Encrypted data should look like random noise, and as a result should have very little compressibility. I haven't used TrueCrypt, but it's my understanding that it writes garbage data to whatever part of the hidden partition isn't in use, so the whole thing should largely be uncompressible and match our random data performance.semo - Thursday, April 22, 2010 - link
I'm interested in encrypted testing also. These controllers are beginning to look like very fast consumer drives rather than enterprise (if the SATA interface wasn't a big enough hint already).I'm also wondering why are they getting a more substantial performance hit when writing compressed random 4k writes compared to 2MB sequential writes (74.4% vs 57.4%).
Just to re instate, why are all these SSD makers coming out with SATA drives and calling them enterprise? AFAIK, Intel and Hitachi are working on an SAS SSD but I'm not aware of any other reasonable company doing the same (i'm totally ignoring what the military might have because costs there are nuts).
Mugur - Thursday, April 22, 2010 - link
... Too bad that the price is still high so I'm very interested for the low-end 40 GB ones, but with good random 4k writes. I have 5 machines at home waiting for this upgrade as the boot drive. :-)Allow me to thank you, Anand, for your dedication and work.