Plextor M5S 256GB Review
by Kristian Vättö on July 18, 2012 3:00 AM ESTRandom Read/Write Speed
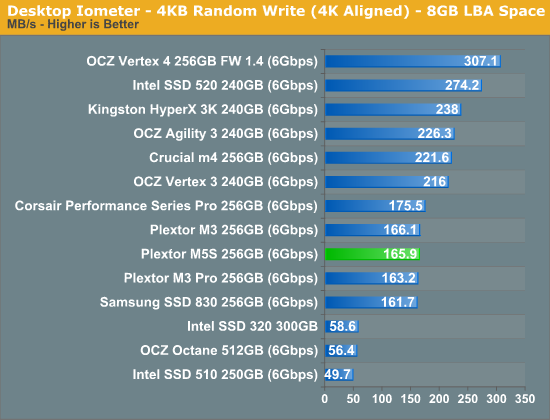
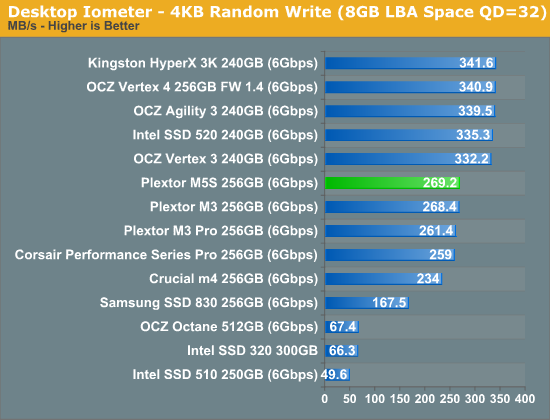
The four corners of SSD performance are as follows: random read, random write, sequential read and sequential write speed. Random accesses are generally small in size, while sequential accesses tend to be larger and thus we have the four Iometer tests we use in all of our reviews. Our first test writes 4KB in a completely random pattern over an 8GB space of the drive to simulate the sort of random access that you'd see on an OS drive (even this is more stressful than a normal desktop user would see).
We perform three concurrent IOs and run the test for 3 minutes. The results reported are in average MB/s over the entire time. We use both standard pseudo randomly generated data for each write as well as fully random data to show you both the maximum and minimum performance offered by SandForce based drives in these tests. The average performance of SF drives will likely be somewhere in between the two values for each drive you see in the graphs. For an understanding of why this matters, read our original SandForce article.
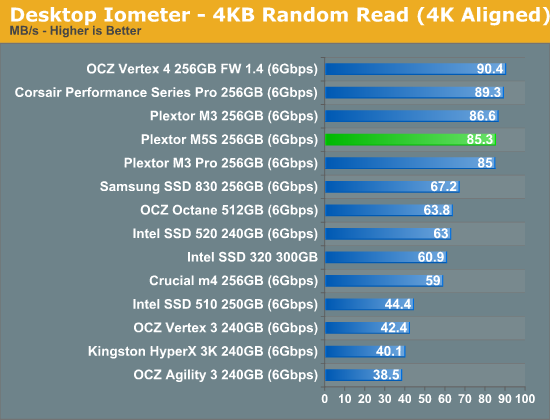
Random read and write performance has not changed at all from previous generation. This was expected because Plextor was not claiming increased random read/write performance, and the performance figures from Plextor are almost identical; The 256GB M3 Pro has 75K IOPS random read and 68K IOPS random write. The respective figures for the 256GB M5S are 73K IOPS read and 70K IOPS write.
Sequential Read/Write Speed
To measure sequential performance we ran a one minute long 128KB sequential test over the entire span of the drive at a queue depth of 1. The results reported are in average MB/s over the entire test length.
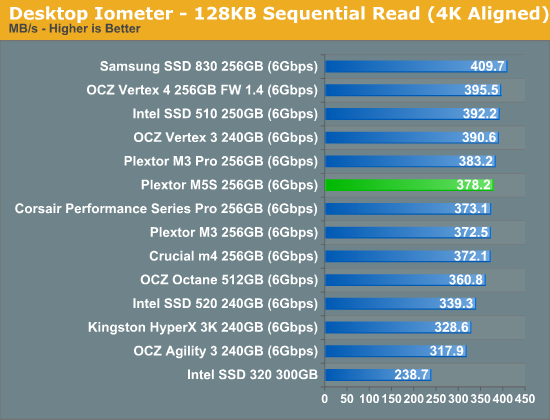
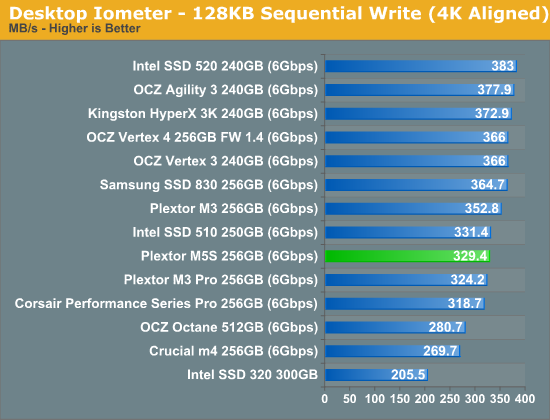
Sequential read and write performance has not changed dramatically either. Sequential read performance is right in-between the M3 and M3 Pro while sequential write performance is similar to the M3 Pro. As we discovered in our M3 Pro review, the standard M3 actually performed better in sequential write test with compressible data, although the M3 Pro was much faster when tested with incompressible data.


43 Comments
View All Comments
shodanshok - Wednesday, July 18, 2012 - link
Hi Kristian,thank you for your reply.
I understand that measuring WA is your "special sauce" (anything to do with SMART 0xE6-0xF1 attributes ? ;)), but the interesting thing is the Plextor was able to minimize WA while, at the same time, maximize idle GC efficiency.
Other drivers that heavily use GC (eg: Toshiba and previously Indilinx controllers) seems to cause a much higher WA.
Thank you for these comprehensive review.
sheh - Thursday, July 19, 2012 - link
Thanks.I have to say, though, that it's difficult to give credence to data that is the result of undisclosed calculations, and not even by the hardware manufacturers.
Kristian Vättö - Thursday, July 19, 2012 - link
The method we use was disclosed by a big SSD manufacturer a few years ago. It does not rely on SMART or power consumption, and it can be run on any drive.If we revealed the method we use, we would basically be giving it out to every other site. Tech industry is quite insolent about "stealing" nowadays, getting content from other sites without giving credit seems to be fine by today's standards.
Also, our method is just one way of estimating worst case write amplification.
shodanshok - Thursday, July 19, 2012 - link
Hi KristianI totally understand your point.
Thank you for these great reviews ;)
sheh - Thursday, July 19, 2012 - link
I can't say I understand this logic, but so be it. Thanks for replying. :)jwilliams4200 - Sunday, July 22, 2012 - link
Does it work for Sandforce SSDs? Because I noticed your WA chart does not have any Sandforce SSDs.Are you just measuring the fresh out-of-box (or secure erase) write speed with HD Tune, then torturing the drives and then measuring the worst case write speed with HD Tune? Then saying WA = FOB write speed / worst case write speed ?
If that is what you are doing, then I don't think it is very accurate. Any SSDs that have aggressive background garbage collection could make the "worst case" write speed fluctuate or stabilize at a value that does not reflect the worst case write amplification.
Kristian Vättö - Sunday, July 22, 2012 - link
SandForce drives break the chart, hence I couldn't include any. SandForce drives typically have worst case WA of around 2x, though.I still cannot say what our testing methods are. Anand has made the decision that he doesn't want to share the method and I have to respect that. You can email him and ask about our method - I can't share our methods without his permission.
In the end it's an estimation, nothing more. How accurate, it's hard to say as it will vary depending on usage.
jwilliams4200 - Monday, July 23, 2012 - link
So it is TERRIBLY inaccurate, because Sandforce SSDs actually have worst case write amplification of well over 10, just like other SSDs.In that case, I assume I was correct that you are just using ratio of write speeds from HD Tune, but since HD Tune writes highly compressible data, you are getting bogus results for Sandforce SSDs (actually, I should say, even more inaccurate for Sandforce SSDs than for non-Sandforce)
Anand really needs to reconsider some of his policies. This "secret" test method is just absurd.
jwilliams4200 - Wednesday, July 18, 2012 - link
It all hinges on finding a way of measuring "flash writes", the amount erased/written to flash chips, as opposed to "host writes", which is easy to measure (the amount your computer writes to the SSD).Usually you can find or guess which one of the SMART attributes represents flash writes. You can start by doing large sequential writes to the SSD (for which the WA should be close to, but a little over, 1) and monitoring the SMART attributes to see which one changes like it is monitoring flash writes.
I remember some time ago an anandtech article mentioned another way of doing it. I'm not sure if they are using this method now or not (I have my doubts about the accuracy of the method). It had to do with measuring the power usage and somehow correlating that to how much writing to flash is occurring. The reason I have doubts about the accuracy of the method is that it would require measuring a sort of "baseline" power consumption when writing to the flash, and to get the baseline you would have to control the conditions of the write (for example, doing it write after a secure erase) in order that you can guess/assume what the WA is, so that you will then be able to compute the WA in more complicated conditions based on the "baseline". But that is rather like pulling yourself up by your own bootstraps, so I would not trust the results.
The first method I described is the way to go, unless the SSD does not have a SMART attribute that measures flash writes.
cserwin - Wednesday, July 18, 2012 - link
I have to say seing the Plextor brand name resurface kindles a warm, happy feeling.There was a time when they made the optical drives to have. A Plextor CD-ROM, a 3DFX Voodoo, a 17" Sony Trinitron, IBM Dekstar...
Good luck, Plextor. Nice to see the old school still kickin.