Analyzing the iPhone 5 Geekbench Results
by Anand Lal Shimpi on September 16, 2012 8:31 PM EST- Posted in
- Smartphones
- Apple
- Mobile
- SoCs
- iPhone 5
While working on our Haswell piece, I've been religiously checking the Geekbench and GLBenchmark results browsers to see if anyone ran either benchmark and decided to tap upload. This usually happens before every major smartphone launch, but in the case of the iPhone 5 the details these applications can give us are even more important.
Yesterday we confirmed that Apple is using its own custom designed ARM based CPU cores in its A6 SoC. Apple opted not to design in a vanilla ARM Cortex A9 likely to avoid relying on pure voltage/frequency scaling to improve performance, and chose not to integrate a Cortex A15 likely because of power consumption concerns as well.
There's absolutely no chance of Apple sending us a nice block diagram of the A6 CPU cores, so we have to work with what clues we can get elsewhere. Geekbench is particularly useful because it reports clock speed. Why does clock speed matter? Because, if reported accurately, it can tell us a lot about how the A6's CPU design has improved from an IPC standpoint. Remember that clock speed doesn't matter, but rather the combination of clock frequency and instructions executed per clock that define single threaded performance.
| Apple iPhone 5 Models | ||||||
| iPhone 5 Model | GSM/EDGE Bands | WCDMA Bands | CDMA 1x/EVDO Rev.A/B Bands | LTE Bands (FCC+Apple) | ||
| A1428 "GSM" | 850/900/1800/1900 MHz | 850/900/1900/2100 MHz | N/A | 2/4/5/17 | ||
| A1429 "CDMA" | 850/900/1800/1900 MHz | 850/900/1900/2100 MHz | 800/1900/2100 MHz | 1/3/5/13/25 | ||
| A1429 "GSM" | 850/900/1800/1900 MHz | 850/900/1900/2100 MHz | NA | 1/3/5 (13/25 unused) | ||
A short while ago, Geekbench results for a device identifying itself as an iPhone5,2 appeared. Brian believes this is likely the A1429 Verizon device (A1428 being iPhone 5,1) - perhaps one presampled to a reviewer looking to test their luck.
MacRumors appears to be first on the scene, having been tipped by an employee at PrimateLabs (the creators of Geekbench). I need to preface the rest of this post with a giant caution sign: I have no inside knowledge of whether or not these results are legitimate. They seem believable, but anything can happen. The rest of this post is simply my initial thoughts on what these mean, should the results be accurate. Update: The first iPhone 5 reviews are out and this Geekbench data looks accurate.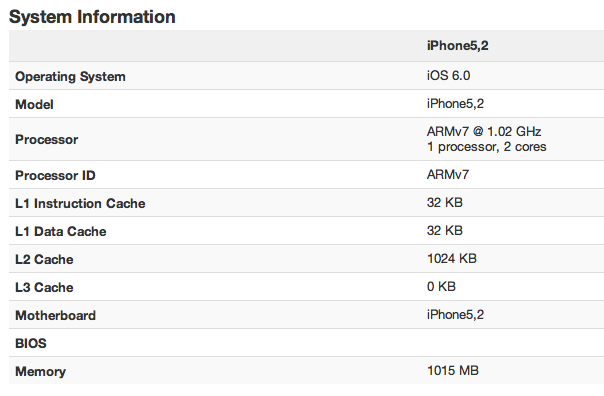
Cache sizes haven't changed, which either tells us Apple isn't feeling as generous with die size as perhaps it once was or that working sets in iOS are still small enough to fit inside of a 1MB L2. I suspect it's mostly the latter, although all microprocessor design is a constantly evaluated series of tradeoffs (often made through giant, awesomely protected spreadsheets).
The first real change is clock speed. Apple clocked its A4 and A5 CPU core(s) at 800MHz, although these Geekbench results point to a 25% increase in frequency at 1GHz. Some of the headroom is likely enabled by the move to 32nm, although it's very possible that Apple also went with a slightly deeper pipeline to gain frequency headroom. The latter makes sense. We've seen conservative/manageable increases in pipeline depth to hit frequency targets and improve performance before.
The fairly low clock speed also points to an increase in IPC (instructions executed per clock) over the Cortex A9 design. As I mentioned in our A6 analysis post, simple voltage/frequency scaling is a very power inefficient way to scale performance. A combination of IPC and frequency increases are necessary. If these results are accurate and the CPU cores are only running at 1GHz, it does lend credibility to the idea of a tangibly wider design.
It's also unclear if Apple is doing any sort of dynamic thermal allocation here, ala Intel's Turbo Boost. You can't get more power constrained than in a smartphone, and power gating is already common within ARM based SoCs, so that 1GHz value could be under load for both cores. A single core could run at higher frequencies for short bursts.
The next thing that stood out to me was the memory data:
| Geekbench Comparison | |||||
| Memory Performance | iPhone 4S | iPhone 5 (unconfirmed) | Scaling | ||
| Read Sequential ST | 0.32 GB/s | 1.78 GB/s | 5.63x | ||
| Write Sequential ST | 0.86 GB/s | 1.35 GB/s | 1.57x | ||
| Stdlib Allocate ST | 1.44 Mallocs/s | 1.92 Mallocs/s | 1.33x | ||
| Stdlib Write | 2.7 GB/s | 6.06 GB/s | 2.24x | ||
| Stdlib Copy | 0.55 GB/s | 2.26 GB/s | 4.13x | ||
| Geekbench Comparison | |||||
| Stream Performance | iPhone 4S | iPhone 5 (unconfirmed) | Scaling | ||
| Stream Copy | 0.42 GB/s | 1.9 GB/s | 4.55x | ||
| Stream Scale | 319 MB/s | 994 MB/s | 3.11x | ||
| Stream Add | 0.59 GB/s | 1.39 GB/s | 2.34x | ||
| Stream Triad | 377 MB/s | 1019 MB/s | 2.70x | ||
It's well known that ARM's Cortex A9 doesn't have the world's best interface outside of the compute core and its memory performance suffered as a result. If this data is accurate, it points to significantly overhauled cache and memory interfaces. Perhaps an additional load port, deeper buffers, etc...
Also pay close attention to peak bandwidth utilization. The 4S had 6.4GB/s of theoretical bandwidth out to main memory, the 5 raises that to 8.5GB/s. In the Stdlib write test the 4S couldn't even hit 50% of that peak bandwidth. The iPhone 5 on the other hand manages to hit over 70% of its peak memory bandwidth. I will say that if these numbers are indeed faked, whoever faked them was smart enough not to violate reality when coming up with these memory bandwidth numbers (e.g. no 95% efficiency numbers show up). It's also clear that these results aren't a simply doubling across the board over the 4S, lending some credibility to them.
Some of the largest performance improvements promised by the Geekbench data appear here in the memory results. It's whatever work Apple did here that helped enable the gains in the integer and floating point results below:
| Geekbench Comparison | |||||
| Integer Performance | iPhone 4S | iPhone 5 (unconfirmed) | Scaling | ||
| Blowfish ST | 10.7 MB/s | 23.4 MB/s | 2.18x | ||
| Blowfish MT | 20.7 MB/s | 45.6 MB/s | 2.20x | ||
| Text Compress ST | 1.21 MB/s | 2.79 MB/s | 2.30x | ||
| Text Compress MT | 2.28 MB/s | 5.19 MB/s | 2.27x | ||
| Text Decompress ST | 1.71 MB/s | 3.82 MB/s | 2.23x | ||
| Text Decompress MT | 2.84 MB/s | 5.60 MB/s | 2.67x | ||
| Image Compress ST | 3.32 Mpixels/s | 7.31 Mpixels/s | 2.20x | ||
| Image Compress MT | 6.59 Mpixels/s | 14.2 Mpixels/s | 2.15x | ||
| Image Decompress ST | 5.32 Mpixels/s | 12.4 Mpixels/s | 2.33x | ||
| Image Decompress MT | 10.5 Mpixels/s | 23.0 Mpixels/s | 2.19x | ||
| Lua ST | 215.4 Knodes/s | 455 Knodes/s | 2.11x | ||
| Lua MT | 425.6 Knodes/s | 887 Knodes/s | 2.08x | ||
| MT Scaling | 1.90x | 1.92x | |||
On average we see around 2.2x scaling from the 4S to the 5 in Geekbench's integer tests. There's no major improvement in multicore scaling, confirming what Geekbench tells us that we're looking at a two core/two thread machine.
The gains here are huge and are likely directly embodied in the performance claims that Apple made at the iPhone 5 launch event. Many smartphone workloads (under Android, iOS and Windows Phone despite what Microsoft may tell you) are still very CPU bound. Big increases in integer performance will be apparent in application level improvements.
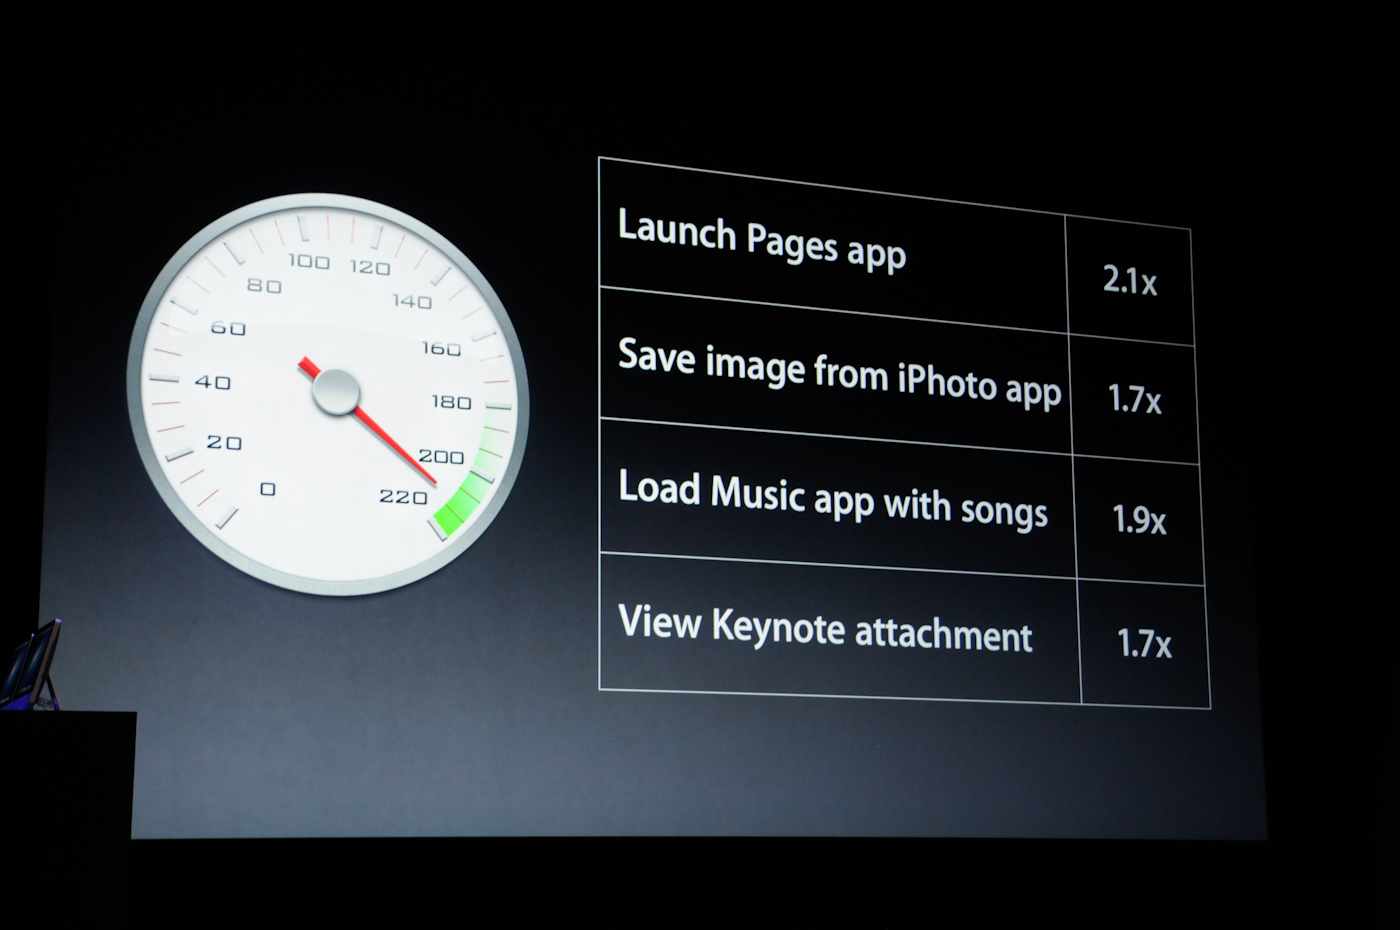
Don't be surprised to see greater than 2x scaling here even though Apple only promised 2x at the event. Remember that what you're looking at is raw compute tests without many of the constraints that apply to application level benchmarks. While Apple has used benchmarks in the past to showcase performance, all of its performance claims at launch were application level tests. Those types of tests are more constrained and will show less scaling. That being said, I am surprised to see application level tests that were so close to the 2.2x average scaling we see here. Apple could have moved to faster NAND/storage controller here as well, which could help most if not all of these situations.
| Geekbench Comparison | |||||
| Floating Point Performance | iPhone 4S | iPhone 5 (unconfirmed) | Scaling | ||
| Mandelbrot ST | 223 MFLOPS | 397 MFLOPS | 1.77x | ||
| Mandelbrot MT | 438 MFLOPS | 766 MFLOPS | 1.74x | ||
| Dot Product ST | 177 MFLOPS | 322 MFLOPS | 1.81x | ||
| Dot Product MT | 353 MFLOPS | 627 MFLOPS | 1.77x | ||
| LU Decomposition ST | 171 MFLOPS | 387 MFLOPS | 2.25x | ||
| LU Decomposition MT | 348 MFLOPS | 767 MFLOPS | 2.20x | ||
| Primality ST | 142 MFLOPS | 370 MFLOPS | 2.59x | ||
| Primality MT | 260 MFLOPS | 676 MFLOPS | 2.59x | ||
| Sharpen Image ST | 1.35 Mpixels/s | 4.85 Mpixels/s | 3.59x | ||
| Sharpen Image MT | 2.67 Mpixels/s | 9.28 Mpixels/s | 3.47x | ||
| Blur Image ST | 0.53 Mpixels/s | 1.96 Mpixels/s | 3.68x | ||
| Blur Image MT | 1.06 Mpixels/s | 3.78 Mpixels/s | 3.56x | ||
| MT Scaling | 1.96x | 1.92x | |||
The floating point benchmarks show "milder" scaling in the first few tests (sub-2x) but big scaling in the latter ones. My guess here is we're seeing some of the impacts of increased memory bandwidth at the end there. If you look at our iPhone 5 hands-on video you'll see Brian talking about how super fast the new flyover mode in iOS 6 Maps is on the 5 compared to the 4S. That's likely due in no small part to the improved memory interface.
Although Geekbench is cross platform, I wouldn't recommend using this data to do anything other than compare iOS devices. I've looked at using Geekbench to compare iOS to Android in the past and I've sometimes seen odd results.
I'm sure we'll learn a lot more about the A6 SoC over the coming days/weeks.


118 Comments
View All Comments
serversurfer - Tuesday, September 18, 2012 - link
People should keep in mind that the Android scores, particularly the GS3 scores, have gone up significantly since the first iPhone 5 score was posted. The GS3 did have an average score of 1560 at the time, but it's since climbed to a whopping 1728. Basically, butt-hurt Android fans have ruined the results for the top Android devices.http://forums.macrumors.com/showpost.php?p=1570257...
doobydoo - Tuesday, September 18, 2012 - link
The fact that people can influence these numbers and that they can change so drastically shows how little weight we should put on them.As Anand states:
'Although Geekbench is cross platform, I wouldn't recommend using this data to do anything other than compare iOS devices. I've looked at using Geekbench to compare iOS to Android in the past and I've sometimes seen odd results.'
big_adventure - Tuesday, September 18, 2012 - link
I've got a GS3 i9300 and here are the results running CM10's latest experimental:System:
GT-I9300
Android 4.1.1
Exnyos 4412 1.40ghz
Memory: 779MB
Score: 1812
Integer: 1565
FP: 2782
Mem: 1136
Stream: 636
Blowfish
single-threaded 655
28.8 MB/sec
Blowfish
multi-threaded 2127
87.2 MB/sec
Text Compress
single-threaded 616
1.97 MB/sec
Text Compress
multi-threaded 1858
6.10 MB/sec
Text Decompress
single-threaded 613
2.52 MB/sec
Text Decompress
multi-threaded 1191
4.75 MB/sec
Image Compress
single-threaded 771
6.37 Mpixels/sec
Image Compress
multi-threaded 2525
21.2 Mpixels/sec
Image Decompress
single-threaded 630
10.6 Mpixels/sec
Image Decompress
multi-threaded 2265
37.0 Mpixels/sec
Lua
single-threaded 1195
460.4 Knodes/sec
Lua
multi-threaded 4339
1.67 Mnodes
Mandelbrot
single-threaded 584
388.6 Mflops
Mandelbrot
multi-threaded 2214
1.45 Gflops
Dot Product
single-threaded 1120
541.2 Mflops
Dot Product
multi-threaded 4455
2.03 Gflops
LU Decomposition
single-threaded 242
215.4 Mflops
LU Decomposition
multi-threaded 490
429.7 Mflops
Primality Test
single-threaded 1393
208.0 Mflops
Primality Test
multi-threaded 3018
560.3 Mflops
Sharpen Image
single-threaded 1904
4.44 Mpixels/sec
Sharpen Image
multi-threaded 7016
16.2 Mpixels/sec
Blur Image
single-threaded 2339
1.85 Mpixels/sec
Blur Image
multi-threaded 8616
6.77 Mpixels/sec
Read Sequential
single-threaded 474
594.7 MB/sec
Write Sequential
single-threaded 2073
1.42 GB/sec
Stdlib Allocate
single-threaded 773
2.89 Mallocs/sec
Stdlib Write
single-threaded 843
1.75 GB/sec
Stdlib Copy
single-threaded 1521
1.57 GB/sec
Stream Copy
single-threaded 558
781.6 MB/sec
Stream Scale
single-threaded 708
941.2 MB/sec
Stream Add
single-threaded 634
981.4 MB/sec
Stream Triad
single-threaded 645
913.8 MB/sec
serversurfer - Tuesday, September 18, 2012 - link
Engadget has confirmed the score, saying they averaged 1628. No link to the breakdown, unfortunately, but the ~1600 scores on primatelabs.com are likely legit.http://www.engadget.com/2012/09/18/apple-iphone-5-...
serversurfer - Tuesday, September 18, 2012 - link
Oh, Engadget also clocked a 924 on Sunspider.Aenean144 - Tuesday, September 18, 2012 - link
Sub 1000 score on Sunspider? Wow! Was expecting that actually. So not that surprising.What I would like to know is how does Samsung get 1400 on an Exynos 4412 at 1.4 GHz. They must have added some special sauce to the Android JavaScript JIT compiler.
Qciphone 5 - Monday, September 24, 2012 - link
I actually got higher scores on almost every one of your results.Not too much higher but still higher.
iphone 5, 1 (at&t)
I posted my results Saturday on both Geekbench and GLBenchmark (offscreen)
Geekbench overall 1646 score. It consistently shows 1.04GHz
Its my wife's phone LOL!!
Qciphone 5 - Monday, September 24, 2012 - link
http://browser.primatelabs.com/geekbench2/1071508