OCZ Vector (256GB) Review
by Anand Lal Shimpi on November 27, 2012 9:10 PM ESTRandom Read/Write Speed
The four corners of SSD performance are as follows: random read, random write, sequential read and sequential write speed. Random accesses are generally small in size, while sequential accesses tend to be larger and thus we have the four Iometer tests we use in all of our reviews.
Our first test writes 4KB in a completely random pattern over an 8GB space of the drive to simulate the sort of random access that you'd see on an OS drive (even this is more stressful than a normal desktop user would see). I perform three concurrent IOs and run the test for 3 minutes. The results reported are in average MB/s over the entire time. We use both standard pseudo randomly generated data for each write as well as fully random data to show you both the maximum and minimum performance offered by SandForce based drives in these tests. The average performance of SF drives will likely be somewhere in between the two values for each drive you see in the graphs. For an understanding of why this matters, read our original SandForce article.
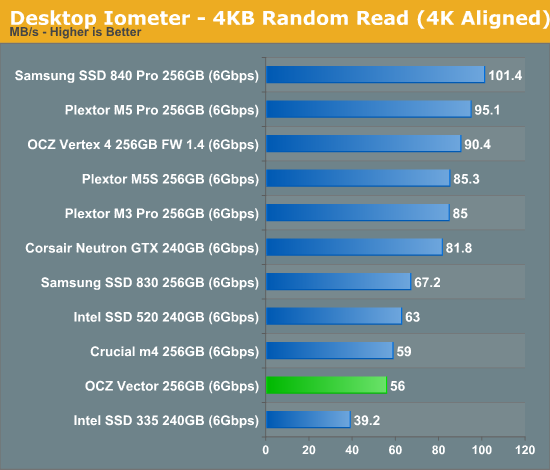
Low queue depth random read performance sees a significant regression compared to the Vertex 4. OCZ derives the Vector's specs at a queue depth of 32, at which it'll push 373MB/s of 4KB random reads. As Intel has established in the past, low queue depth random read performance of around 40 - 50MB/s is sufficient for most client workloads as we'll soon see in our trace based storage bench suite.
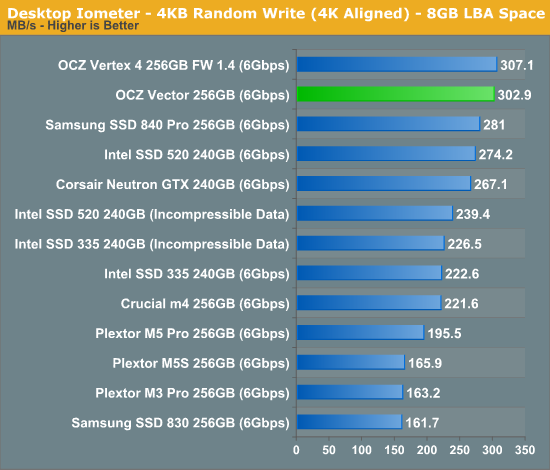
Low queue depth random write performance is a very different story, here the Vector pretty much equals the Vertex 4's already excellent score.
Many of you have asked for random write performance at higher queue depths. What I have below is our 4KB random write test performed at a queue depth of 32 instead of 3. While the vast majority of desktop usage models experience queue depths of 0 - 5, higher depths are possible in heavy I/O (and multi-user) workloads:
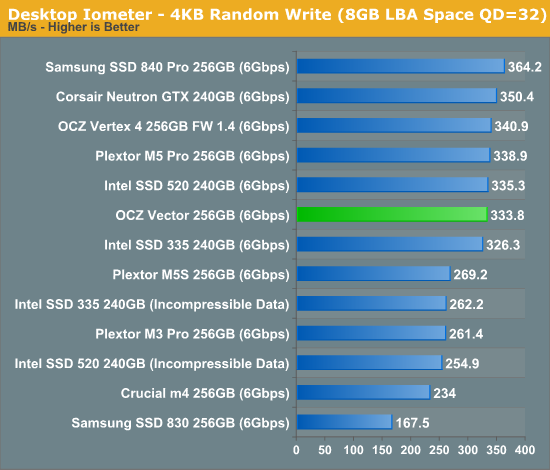
Crank up the queue depth and the Vector does well, but Samsung's SSD 840 Pro manages a nearly 10% performance advantage here.
Steady State 4KB Random Write Performance
OCZ will surely derive enterprise versions of the Vector and its Barefoot 3 controller, but I was curious to see what steady state 4KB random write performance looked like on the drive. I grabbed some of our Enterprise Iometer results from the S3700 review and trimmed out the non-SATA drives. The results are hugely improved compared to the Vertex 4:
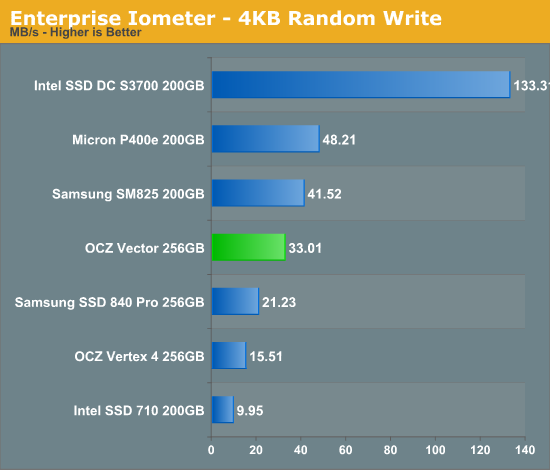
Keep in mind this isn't an enterprise drive, and thus it's not too surprising to see significantly higher numbers here from other enterprise drives but the improvement over the Vertex 4 is substantial. Note that Samsung's SSD 840 Pro lands somewhere in between the Vector and Vertex 4.


151 Comments
View All Comments
dj christian - Thursday, November 29, 2012 - link
"Now, according to Anandtech, a 256GB-labelled SSD actually *HAS* the full 256GiB (275GB) of flash memory. But you lose 8% of flash for provisioning, so you end up with around 238GiB (255GB) anyway. It displays as 238GB in Windows.If the SSDs really had 256GB (238GiB) of space as labelled, you'd subtract your 8% and get 235GB (219GiB) which displays as 219GB in Windows. "
Uuh what?
sully213 - Wednesday, November 28, 2012 - link
I'm pretty sure he's referring to the amount of NAND on the drive minus the 6.8% set aside as spare area, not the old mechanical meaning where you "lost" disk space when a drive was formatted because of base 10 to base 2 conversion.JellyRoll - Tuesday, November 27, 2012 - link
How long does the heavy test take? The longest recorded busy time was 967 seconds from the Crucial M4. This is only 16 minutes of activity. Does the trace replay in real time, or does it run compressed? 16 minutes surely doesnt seem to be that much of a long test.DerPuppy - Tuesday, November 27, 2012 - link
Quote from text "Note that disk busy time excludes any and all idles, this is just how long the SSD was busy doing something:"JellyRoll - Tuesday, November 27, 2012 - link
yes, I took note of that :). That is the reason for the question though, if there were an idea of how long the idle periods were we can take into account the amount of time the GC for each drive functions, and how well.Anand Lal Shimpi - Wednesday, November 28, 2012 - link
I truncate idles longer than 25 seconds during playback. The total runtime on the fastest drives ends up being around 1.5 hours.Take care,
Anand
Kristian Vättö - Wednesday, November 28, 2012 - link
And on Crucial v4 it took 7 hours...JellyRoll - Wednesday, November 28, 2012 - link
Wouldn't this compress the QD during the test period? If the SSDs recorded activity is QD2 for an hour, then the trace is replayed quickly this creates a high QD situation. QD2 for an hour compressed to 5 minutes is going to play back at a much higher QD.dj christian - Thursday, November 29, 2012 - link
What is QD?doylecc - Tuesday, December 4, 2012 - link
Que Depth