Exploring the Relationship Between Spare Area and Performance Consistency in Modern SSDs
by Anand Lal Shimpi on December 4, 2012 12:00 AM ESTWhen we reviewed Intel's SSD DC S3700 I started looking at consistency of IO latency, an area that Intel's latest controller specifically targeted for significant improvement. In our review of OCZ's Vector I took the same methodology and applied it to the current crop of high-end consumer drives. As I believe improving IO consistency is a good optimization practice for all SSDs, the hope is that we'll see improvements in this area on both client and enterprise focused drives.
In the comments thread for the Vector review, jwilliams4200 posted some very interesting data. The S3700 has 264GiB of NAND on-board but only exposes 186GiB of it (200GB advertised capacity) as user accessible storage, the rest is used as spare area to improve performance, consistency and endurance. Most client drives on the other hand only feature about 7% of their total NAND capacity set aside as spare area (256GiB of NAND, 238GiB of user storage). The obvious hypothesis is that a big part (if not all?) of the S3700's advantage in performance consistency is due to the large amount of spare area.
We've understood the relationship between spare area and write amplification for quite some time now. I borrowed the chart below from a paper published by IBM's Zurich Research Laboratory showing the relationship between write amplification and spare area for various workloads:
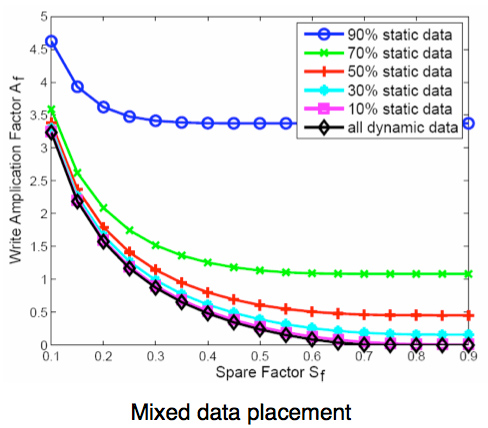
Write Amplification vs. Spare Area, courtesy of IBM Zurich Research Laboratory
With more spare area, write amplification is lower. The controller has more room and thus flexibility with running its defragmentation and garbage collection algorithms. The dreaded read-modify-write scenario is triggered less frequently as there's less space pressure thanks to additional spare area. If you're testing in a full-drive scenario, there's simply less data to keep track of when you've got more NAND set aside as spare area. This keeps internal data structure footprints smaller by default, which also improves performance.
It's because of this relationship between write amplification and spare area that we've always recommended setting aside 10 - 20% of your SSD and not filling it up entirely. Most modern controllers will do just fine if you partition the drive and leave the last 10 - 20% untouched. With TRIM support even the partitioning step isn't really necessary, but it does help from a data management standpoint. The real question is what's the relationship between spare area and IO latency/performance consistency.
To find out, I repeated jwilliams4200's tests. I took a bunch of 240/256GB drives and filled them to various percentages of their capacity, and performed our IO consistency test with an identical span of LBAs. The goal was to simulate worst case IO consistency while taking into account greater percentages of spare area.
The Tests
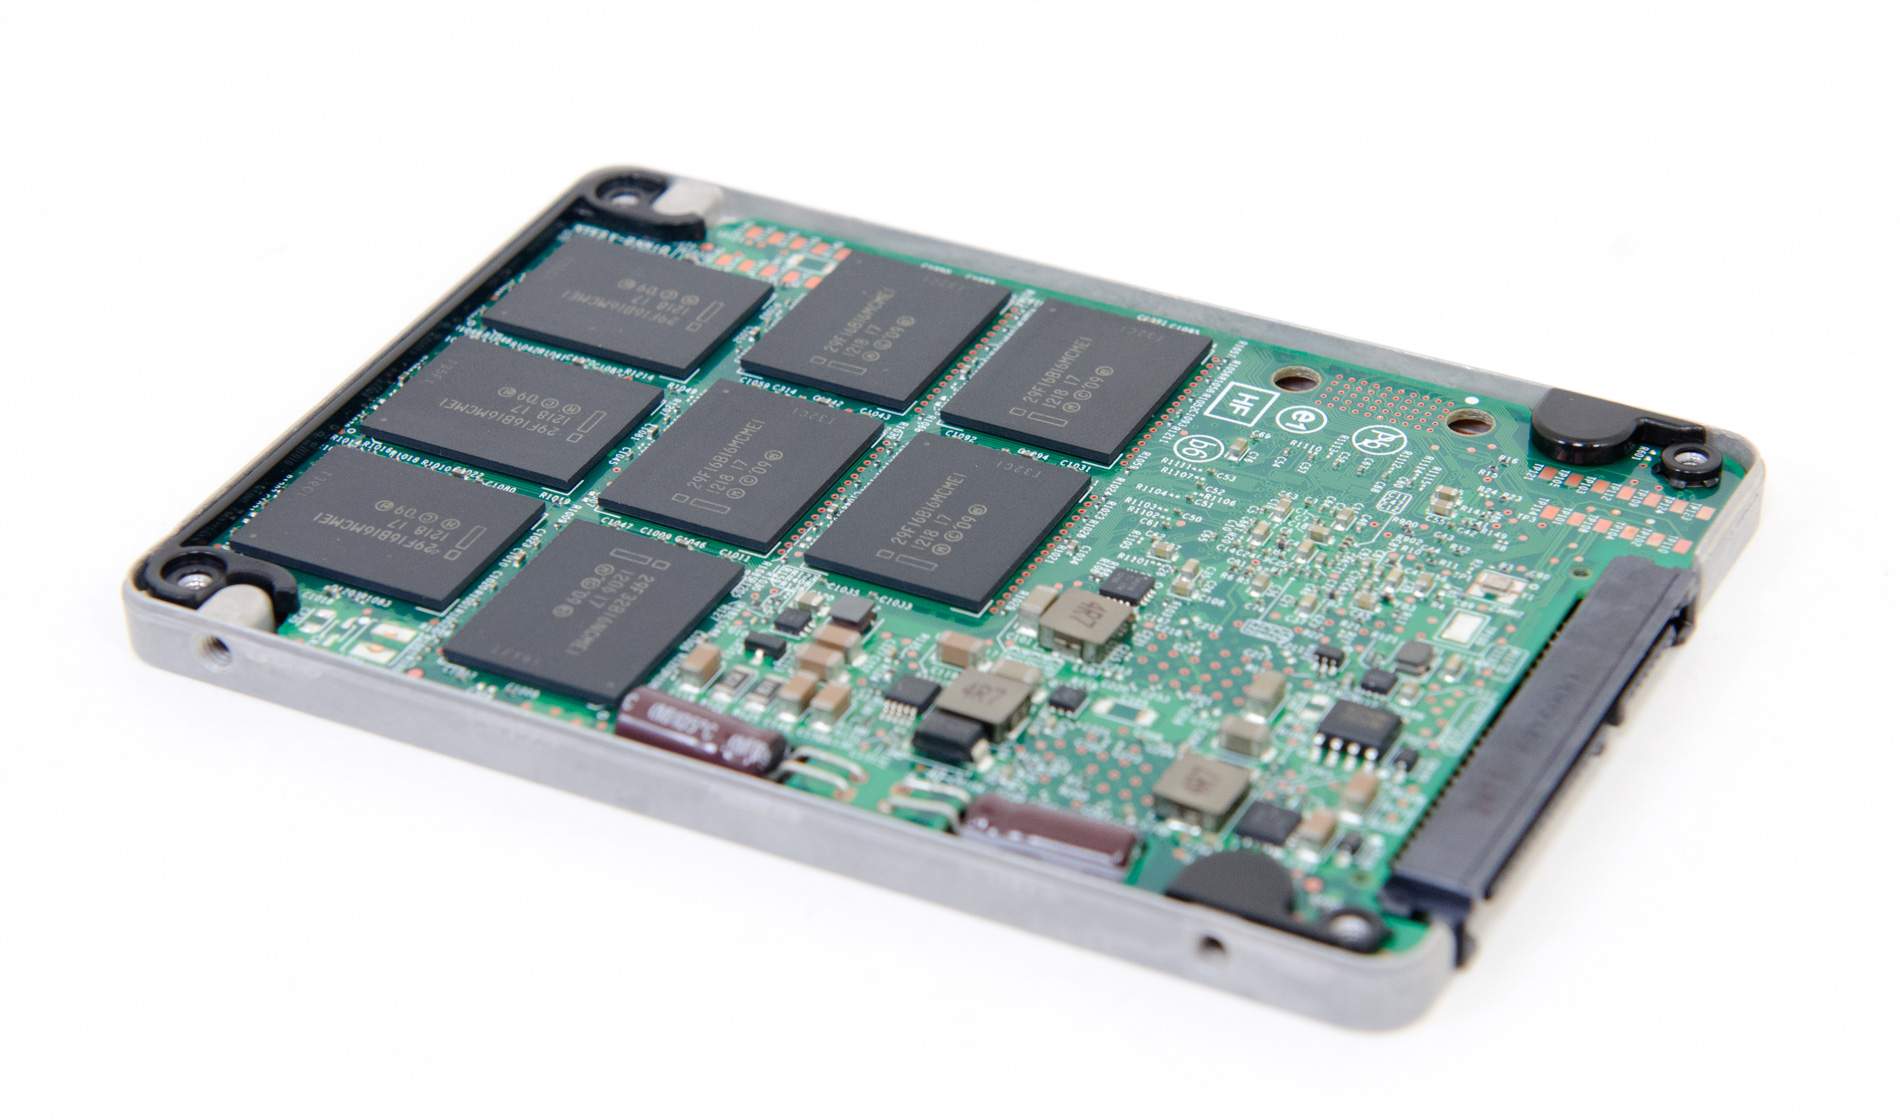
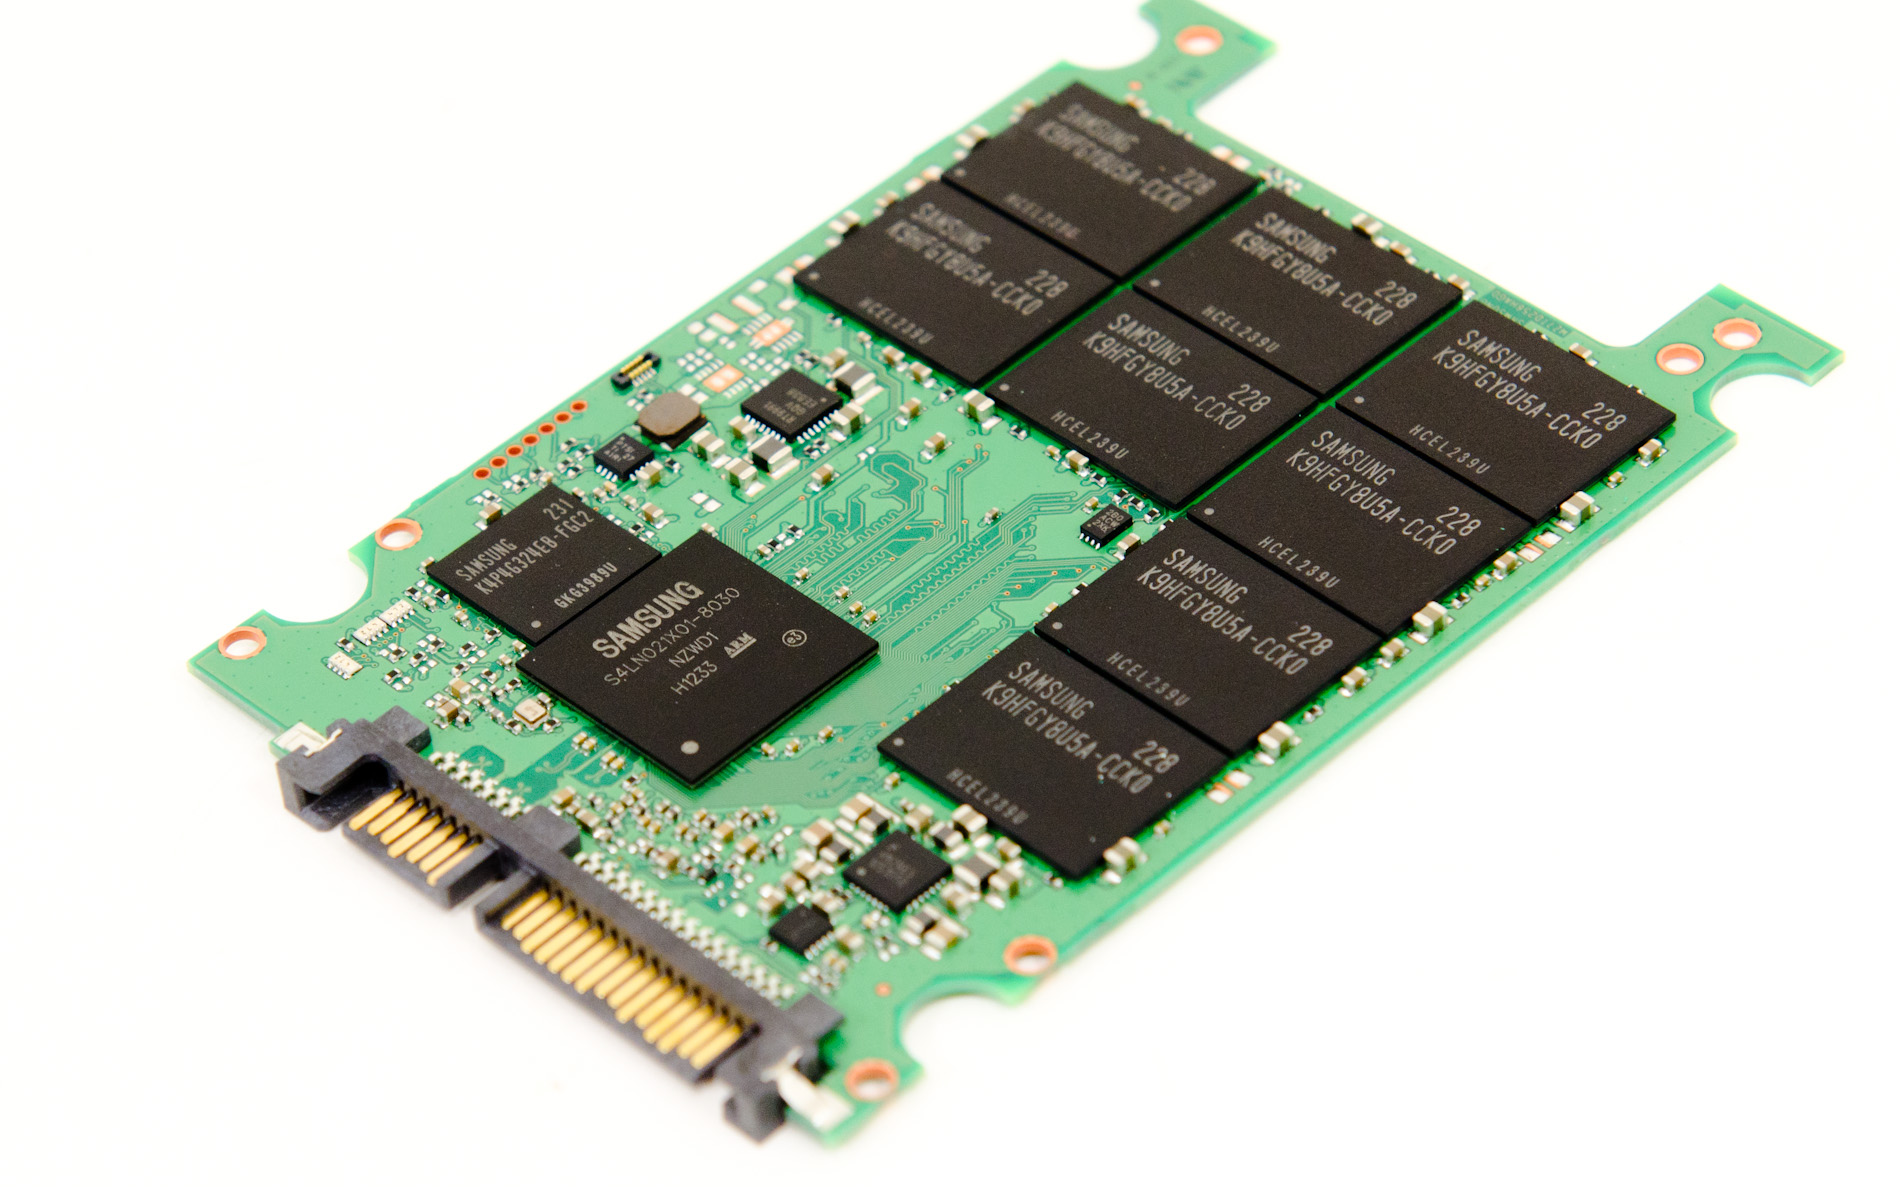
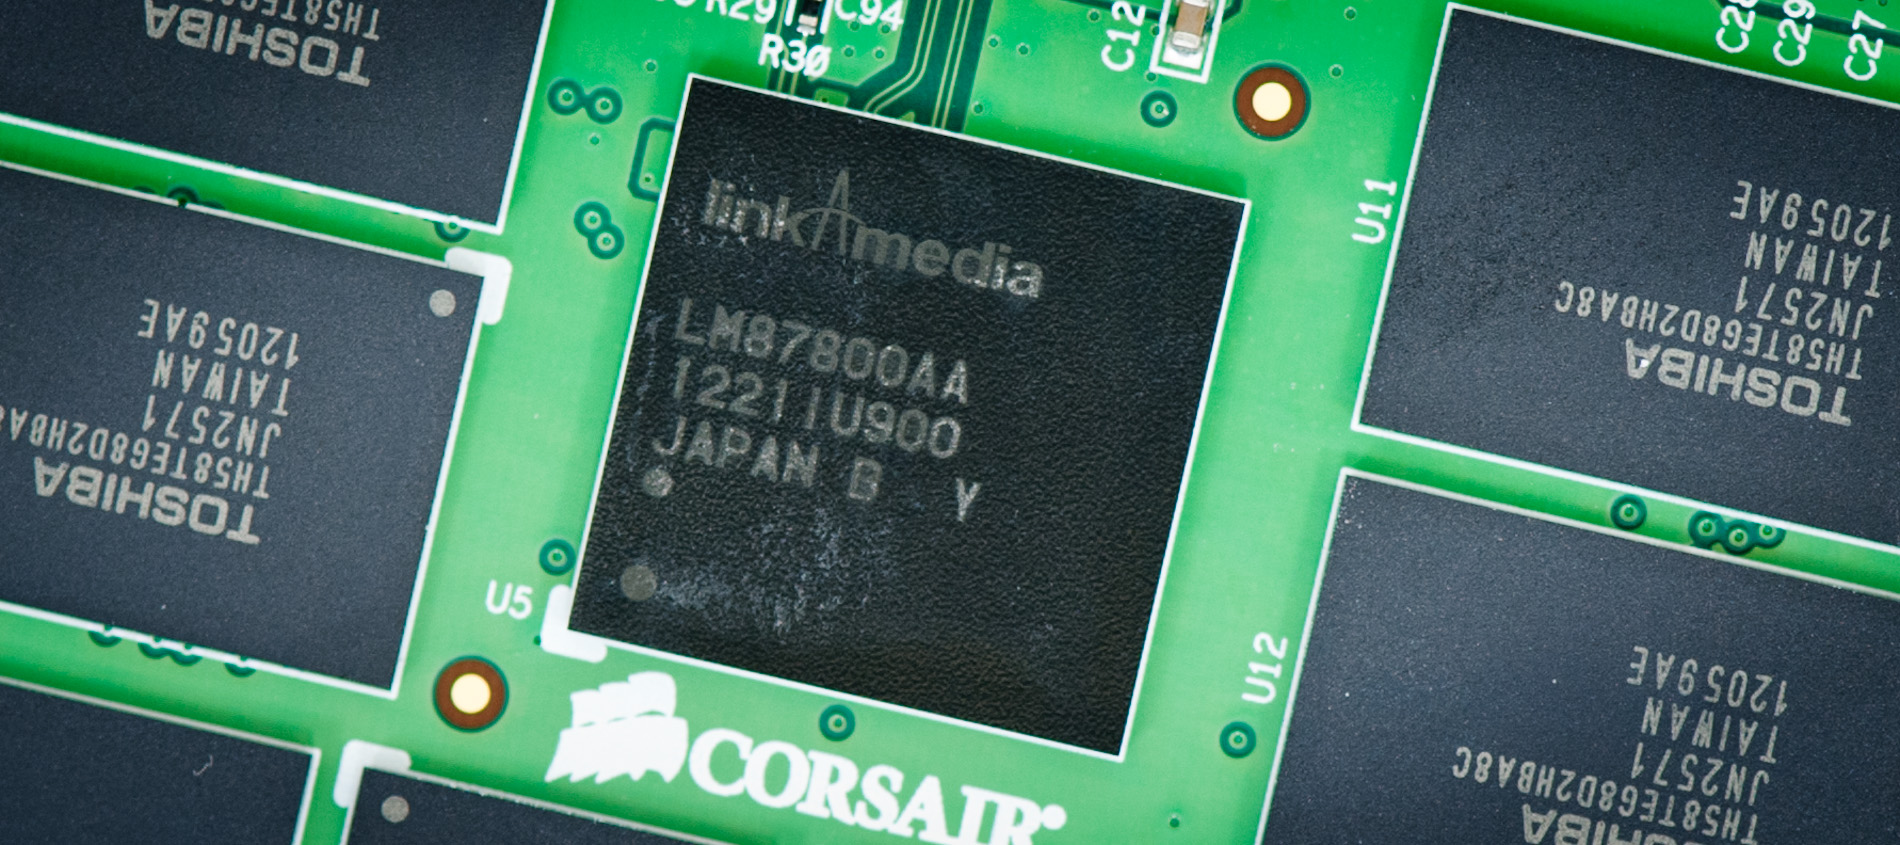
For this investigation I picked a couple of the most interesting, modern SSD controllers: Samsung's MDX controller from the SSD 840 Pro, Link A Media Devices' LM87800 controller from Corsair's Neutron and Barefoot 3 from OCZ's Vector. For all of these drives I used 256GB capacities. With the exception of the Neutron, all of the drives had ~7% of their NAND capacity set aside as spare area. The Neutron is a 240GB drive after its ~12% spare area.
The high level testing methodology remains unchanged from our S3700 review. Unlike in previous reviews however, I did vary the percentage of the drive that I filled/tested depending on the amount of spare area I was trying to simulate. The buttons are labeled with the advertised user capacity had the SSD vendor decided to use that specific amount of spare area. If you want to replicate this on your own all you need to do is create a partition smaller than the total capacity of the drive and leave the remaining space unused to simulate a larger amount of spare area. The partitioning step isn't absolutely necessary in every case but it's an easy way to make sure you never exceed your allocated spare area. It's a good idea to do this from the start (e.g. secure erase, partition, then install Windows), but if you are working backwards you can always create the spare area partition, format it to TRIM it, then delete the partition. Finally, this method of creating spare area works on the drives I've tested here but not all controllers may behave the same way.
In our Intel SSD DC S3700 review I introduced a new method of characterizing performance: looking at the latency of individual operations over time. The S3700 promised a level of performance consistency that was unmatched in the industry, and as a result needed some additional testing to show that. The reason we don't have consistent IO latency with SSDs is because inevitably all controllers have to do some amount of defragmentation or garbage collection in order to continue operating at high speeds. When and how an SSD decides to run its defrag and cleanup routines directly impacts the user experience. Frequent (borderline aggressive) cleanup generally results in more stable performance, while delaying that can result in higher peak performance at the expense of much lower worst case performance. The graphs below tell us a lot about the architecture of these SSDs and how they handle internal defragmentation.
To generate the data below I took a freshly secure erased SSD and filled it with sequential data. This ensures that all user accessible LBAs have data associated with them. Next I kicked off a 4KB random write workload across all LBAs at a queue depth of 32 using incompressible data. I ran the test for just over half an hour, no where near what we run our steady state tests for but enough to give me a good look at drive behavior once all spare area filled up.
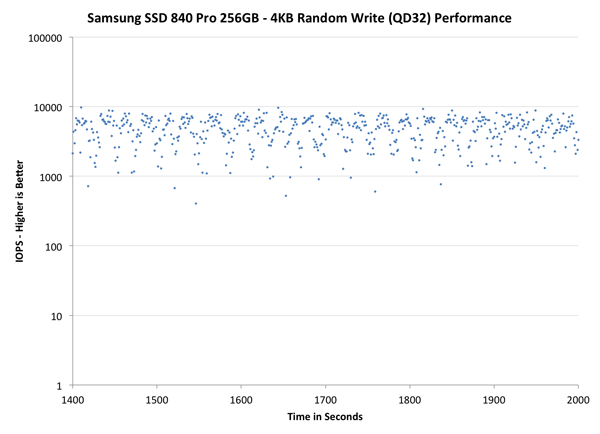
I recorded instantaneous IOPS every second for the duration of the test. I then plotted IOPS vs. time and generated the scatter plots below. Each set of graphs features the same scale. The first two sets use a log scale for easy comparison, while the last set of graphs uses a linear scale that tops out at 40K IOPS for better visualization of differences between drives.
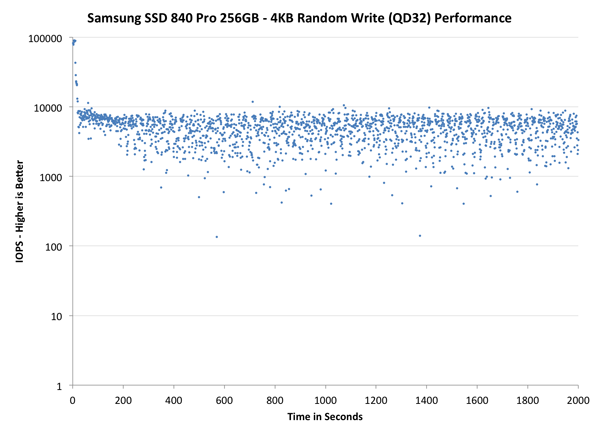
The first set of graphs shows the performance data over the entire 2000 second test period. In these charts you'll notice an early period of very high performance followed by a sharp dropoff. What you're seeing in that case is the drive alllocating new blocks from its spare area, then eventually using up all free blocks and having to perform a read-modify-write for all subsequent writes (write amplification goes up, performance goes down).
The second set of graphs zooms in to the beginning of steady state operation for the drive (t=1400s). The third set also looks at the beginning of steady state operation but on a linear performance scale. Click the buttons below each graph to switch source data.
| Impact of Spare Area | ||||||
| Intel SSD DC S3700 200GB | Corsair Neutron 240GB | OCZ Vector 256GB | Samsung SSD 840 Pro 256GB | |||
| Default | ||||||
| 12% Spare Area | - | - | - | |||
| 25% Spare Area | - | |||||
| 50% Spare Area | - | - | - | |||
I ran the most data on Samsung's SSD 840 Pro as it's likely going to be the most popular of the drives here. If you click through the various simulated capacities/spare area points you'll see the drive's performance consistency improves tremendously once you hit 25% spare area. The drive's IO consistency goes from a spread out mess to something that resembles a thickly painted line across the graph. At 50% spare area, the 840 Pro begins to lose that initial performance cliff and instead develops a much flatter curve. Compared to the S3700 there's still some obvious variation in IO latency (and thus performance) but it's far more controlled than in the default configuration.
OCZ's Vector behaves similarly. The individual IOs on the Vector with 25% spare area are more tightly grouped than on the 840 Pro in general, but you can see OCZ's periodic defrag routine kick in with regular blips that deviate below the curve.
The LAMD based Neutron is actually remarkably consistent even in its default configuration. I originally didn't include the Neutron but Kristian theorized that LAMD's enterprise experience could make for an interesting datapoint here. He was right. The Neutron remains one of the most consistent SSDs out of the box without dedicating any additional spare area to the controller. Even compared to Samsung's SSD 840 Pro at 225GB, the Neutron manages to deliver more consistent performance. The Neutron's curve tightens up at 25% spare area but there's still a good amount of variance. The LAMD defrag routines don't look as predictable/periodic as we've seen on other drives, including the S3700. I wonder if the controller is doing something a bit more dynamic here.
The next set of charts look at the steady state (for most drives) portion of the curve. Here we'll get some better visibility into how everyone will perform over the long run.
| Impact of Spare Area | ||||||
| Intel SSD DC S3700 200GB | Corsair Neutron 240GB | OCZ Vector 256GB | Samsung SSD 840 Pro 256GB | |||
| Default | ||||||
| 12% Spare Area | - | - | - | |||
| 25% Spare Area | - | |||||
| 50% Spare Area | - | - | - | |||
The scale isn't different here, but we do get a better look at steady state consistency. The Neutron continues to impress, looking almost identical to the S3700 if you give up 25% of the drive's NAND to spare area. Samsung also does very well at 25% spare area, there's just a huge improvement there.
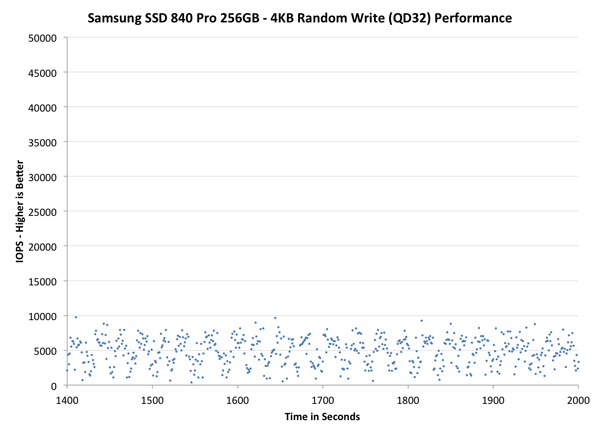
The final set of graphs abandons the log scale entirely and just looks at a linear scale that tops out at 50K IOPS. We're also only looking at steady state (or close to it) performance here:
| Impact of Spare Area | ||||||
| Intel SSD DC S3700 200GB | Corsair Neutron 240GB | OCZ Vector 256GB | Samsung SSD 840 Pro 256GB | |||
| Default | ||||||
| 12% Spare Area | - | - | - | |||
| 25% Spare Area | - | |||||
| 50% Spare Area | - | - | - | |||
Zooming in and looking at a linear scale does show us that additional spare area alone isn't enough to deliver the degree of consistency that Intel's S3700 offers. The solution really has to be a combination of controller and spare area. It's also entirely possible that a controller that prioritizes IO consistency would be able to offset the need for significant spare area. That's definitely the case with Corsair's Neutron, and I'd assume that future derivaties of Intel's S3700 with standard MLC and less spare area will behave similarly. For most consumers this likely won't matter as minimum performance improves substantially once you hit 25% spare area for these drives, but enterprise customers with several if not dozens of SSDs in a RAID array will still benefit from the S3700's architecture.
Final Words
Delivering consistent performance is an important part of improving user experience. As Intel's SSD DC S3700 and Corsair's Neutron have shown, consistent performance is possible through a controller that prioritizes efficient and aggressive defragmentation. I do believe it is important for controller vendors to prioritize IO consistency in their controller and firmware designs.
For drives on the market today that don't already prioritize consistent IO, it is possible to deliver significant improvements in IO consistency through an increase in spare area. OCZ's Vector and Samsung's SSD 840 Pro both deliver much better IO consistency if you simply set aside 25% of the total NAND capacity as spare area. Consumer SSD prices are finally low enough where we're no longer forced to buy the minimum capacity for our needs. Whatever drive you end up buying, plan on using only about 75% of its capacity if you want a good balance between performance consistency and capacity.


134 Comments
View All Comments
kozietulski - Wednesday, December 5, 2012 - link
first, please remember we are taking here about performance for long term heavy (qd32) random 4k write load. It is really not that common case on desktop drives :). Periods of even heavy random writes which are short enough to not exhaust pool of clean blocks do not qualify here. Of course size of clean blocks pool depends directly on the absolute size of free space/OP. So one can say that absolute size of free space defines what is really "short period" of heavy write load and were sustained workloads start :)Now why for such sustained workload what matters for performace is percentage of free space? It is so because - at least for modern SSD - under such worst case workload (again more likely to be found in some enterprise environments then on the desktop) the factor limiting performance is Write Amplification and WA value depends on average number of free pages you (well actually firmware not you nor me :) can find in each and every block in relation to total number of pages per block. The less of free pages in average block the more unwanted baggage must be written back to nand array together with actual data hence the higher WA value is.
Now if we assume random distribution of free space pages amongst all nand blocks (which is pretty natural assumption for sustained random write load) then by definition percentage of free pages per block (and thus WA) is equal to total percentage of free space on the ssd drive.
Thus general conclusion that given ssd drive with two times more of free space - including implicit OP - should be about two times faster (comparing to the same ssd drive of course) under our worst case random workload. Obviousely conclusion has a chance to holds true only as long as WA is the performace bottleneck - sooner or later, depending on drive/firmware details other bottleneck will pop up breaking that nearly linear relation between WA (and effective free space) and performance.
Tjalve - Wednesday, December 5, 2012 - link
As i said in an erlier poost. This scenario is VERY unlikley to happen in a client enviroment. Bithout doing synthertic benchmarks, like we do now, i would say that its impossible and will NEVER happen. This is only interersting if you plan to host your database server or similar, on client SSDs, Witch you shouldnt do in any case.But regarding the data. I testetd between 0 and 16Gb as you said. But with the included OP of evrey drive its alot more then 12,5%.
Total NAND = 128GB or 137,4 GiB. That would mean somthing like 25GB och OP for that test, witch is 18%
gamoniac - Wednesday, December 5, 2012 - link
Anand,This is what I call great journalism!
Would this be applicable to NAND storage on mobile devices that support TRIM either at the OS or controller level? It just seems to me my Android devices run quite a bit slower over time even though I have a lot of storage space left. I don't suppose Android or iOS support TRIM, do they? (And I assume WP8 does...)
jwcalla - Wednesday, December 5, 2012 - link
There's no TRIM in mobile NAND flash memory as the command is part of the SATA interface. In these cases, wear leveling and garbage collection is likely the responsibility of the embedded flash controller.gamoniac - Wednesday, December 5, 2012 - link
Good point. Thanks.skroh - Wednesday, December 5, 2012 - link
Apropos of nothing, the last article (besides causing me to sit up at the Intel 330 results) also inspired me to pull up the Intel Toolbox and look up my usage statistics. I have an 80GB X25-M G2 that I bought in May of 2010. I play a lot of games on that system. In the last 2.5 years of usage, my replacement blocks remaining is at 99% and my write cycles remaining is at 98%. Unless there is some hidden drop-off in the curve waiting ahead for me, this drive may last longer than I do!Jerryrigged - Thursday, December 6, 2012 - link
In the test utilizing default memory allocation, once saturated why not reduce the write workload and see how well each drives garbage collection restores performance?Jerryrigged - Thursday, December 6, 2012 - link
I did not get to complete that email.During the reduced write workload, schedule reading. Some drives are impacted here, such as the Neutron. Do they recover?
Impulses - Thursday, December 6, 2012 - link
Any thoughts on how RAID 0 would impact any of this? (on motherboards that support TRIM over RAID) Same principle (leave 25% free or partition it off) or would RAID change things in any way?AbRASiON - Thursday, December 6, 2012 - link
:/ very very interesting data - it's appreciated.