3DMark for Windows Launches; We Test It with Various Laptops
by Jarred Walton on February 5, 2013 5:00 AM EST3DMark for Windows Overview
After a two-year hiatus, Futuremark is back with a new version of 3DMark, and in many ways this is their most ambitious version to date. Instead of the usual PC graphics benchmark, with this release, dubbed simply “3DMark” (there’s no year or other designation this time), Futuremark is creating a cross-platform benchmark—Windows, Windows RT, iOS, and Android will all be capable of running the same graphics benchmark, sort of. Today’s release is for Windows only, and this is the most feature-packed of the 3DMark releases with three separate graphics benchmarks.
Ice Storm is a DX9-level graphics benchmark (ed: specifically D3D11 FL 9_1), and this is what we’ll see on Android, iOS, and Windows RT. Cloud Gate is the second benchmark and it uses DX10-level effects and hardware, but it will only run on standard Windows; it’s intended to show the capabilities of Windows notebooks and home PCs. The third benchmark is Fire Strike, and this is the one that will unlock the full potential of DX11-level hardware; it’s intended to showcase the capabilities of modern gaming PCs. Fire Strike also has a separate Extreme setting to tax your system even more.
Each of the three benchmarks, at least on the Windows release, comes with four elements: two graphics tests, a physics test, and a demo mode (not used in the benchmark score) that comes complete with audio and a lengthier “story” to go with the scene. I have fond memories of running various demo scene files way back in the day, and I think the inclusion of A/V sequences for all three scenes is a nice addition. Another change with this release is that all resolutions are unlocked for all platforms; the testing will render internally to the specified resolution and will then scale the output to fit your particular display—no longer will we have to use an external display to test 1080p on a typical laptop, hallelujah! You can even run the Extreme preset for Fire Strike on a 1366x768 budget notebook if you like seeing things render at seconds per frame.
As has been the case with most releases, 3DMark comes in three different versions. The free Basic Edition includes all three tests and simply runs them at the default settings; there’s no option to tweak any of the settings, and the Fire Strike test does not include the Extreme preset. When you run the Basic Edition, your only option is to run all three tests (at least on Windows platforms), and the results are submitted to the online database for management. For $24.99, the Advanced Edition adds the Extreme Fire Strike preset, you can run at custom settings and resolutions, and you can individually benchmark the three tests. There are also options to loop the benchmarks and 3DMark has added a bunch of new graphs; you can also save the results offline for later viewing. Finally, the Professional Edition is intended for business and commercial use and costs $995. Besides all of the features in the Advanced Edition, it adds a command line utility, an image quality tool, private offline results option, and it can export the results to XML.
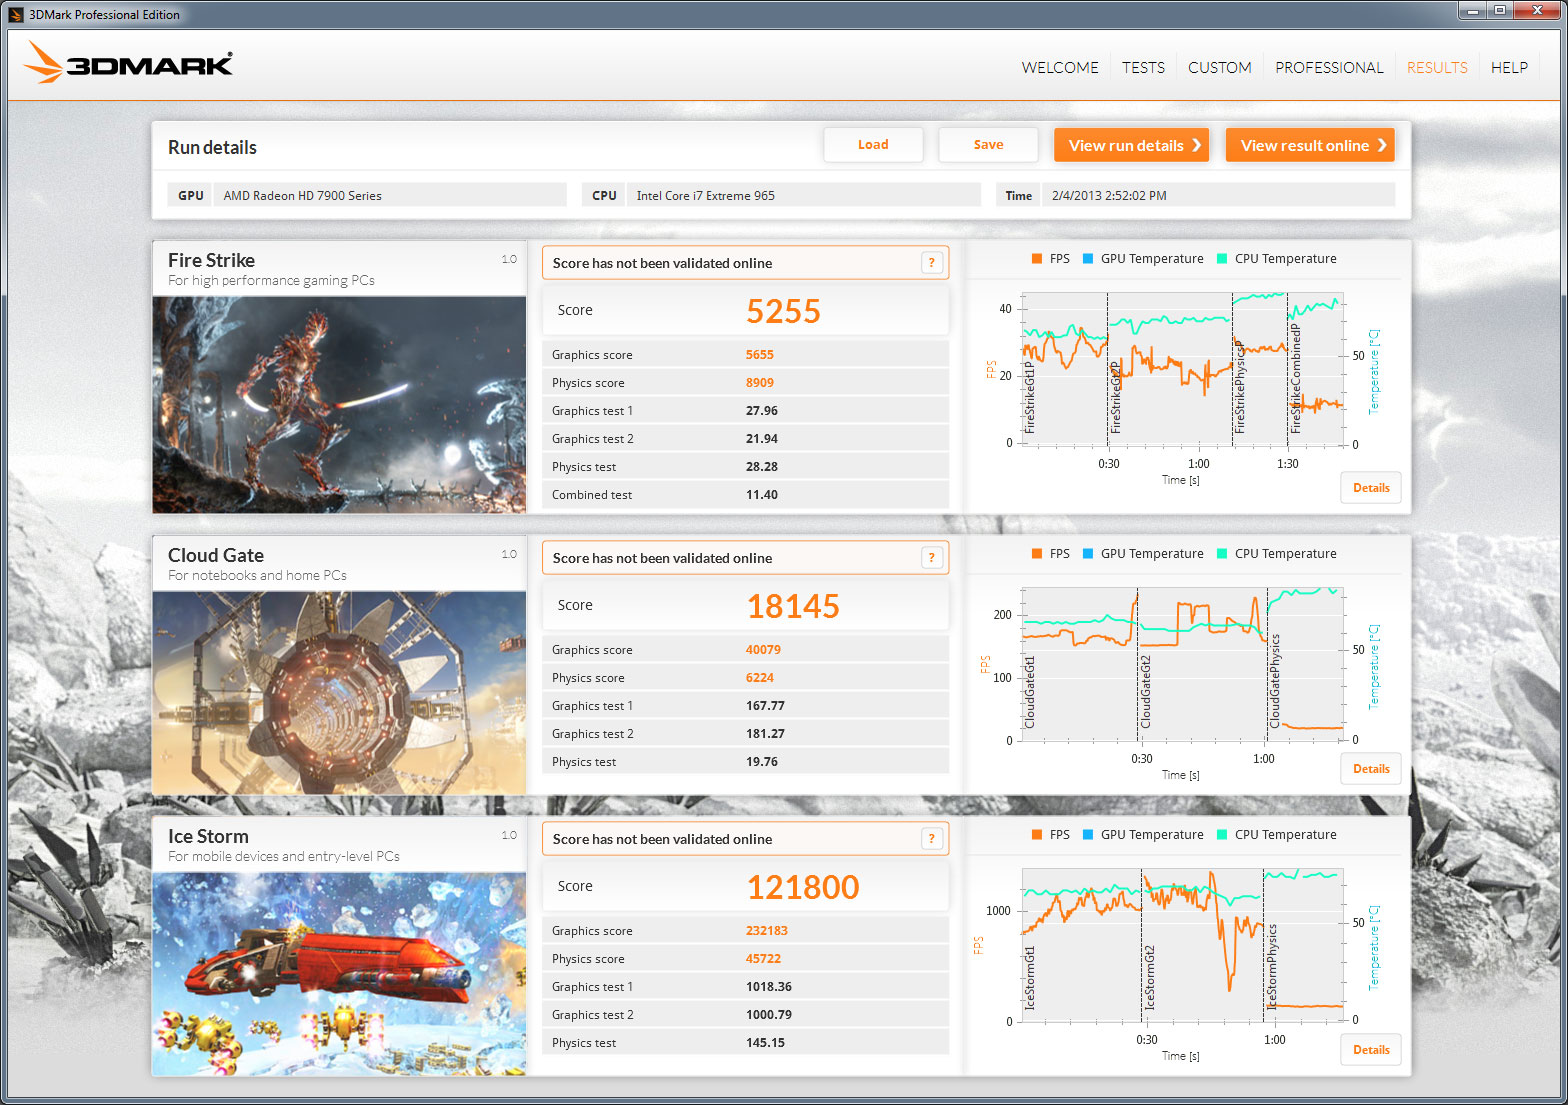
Before we get to some initial results, let’s take a look at one of the cool new features with the latest 3DMark: graphs. Above you can see the post-benchmark results from my personal gaming desktop with a slightly overclocked i7-965X and HD 7950, and along with the usual scores there are graphs for each test showing real-time frame rates and CPU and GPU temperatures. Something I’ve noticed is that the GPU temperatures don’t show up on quite a few of my test systems, and hopefully that will improve with future updates, but this is still a great new inclusion. Each graph also allows you to explore further details:
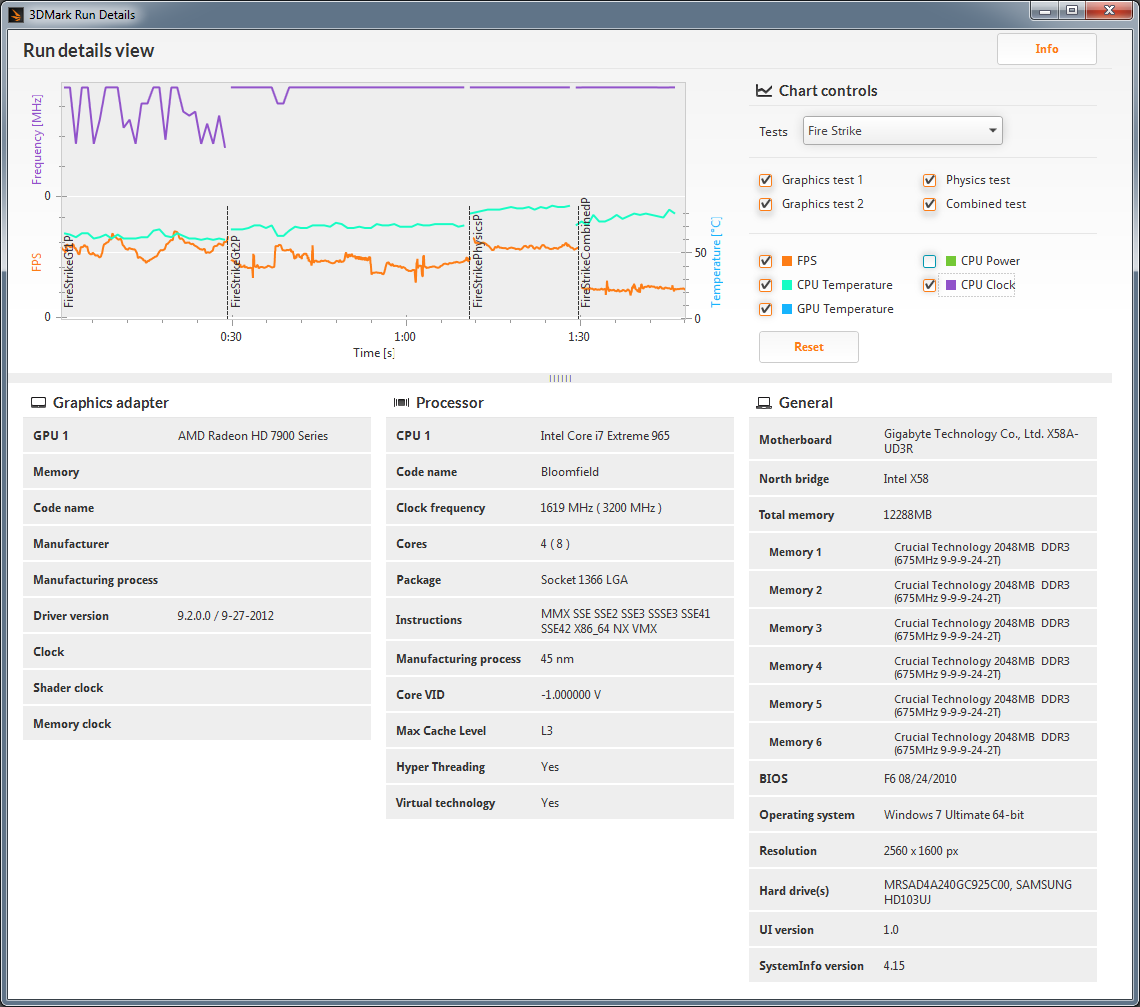
Along with the FPS and temperature graphs, the detailed view also adds the option for CPU clocks and CPU power (though again, power at least isn’t always available depending on the platform, e.g. it’s missing again on my Bloomfield desktop). Something you can’t see with the images is that you can also mouse over and select any of the points on the graphs to get additional details (e.g. frame rate at a specific point), and you can zoom in/out as well. It’s too bad that only paying customers (or press) will be able to get full access to the graphs, but for ORB and overclocking enthusiasts these new features definitely make the $25 cost look more palatable.
Along with the various updates, the UI for 3DMark has change quite a bit as well, presumably to make it more tablet-friendly. I’m not sure how it will work on tablets specifically, but what I can say is that there are certain options that are missing, and the new UI takes some getting used to. For example, even with the Professional Edition, there’s no easy way to run all the benchmarks without the demos. You can run the Ice Storm, Cloud Gate, and Fire Strike benchmarks individually, or you can do a custom run of any of those three, but what I want is an option to run all three tests with custom settings in one batch. This was possible on every previous 3DMark release, so hopefully we get an update to add this functionality (or at least give the Advanced and Professional versions a “run all without demo” on the Welcome screen). Besides that minor complaint, things are pretty much what we’re used to seeing, so let’s do some benchmarking.


69 Comments
View All Comments
Diagrafeas - Tuesday, February 5, 2013 - link
2600K - 7970 OChttp://www.3dmark.com/3dm/15450
and a video from the run
http://www.youtube.com/watch?feature=player_embedd...
lever_age - Tuesday, February 5, 2013 - link
I rarely game on this, but I own a system very similar in specs to the ASUS UX51VZ tested (i7-3630QM instead of i7-3612QM, same exact clocks and memory on a GT 650M, same exact clocks and timing on the RAM) and got somewhat better results. Running 310.90 WHQL.Left number is my Inspiron 17R SE's result, right is the UX51VZ:
Ice Storm:
74570 / 58955
96962 / 72342
41239 / 35781
Cloud Gate:
9514 / 8892
11477 / 11056
5952 / 5277
Fire Strike:
1454 / 1328
1518 / 1367
8288 / 7382
Drivers, or I guess it could be the dynamic clocks of the GPU working higher. Some of the difference is the i7-3630QM at 300-400 MHz higher than a i7-3612QM, but is that supposed to show in the graphics subscores?
JarredWalton - Tuesday, February 5, 2013 - link
It could. I tested all systems with either Catalyst 13.1 or NVIDIA 313.96 drivers, with the exception of the Llano system that's running some ancient driver set because nothing newer will install.relztes - Tuesday, February 5, 2013 - link
Do the graphics and physics tests run sequentially? With integrated graphics they really need to be stressing both components simultaneously. Giving the GPU 17 W and then the CPU 17 W won't reflect the performance in games when the two components have to share 17 W. If the ULV parts hold up a lot better in 3DMark than they do in real games, I think that is to blame.Also, how do these test results change running on battery?
JarredWalton - Tuesday, February 5, 2013 - link
That's the point I'm trying to make: other than Ice Storm, ULV IVB is far closer to DC SV IVB than I would expect it to be, which suggests the results are going to correlate all that well with real games for HD 4000.As for running on battery, how the results change depends heavily on what power settings you use, at least with most of the systems. Set everything for maximum performance and you'll get less battery life but should have similar performance to what you see in the charts. Drop to Power Saver and optimize for battery life and you'll get anywhere from one half to maybe 20% of the performance (e.g. HD 7970M will drop the clocks pretty far if you optimize for power).
Spunjji - Thursday, February 7, 2013 - link
They do indeed run sequentially, except for the final Fire Strike test which is "combined" and also the most taxing by some margin. So you may be on to something there.It's also worth noting that in fine tradition the scores appear to be frame-rate based, so will take little account of the awful stop-start fast-slow chuntering that you get with Intel integrated graphics when they're at their thermal limits.
Landspeeder - Tuesday, February 5, 2013 - link
I would LOVE to see specs for the current crop of high end gaming notebooks. For example -The Clevo P370EM3 / Sager NP9370-3D single 670M, 670M SLI, 680M, 680M SLI, 7970M, 7970M xfire.
The suite of tests done in both 2D and 3D.
The suite of tests done in 7x64 and 8.
Mmmm... can you tell what I've been itching to pick up?
JarredWalton - Tuesday, February 5, 2013 - link
Other than the Alienware M17x R4 and the MSI GX60, I don't have any high-end laptops right now (though I'm trying to get something with GTX 680M to use as a comparison for the above). Regardless, some time in the next few months I'm sure we'll have another high-end laptop or two for testing.Landspeeder - Tuesday, February 5, 2013 - link
Thanks for all that you do Jarred!We are transitioning many of our number crunchers at work from self-built desktops to laptops - the shifting focus of reviews to such equipment here at Anandtech has been a fantastic help and I eagerly consume everything you folks put out.
What city are you located in? If near enough I’d be willing to drop a dual 680M rig loaner for a few days when I pull the trigger post bonus. Have you been able to beg XOTICPC/Sager/AVADirect/ETC for a unit? If not, would you like to enlist my help?
Given the sheer power available on the high end-laptops I’m planning on replacing my gaming rig – a massively overclocked watercooled i920 with dual 280 greens. Most of the games I want to play have some amount of support for 3D. Few games are really pushing today's GPUs/CPUs as the vendors are reined back by console specs. Even the next gen console specs appear to be a bit underwhelming. I’m fairly confident that Clevo’s massive SLI rig fit with dual 680Ms should last a good many years – hopefully. I plan on utilizing a hefty factory overclock, so I hope the heat doesn’t kill the components too quickly. It also helps push this decision that my job now sees me traveling – often with long layovers – and my aging desktop rig is seeing very little use.
MrSpadge - Tuesday, February 5, 2013 - link
That's what the ORB is for. Just wait a few mode days and the results should be there.