MyDigitalSSD BP4 2.5" & mSATA (240GB) Review
by Kristian Vättö on April 3, 2013 11:13 AM ESTRandom Read/Write Speed
The four corners of SSD performance are as follows: random read, random write, sequential read and sequential write speed. Random accesses are generally small in size, while sequential accesses tend to be larger and thus we have the four Iometer tests we use in all of our reviews.
Our first test writes 4KB in a completely random pattern over an 8GB space of the drive to simulate the sort of random access that you'd see on an OS drive (even this is more stressful than a normal desktop user would see). I perform three concurrent IOs and run the test for 3 minutes. The results reported are in average MB/s over the entire time. We use both standard pseudo randomly generated data for each write as well as fully random data to show you both the maximum and minimum performance offered by SandForce based drives in these tests. The average performance of SF drives will likely be somewhere in between the two values for each drive you see in the graphs. For an understanding of why this matters, read our original SandForce article.
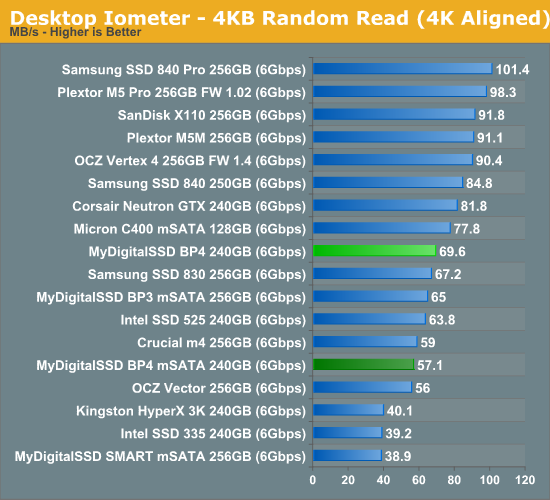
Random read performance has not been dramatically improved. In fact, the mSATA version actually takes a small hit (~12%).
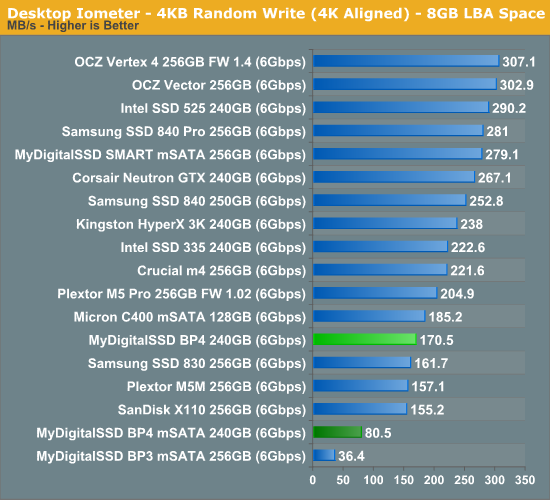
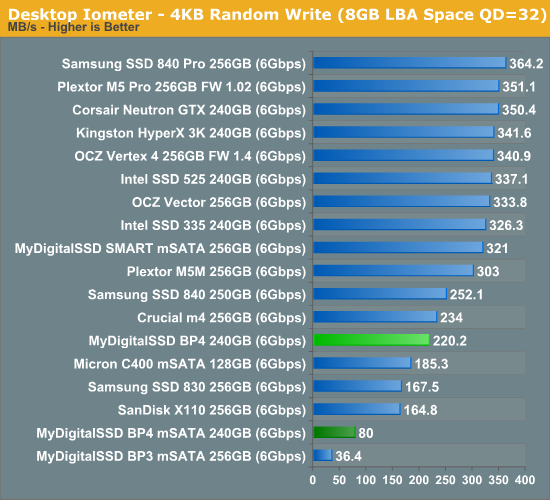
Random write speed, on the other hand, is substantially better. We are still nowhere near SandForce or OCZ Vector numbers but at least the performance is no longer sub-par. The performance also finally scales up as the queue depth increases (at least for the 2.5" model). The scaling could be more aggressive at higher QDs but I'll rather take good low QD performance as that will have a bigger impact in real world performance where most IOs are between QDs of 1 and 5.
Sequential Read/Write Speed
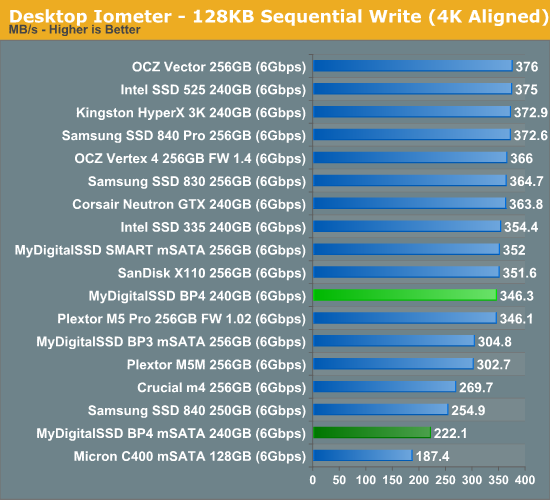
To measure sequential performance I ran a 1 minute long 128KB sequential test over the entire span of the drive at a queue depth of 1. The results reported are in average MB/s over the entire test length.
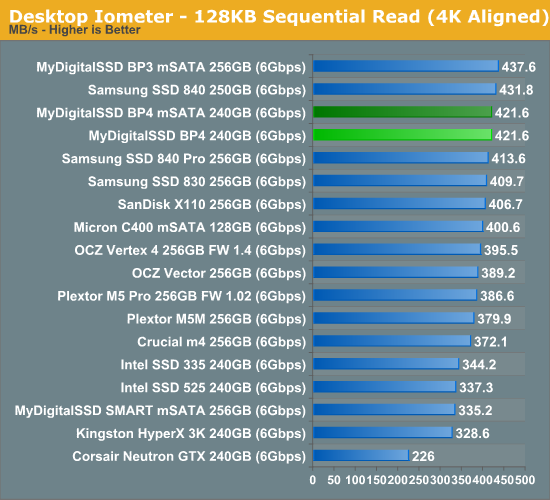
Sequential performance is also very good. Surprisingly the BP4 mSATA is again slower in write performance than the BP3 and compared to the 2.5" BP4, there is quite a big difference.
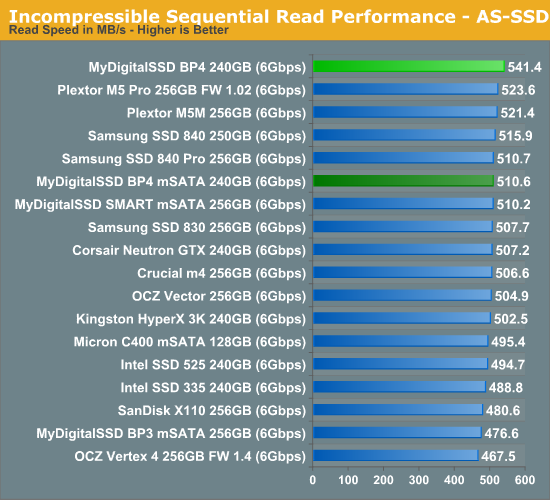
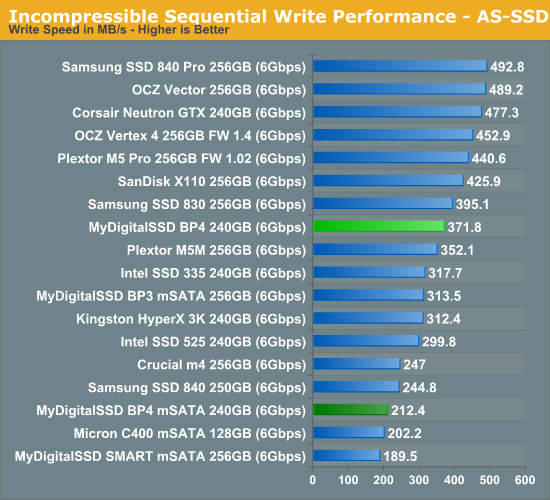
AS-SSD Incompressible Sequential Performance
The AS-SSD sequential benchmark uses incompressible data for all of its transfers. The result is a pretty big reduction in sequential write speed on SandForce based controllers.


35 Comments
View All Comments
MyDigitalSSD - Tuesday, April 9, 2013 - link
240GB mSATA is $179.99 240GB 2.5" SATA is $159.99kallogan - Friday, April 5, 2013 - link
i find it very annoying to see that modern ssds seem to consume as much power as 5400rpm mechanical HDD...Why no classic HDD listed as reference in power consumption chart ?vol7ron - Tuesday, April 9, 2013 - link
Is there any talk about how compliant this is cross-platform?Samsung had firmware issues that pretty much required Windows to update. Do these play nicely with *nix and Mac?
MyDigitalSSD - Tuesday, April 9, 2013 - link
At this time we have had no issues on any platform with the current FW 4.6.MyDigitalSSD
VjRao - Sunday, February 16, 2014 - link
I have a 128 GB MyDigitalSSD that was purchased in October-2012. Its performed with no issues .. I suspect battery performance might not be ideal, or speed either.. I beat up on this system every day.. use it with Linux on my Lenovo T430s. Reading this review wants me to upgrade - especially since I did not have any issues with this manufacturer.. The low price helps too.