FCAT: The Evolution of Frame Interval Benchmarking, Part 1
by Ryan Smith on March 27, 2013 9:00 AM EST
In the last year, stuttering, micro-stuttering, and frame interval benchmarking have become a very big deal in the world of GPUs, and for good reason. Through the hard work of the Tech Report’s Scott Wasson and others, significant stuttering issues were uncovered involving AMD’s video cards, breaking long-standing perceptions on stuttering, where the issues lie, and which GPU manufacturer (if anyone) does a better job of handling the problem. The end result of these investigations has seen AMD embarrassed and rightfully so, as it turned out they were stuttering far worse than they thought, and more importantly far worse than NVIDIA.
The story does not stop there however. As AMD has worked on fixing their stuttering issues, the methodologies pioneered by Scott have gone on to gain wide acceptance across the reviewing landscape. This has the benefit of putting more eyes on the problem and helping AMD find more of their stuttering issues, but as it turns out it has also created some problems. As we laid out in detail yesterday in a conversation with AMD, the current methodologies rely on coarse tools that don’t have a holistic view of the entire rendering pipeline. And as such while these tools can see the big problems that started this wave of interest, their ability to see small problems and to tell apart stuttering from other issues is very limited. Too limited.
In their conversation AMD laid out their argument for a change in benchmarking. A rationale for why benchmarking should move from using tools like FRAPS that can see the start of the rendering pipeline, and towards other tools and methods that can see the end of the rendering pipeline. And AMD was not alone in this; NVIDIA too has shown concern about tools like FRAPS, and has wanted to see testing methodologies evolve.
That brings us to this week. Often evolution is best left to occur naturally. But other times evolution needs a swift kick in the pants. This week NVIDIA has decided to give evolution that swift kick in the pants. This week NVIDIA is introducing FCAT.
FCAT, the Frame Capture Analysis Tool, is NVIDIA’s take on what the evolution of frame interval benchmarking should look like. By moving the measurements of frame intervals from the start of the rendering pipeline to the end of the pipeline, FCAT evolves the state of benchmarking by giving reviewers and consumers alike a new way to measure frame intervals. A year and a half ago the use of FRAPS brought a revolution to the 3D game benchmarking scene, and today NVIDIA seeks to bring about that revolution all over again.
FCAT is a powerful, insightful, and perhaps above all else labor intensive tool. For these reasons we are going to be splitting up our coverage on FCAT into two parts. Between trade shows and product launches we simply have not had enough time to put together a complete and proper dataset for FCAT, so rather than to do this poorly, we’re going to hold back our results until we’ve had a chance to run all of the FCAT tests and scenarios that we want to run
In part one of our series on FCAT, today we will be taking a high-level overview of FCAT. How it works, why it’s different from FRAPS, and why we are so excited about this tool. Meanwhile next week will see the release of part two of our series, in which we’ll dive into our FCAT results, utilizing FCAT to its full extent to look at where FCAT sees stuttering and under what conditions. So with that in mind, let’s dive into FCAT.
Reprise: When FRAPS Isn’t Enough
Since we covered the subject of FRAPS in great detail yesterday, we’re not going to completely rehash it. But for those of you who have not had the time to read yesterday’s article, here’s a quick rundown of how FRAPS measures frame intervals, and why at times this can be insufficient.
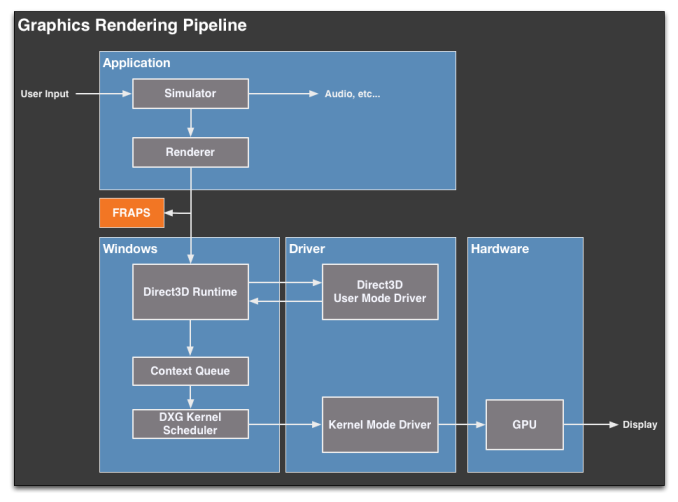
Direct3D (and OpenGL) uses a complex rendering pipeline that spans several different mechanisms and stages. When a frame is generated by an application, it must travel through the pipeline to Direct3D, the video drivers, a frame queue (the context queue), a GPU scheduler, the video drivers again, the GPU, and finally after that a frame can be displayed. The pipeline analogy is used here because that’s exactly what it is, with the added complexity of the context queue sitting in the middle of that pipeline.
FRAPS for its part exists at almost the very beginning of this pipeline. It interfaces with individual applications and intercepts the Present calls made to Direct3D that mark the end of each frame. By counting Present calls FRAPS can easily tell how many frames have gone into the pipeline, making it a simple and effective tool for measuring average framerates.
The problem with FRAPS as it were, is that while it can also be used to measure the intervals between frames, it can only do so at the start of the rendering pipeline, by counting the time between Present calls. This, while better than nothing, is far removed from the end of the pipeline where the actual buffer swaps take place, and ultimately is equally removed from the end-user experience. Furthermore because FRAPS is so far up the rendering pipeline, it’s insulated from what’s going on elsewhere; the context queue in particular can hold up to 3 frames, which means the rate of flow into the context queue can at times be very different from the rate of flow outside of the context queue.
As a result FRAPS is best descried as a coarse tool. It can see particularly egregious stuttering situations – like what AMD has been experiencing as of late – but it cannot see everything. It cannot see stuttering issues the context queue hides, and it’s particularly blind to what’s going on in multi-GPU scenarios.


88 Comments
View All Comments
Th-z - Wednesday, March 27, 2013 - link
This can be time consuming and costly, but for the authenticity of FCAT's numbers, reviewers can always cross-ref with a second set of tool, e.g. high speed camera in random sections of a benchmark run to see if two results are consistent. If the stutter is really bad, a player can also detect it by eyes. My way of checking how constant the frames are is to move side to side with constant speed if it's a first person shooter (A and D in WASD config), or a controller to move left stick all the way to left or right for other types of games.Kevin G - Wednesday, March 27, 2013 - link
A couple of generic questions regarding FCAT and the extractor tools.I presume that the same color will appear across multiple frames on the monitor if the FPS is below 60?
Are the colors chosen random or do they repeat in a regular pattern? IE red green blue yellow red green blue yello red green blue yellow etc.
Does the extractor tool just use the color bar or does it attempt to determine where in a scan line a new frame starts?
Can this be used on an Eyefinity/Surround setup? Does only one of the monitors need to be captured? What is the maximum resolution that can be captured?
Looking at PLOT.png, there already appears to be some abnormally large spikes. Is there going to be any sort of visual inspection to verify that such oddities are just performace spike and not something erroneous going on with FCAT?
If FCAT and FRAPS are used simultaneously, which one intercepts the Present call first to process an overlay?
Kevin G - Wednesday, March 27, 2013 - link
Two more questions:What happens when the Present call is invokes when the color bar is being drawn on screen? IE one scan lines has the color bar composed of two different colors? Does the extractor record this as one scan line as one frame? (For example this could lead to a spike where one frame is recorded at 1080 fps on a 1080p display.)
If FRAPS can determine the frame rate from the application's perspective and FCAT can records the frame rate at the display level, then couldn't the latency invoked by just the OS/driver be determined on a per frame basis? Determining this latency would be interesting.
Can FCAT be used to determine the where a frame was rendered in a multiple GPU set up? IE each GPU is only allowed a specific subset of colors to use for their color bar.
Ryan Smith - Friday, March 29, 2013 - link
1) A scan line cannot be composed of two different colors. A frame cannot be switched mid-line. It has to wait until the end of the line.2) So without timestamping and clock syncing, we would not be able to determine latency. It wouldn't be possible to easily match up frames to present calls, nor how long it took that one frame to traverse the pipe.
3) No. FCAT cannot tell us which GPU rendered a frame. AFR is too abstracted from the rendering pipeline for that.
Ryan Smith - Friday, March 29, 2013 - link
1) Correct. If the FPS is below 60, the monitor would be repeating part of a frame, so the color bar would stay the same until a new frame is finally served up.2) The colors are in a regular pattern of 16 colors to detect dropped frames.
3) The extractor tool only looks for the color bar
4) Yes, this can be used on a surround setup. You'd just capture the leftmost display. The maximum resolution right now would be 2560x1440 (the limits of the capture card), which would be part of a 7680x1440 or 12800x1440 setup.
5) We've already taken a look at results like those. FCAT is almost dead simple; those aren't anomalies in FCAT.
6) It would be FRAPS first, then FCAT. NVIDIA suggests starting FRAPS second, so it comes earlier in the chain.
wingless - Wednesday, March 27, 2013 - link
Frame Render Ahead/Pre-Rendering (frames prepared by the CPU ahead of time)? How does this option change the outlook for SLI and Crossfire? The Battlefield 3 community is saying if you change this value to 0 or 1 versus the default value of 3, game play is smoother. I've done it myself on my old HD 4870 Crossfire setup on a i7-2600k+Z77 system and it does seem to help.Does this pre-rendering affect the amount of runt frames on an SLI/Crossfire configuration?
What is the affect of different CPU/Chipset combinations. At one point folks used to say AMD system felt smoother, despite showing lower FPS.
Thanks for your analysis!
marc1000 - Wednesday, March 27, 2013 - link
so, this new method requires a PCIe card to capture the video? is that correct?bobbozzo - Wednesday, March 27, 2013 - link
It requires a capture card, and the capture probably needs to be done in a different computer, otherwise game performance would suffer.Ryan Smith - Friday, March 29, 2013 - link
Correct. A separate system must be running a capture card to capture the output of the test system. We're using a Datapath Limited VisionDL-DVI card.HisDivineOrder - Wednesday, March 27, 2013 - link
Soooo... not only did AMD NOT realize that this was an issue, but nVidia has known enough to worry about this particular issue for YEARS and develop a tool to detect and measure it.Wow, AMD. You were behind the curve BEFORE you fired all those engineers in your R&D. The more this story develops, the more sad it becomes. Damn. It's like you're a farmer who failed to realize that you have to spray your fields for insects in addition to fertilizing them.