The Great Equalizer: Apple, Android & Windows Tablet GPUs Compared using GL/DXBenchmark 2.7
by Anand Lal Shimpi on March 31, 2013 11:58 PM EST_678x452.png)
For the past few years we have been lamenting the state of benchmarks for mobile platforms. The constant refrain from those who had been around long enough to remember when all PC benchmarks were terrible was to wait for the release of Windows 8 and RT. The release of those two OSes would bring many of the traditional PC benchmark vendors space into the fray. While we're expecting to see new Android, iOS, Windows RT and Windows 8 benchmarks from Futuremark and Rightware, it's our old friends at Kishonti who are first out of the gate with a cross-OS/API/platform benchmark. GLBenchmark has existed on both Android and iOS for a while now, but we're finally able to share information and performance data using DXBenchmark - GLB's analogue for Windows RT/8.
As the name difference implies, DXBenchmark uses Microsoft's DirectX API while GLBenchmark relies on OpenGL ES. The API difference alone makes true cross-platform comparison difficult, especially since we're comparing across APIs, OSes and hardware - but we at least have the option to get a rough idea of how these platforms stack up to one another. There are a lot of improvements expected with Windows Blue later this year from a platform optimization standpoint from the ARM based SoC vendors, so I wouldn't read too much into any of the Android vs. Windows RT comparisons of the same hardware (even though some key results end up being very close).
While GLBenchmark 2.7 doesn't yet take advantage of OpenGL ES 3.0 (GLB 3.0 will deliver that), it does significantly update the tests to recalibrate performance given the advances in modern hardware. Version 2.7 ditches classic, keeps Egypt HD and adds a new test, T-Rex HD, featuring a dinosaur in pursuit of a girl on a dirt bike:

Scene complexity goes up tremendously with the T-Rex HD benchmark. GLBenchmark has historically been more computationally bound than limited by memory bandwidth. The transition to T-Rex HD as the new flagship test continues the trend. While we see scaling in average geometry complexity, depth complexity and average memory bandwidth requirements, it's really in the shader instruction count that we see the biggest increase in complexity:
| GL/DXBenchmark 2.7: T-Rex HD Compared to Egypt HD Benchmark | |||||||
| Increase in T-Rex HD | |||||||
| Average Geometry Complexity | +55% | ||||||
| Average Depth Complexity | +41% | ||||||
| Average Texture Memory Bandwidth Requirements | +41% | ||||||
| Average Shader Instruction Count | +165% | ||||||
T-Rex HD should benefit from added memory bandwidth, but increases in raw compute performance will be most visible. Given the comparatively static nature of memory bandwidth improvements, scaling shader instruction count to increase complexity makes sense.
Just as before, both GL and DXBenchmark 2.7 can run in onscreen (native resolution, v-sync enabled) and offscreen (1080p, v-sync disabled) modes.
The Android and iOS versions retain the UI of their predecessors, while DXBenchmark 2.7 introduces a Windows RT/8 flavored take on the UI:
.png)
There will be a unified database of scores across both GL and DXBenchmark once the latter gets enough submissions.
The low level tests are comparable between GLBenchmark 2.5 and 2.7, only results from the new T-Rex HD benchmark can't be compared to anything GLBenchmark 2.5 produced (for obvious reasons).


_thumb.png)
Now time for the exciting part. The usual suspects from the iOS and Android worlds are present, I didn't include anything slower than a Tegra 3 given how low T3 scores in the T-Rex HD test. From the Windows RT camp we've got Microsoft's Surface RT (Tegra 3) and Dell's XPS 10 (APQ8060A/Adreno 225). The sole 32-bit Windows 8 Pro representative is ASUS' VivoTab Smart (Atom Z2560/PowerVR SGX 545). Finally, running Windows 8 Pro (x64) we have Microsoft's Surface Pro (Core i5-3317U/HD 4000) and the Razer Edge (Core i7-3517U/GeForce GT 640M LE).
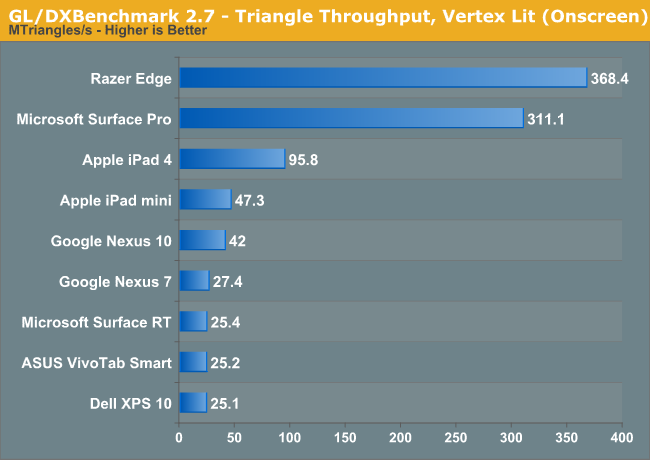
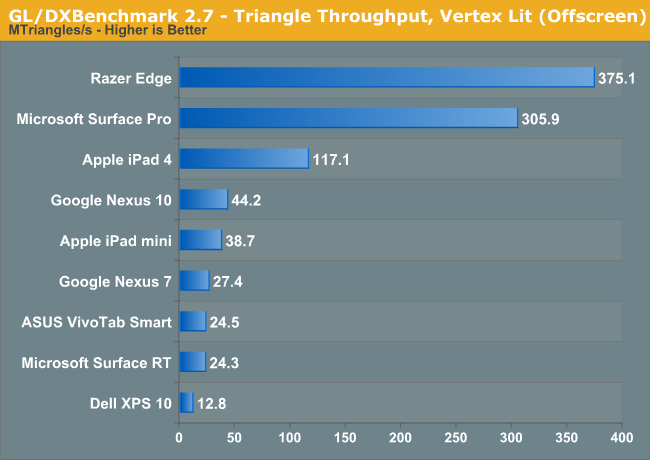
As always, we'll start with the low level results and move our way over to the scene tests:
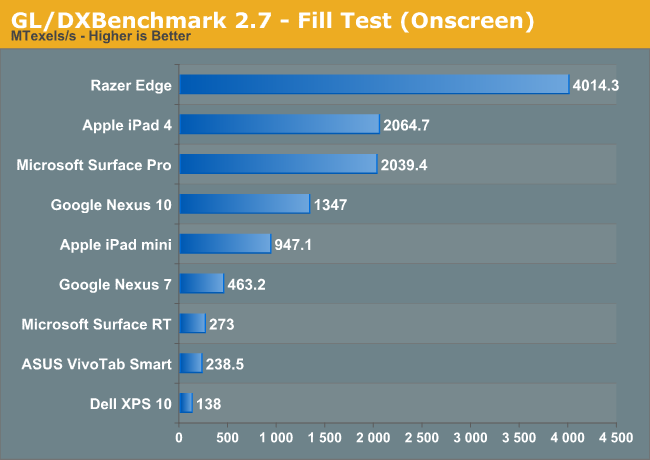
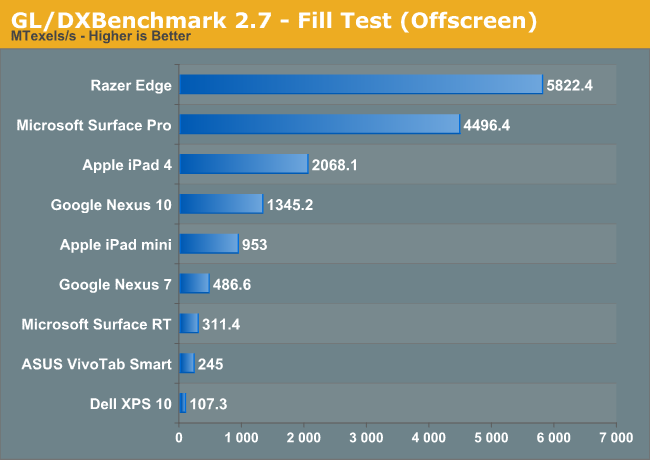
Looking at the fill rate tests, we have the first indication of how Intel's HD 4000 graphics compares to the best in the tablet space. Unconstrained, Surface Pro delivers a fill rate of over 2x that of the 4th generation iPad. NVIDIA's GeForce GT 640M LE delivers nearly 3x the fill rate of the iPad 4.
The Mali-T604 in Google's Nexus 10 finds itself in between the iPad 4 and iPad mini, while Tegra 3 ends up faster than both the Clover Trail and Qualcomm Windows RT platforms. It's interesting to note the big difference in fill rate between the Nexus 7 (Android/Tegra 3) and Surface RT (Windows RT/Tegra 3). You would think that driver maturity would be better on Windows for NVIDIA, but assuming this isn't some big API difference it could very well be that Tegra 3 on Android is more mature.
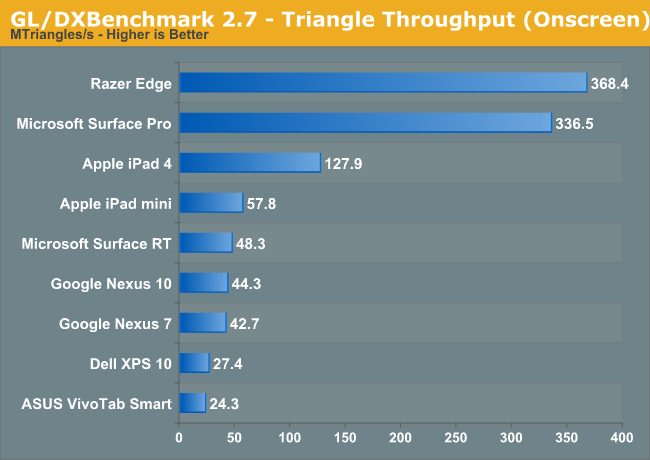
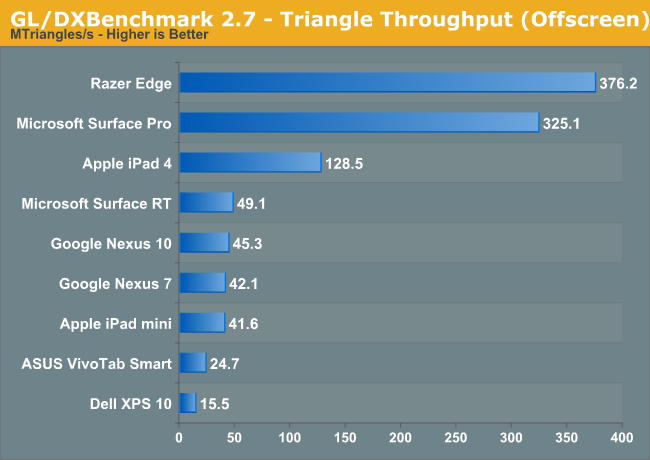
The gap in geometry performance between Intel's HD 4000 and Imagination Tech's PowerVR SGX 554MP4 grows to over 2.5x. Surface RT and the Nexus 7 switch positions, and grow a lot closer than they were in the fill rate test. Qualcomm's Windows RT platform remains at the bottom of the list, and Intel's Clover Trail remains disappointing in the graphics department.
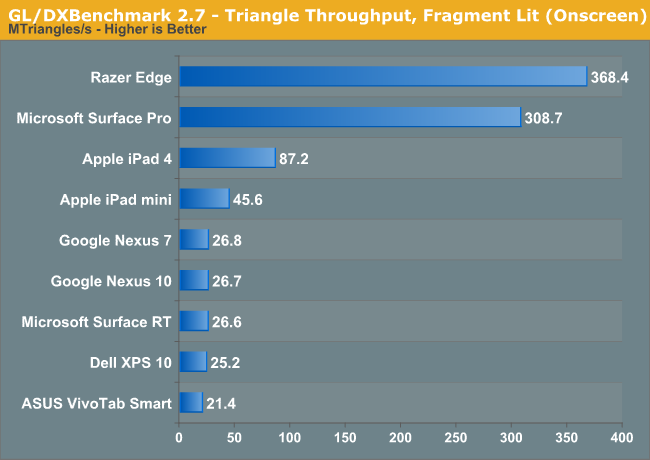

Increase the complexity of the triangle test and things don't change all too much.
Moving on to the scene tests, we have the first look at the current landscape of T-Rex HD performance on tablets. When Egypt HD first came out, the best SoCs were barely able to break 20 fps with the majority of platforms delivering less than 13 fps. In the 8 months since the release of GLBenchmark 2.5, the high end bar has moved up considerably. The best tablet SoCs can now deliver more than 40 fps in Egypt HD, with even the latest smartphone platforms hitting 30 fps. T-Rex HD hits the reset button, with the fastest ARM based SoCs topping out at 16 fps.
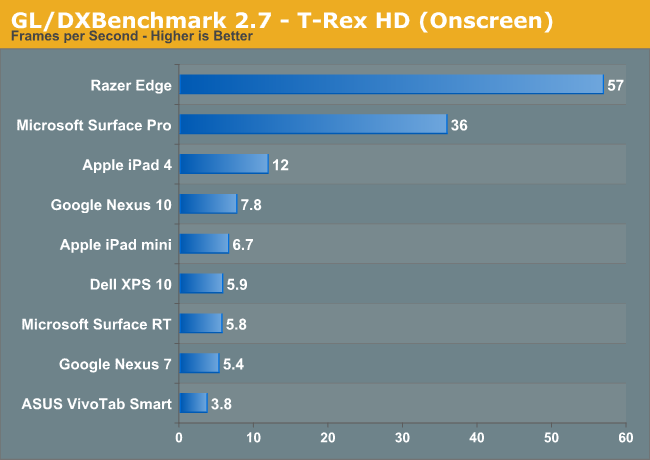
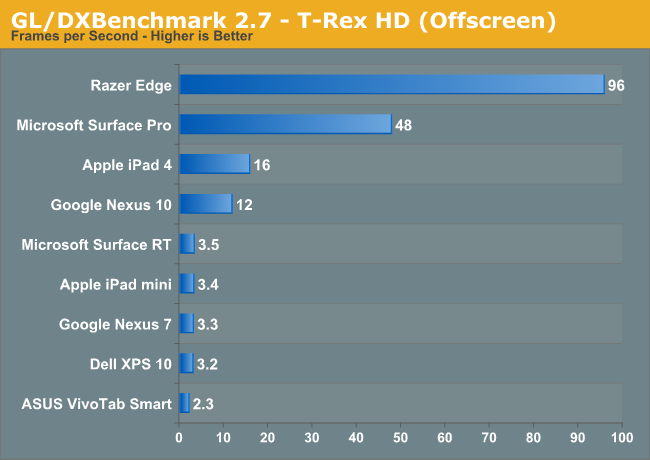
Looking at the offscreen results, we finally get what we came here for. Intel's HD 4000 manages to deliver 3x the performance of the PowerVR SGX 554MP4, obviously at a much higher power consumption level as well. The Ivy Bridge CPU used in Surface Pro carries a 17W TDP, and it's likely that the A6X used in the iPad 4 is somewhere south of 5W. The big question here is how quickly Intel can scale its power down vs. how quickly can the ARM guys scale their performance up. Claiming ARM (and its partners) can't build high performance hardware is just as inaccurate as saying that Intel can't build low power hardware. Both camps simply chose different optimization points on the power/performance curve, and both are presently working towards building what they don't have. The real debate isn't whether or not each side is capable of being faster or lower power, but which side will get there first, reliably and with a good business model.
To put these results in perspective, the GPU in the Xbox 360 still has around 3x the compute power of what's in the iPad 4. We're getting closer to having current (soon to be previous) gen console performance in our ultra mobile devices, but it'll take another year or two to get there in the really low power devices. Surface Pro is already there.
The rest of the players here aren't that interesting. Everything from the Tegra 3 to the old A5 in the iPad mini performs fairly similarly when faced with the same display resolution (1080p). Despite standings in some of the lower level benchmarks, Qualcomm's aging APQ8060A platform in the Dell XPS 10 (Windows RT) manages a healthy performance advantage over Intel's Atom Z2560 - both aren't particularly exciting parts from a graphics performance standpoint however. It's interesting to note just how close Surface RT and the Nexus 7 are here, given that they are running different OSes, using different APIs but powered by the same Tegra 3 SoC.
The only other scene test we have is Egypt HD, which is a known quantity these days. The only new bits are the inclusion of the Windows players using DXBenchmark:
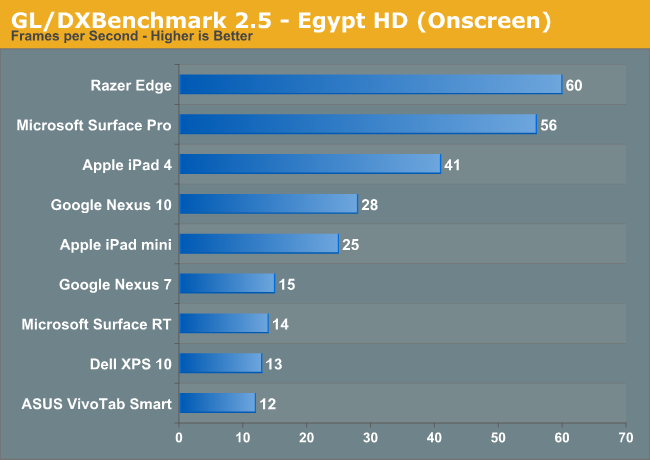
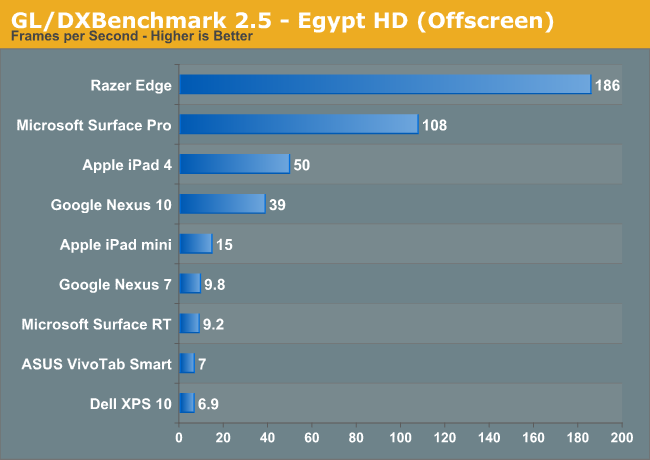
Everyone's performance looks a lot better under the Egypt HD test, which is of course the motivation for creating the T-Rex HD test. Also interesting to note is the Apple/Intel gap shrinks a bit here, now the advantage is only 2x. It's important to put all of this in perspective. If your ultimate goal is to be able to run a shader heavy workload like T-Rex HD, then most of the tablet platforms have a long way to go. If Epic's Citadel demo release on Android is any indication however, there's a lot that can be done even with the mainstream level of performance available on smartphones and tablets today. Identifying and delivering the best performance at whatever that sweet spot may be is really the name of the game here, and it's one that the ARM folks have done a great job of playing.
I'm very curious to see how these graphs change over the next two years. I don't suspect Haswell will shift peak platform power down low enough to really be viewed as an alternative to something like an iPad, but with Broadwell (2014) and Skylake (2015) that may be a possibility. The fact that these charts are even as close as they are, spanning 7-inch tablets all the way up to full blown PC hardware, is an impressive statement on the impact of the mobile revolution.


83 Comments
View All Comments
MonkeyPaw - Monday, April 1, 2013 - link
Yeah, I have a Nexus 7 right now, and I'm on hold for AMD's offerings. The current Atom SOC has such a bad GPU that it really gets noticeable in even simple games. I like AMD's reference design and the turbo dock concept, and I think they will offer more low-end value than Intel.That said, I'm air disappointed with the XPS 10. I almost bought one last week, and I'm quite surprised that the theoretical advantages it has over T3 do not show up. Drivers maybe? Or is it because it only has 2 cores?
UpSpin - Monday, April 1, 2013 - link
Because the difference between the Razer Edge and the Surface Pro in this benchmark is minimal and on some charts even wrong, whereas in real life the nVidia GPU is magnitudes faster, this benchmark seems to be flawed and wrong. (either Intel paid them a lot, or the benchmakr is crap, and I expect from a techsite like Anandtech to validate a benchmakr before posting results): http://www.anandtech.com/show/6858/the-razer-edge-...Or does it make sense for you, that in T-Rex HD Onscreen the Surface Pro displaying 1080p outperforms the Razer Edge displaying on just 720p, yet, in Offscreen the Razer Edge is faster suddenly. That makes absolutely no sense.
Additionally is this article flooded with useless and meaningless synthetic benchmarks.
Bases on this flaws, this article and the whole benchmakr became uselesss.
ChronoReverse - Monday, April 1, 2013 - link
GLBenchmark has always had these sort of problems and many people have posted complaints about that in the comments for the mobile reviews but nothing has ever been done about it.All the synthetics being posted is even more silly. What does it matter if GPU X can do Y amount of triangles if you'll never even touch that theoretical limit in even a benchmark (that actually draws something).
It may be academically interesting, but putting it up front and center inflates its significance.
Bast - Monday, April 1, 2013 - link
The whole thing smells fishy, I agree.Take a look at the results of the surface pro onscreen vs off screen. The only difference in these is the v-sync (resolution is 1080p in both). The results vary wildly between twice as fast when v-sync is off and slightly slower. That calls into question what is the effect of v-sync on the various parameters in the benchmark and until that can be answered , I would be very hesitant to make any conclusions. Is it possible to run the offscreen test with v-sync on as well?
extide - Monday, April 1, 2013 - link
That makes absolutely no sense. You can't do an offscreen render with v-sync as there is no screen to sync to. It just draws as fast as it can..whyso - Monday, April 1, 2013 - link
I agree that this test is not indicative of performance (or else seems to be very heavily optimized for mobile SOCs). The 640m LE is generally about twice a powerful as the ULV hd 4000 and I'm not seeing that.Anand Lal Shimpi - Monday, April 1, 2013 - link
Check the updated numbers :)UpSpin - Monday, April 1, 2013 - link
Thank you, makes much more sense now.Suggestions:
- In onscreen benchmarks often V-Sync is the limiting factor. Maybe you can make this visible in the chart with a vertical line indicating 60FPS V-Sync, so people with less knowledge about technology better understand the chart. Additionally, because you always run both on and off-screen, yet, only offscreen makes a comparison between GPUs possible, you could combine both charts and use two bars for each GPU in a single chart (a small bar for onscreen, the prominent one for offscreen)
- The synthetic benchmarks are meaningless. The HD4000 seems to be almost as fast as the nVidia card, yet, in game benchmarks is less than half as fast. So those synthetic benchmarks don't show reality. Quite contrary, Intel seems to be cheating. The Fill Test offscreen performs two times better than the Fill Test offscreen, yet, the resolution (1080) should remain unchanged. (or your results are flawed, again ^^)
Well, it's always easy to fill an article with charts, but at least remove the onscreen synthetic benchmarks. Even better, put all synthetic offscreen benchmarks in a single chart, so one GPU/Product has several bars, one bar for each test, 4 bars in total in different colors.
That way people take a closer look at the 'real world benchmarks' and don't waste their time comparing synthetic benchmarks.
At least I hope that you change something. At the moment the benchmarks are a 'mess' and hard to decipher.
extide - Monday, April 1, 2013 - link
The reason the Surface Pro performs better in off-screen is because it is hitting the fps cap in on-screen. Not sure why that is confusing.UpSpin - Monday, April 1, 2013 - link
I'm talking about the synthetic benchmark which gets measured in MTexels/s or MTriagels/s and should be independent of the V-Sync, or how can you explain that the Razer is able to output more MTexels/s on a smaller resolution onscreen? You can't. Not sure how this isn't confusing!Whatever, synthetic benchmarks are meaningless, and they especially don't qualify to get tested on both on and off-screen and take more space in such an article than the 'real world demos'.
Just take a look at recent discrete AMD/NVidia GPU reviews? I see not a single synthetic benchmark 80% games, 20% Benchmark demos, but no synthetic one. There's a reason for this.