NVIDIA GeForce GTX 780 Review: The New High End
by Ryan Smith on May 23, 2013 9:00 AM EST
As the two year GPU cycle continues in earnest, we’ve reached the point where NVIDIA is gearing up for their annual desktop product line refresh. With the GeForce 600 series proper having launched over a year ago, all the way back in March of 2012, most GeForce 600 series products are at or are approaching a year old, putting us roughly halfway through Kepler’s expected 2 year lifecycle. With their business strongly rooted in annual upgrades, this means NVIDIA’s GPU lineup is due for a refresh.
How NVIDIA goes about their refreshes has differed throughout the years. Unlike the CPU industry (specifically Intel), the GPU industry doesn’t currently live on any kind of tick-tock progression method. New architectures are launched on new process nodes, which in turn ties everything to the launch of those new process nodes by TSMC. Last decade saw TSMC doing yearly half-node steps, allowing incremental fab-driven improvements every year. But with TSMC no longer doing half-node steps as of 40nm, this means fab-drive improvements now come only every two years.
In lieu of new process nodes and new architectures, NVIDIA has opted to refresh based on incremental improvements within their product lineups. With the Fermi generation, NVIDIA initially shipped most GeForce 400 Fermi GPUs with one or more disabled functional units. This helped to boost yields on a highly temperamental 40nm process, but it also left NVIDIA an obvious route of progression for the GeForce 500 series. With the GeForce 600 series on the other hand, 28nm is relatively well behaved and NVIDIA has launched fully-enabled products at almost every tier, leaving them without an obvious route of progression for the Kepler refresh.
So where does NVIDIA go from here? As it turns out NVIDIA’s solution for their annual refresh is essentially the same: add more functional units. NVIDIA of course doesn’t have more functional units to turn on within their existing GPUs, so instead they’re doing the next best thing, acquiring more functional units by climbing up the GPU ladder itself. And with this in mind, this brings us to today’s launch, the GeForce GTX 780.
The GeForce GTX 780 is the follow-up to last year’s GeForce GTX 680, and is a prime example of refreshing a product line by bringing in a larger, more powerful GPU that was previously relegated to a higher tier product. Whereas GTX 680 was based on a fully-enabled GK104 GPU, GTX 780 is based on a cut-down GK110 GPU, NVIDIA’s monster GPU first launched into the prosumer space with GTX Titan earlier this year. Going this route doesn’t offer much in the way of surprises since GK110 is a known quantity, but as we’ll see it allows NVIDIA to improve performance while slowly bringing down GPU prices.
| GTX Titan | GTX 780 | GTX 680 | GTX 580 | |
| Stream Processors | 2688 | 2304 | 1536 | 512 |
| Texture Units | 224 | 192 | 128 | 64 |
| ROPs | 48 | 48 | 32 | 48 |
| Core Clock | 837MHz | 863MHz | 1006MHz | 772MHz |
| Shader Clock | N/A | N/A | N/A | 1544MHz |
| Boost Clock | 876Mhz | 900Mhz | 1058MHz | N/A |
| Memory Clock | 6GHz GDDR5 | 6GHz GDDR5 | 6GHz GDDR5 | 4GHz GDDR5 |
| Memory Bus Width | 384-bit | 384-bit | 256-bit | 384-bit |
| VRAM | 6GB | 3GB | 2GB | 1.5GB |
| FP64 | 1/3 FP32 | 1/24 FP32 | 1/24 FP32 | 1/8 FP32 |
| TDP | 250W | 250W | 195W | 244W |
| Transistor Count | 7.1B | 7.1B | 3.5B | 3B |
| Manufacturing Process | TSMC 28nm | TSMC 28nm | TSMC 28nm | TSMC 40nm |
| Launch Price | $999 | $649 | $499 | $499 |
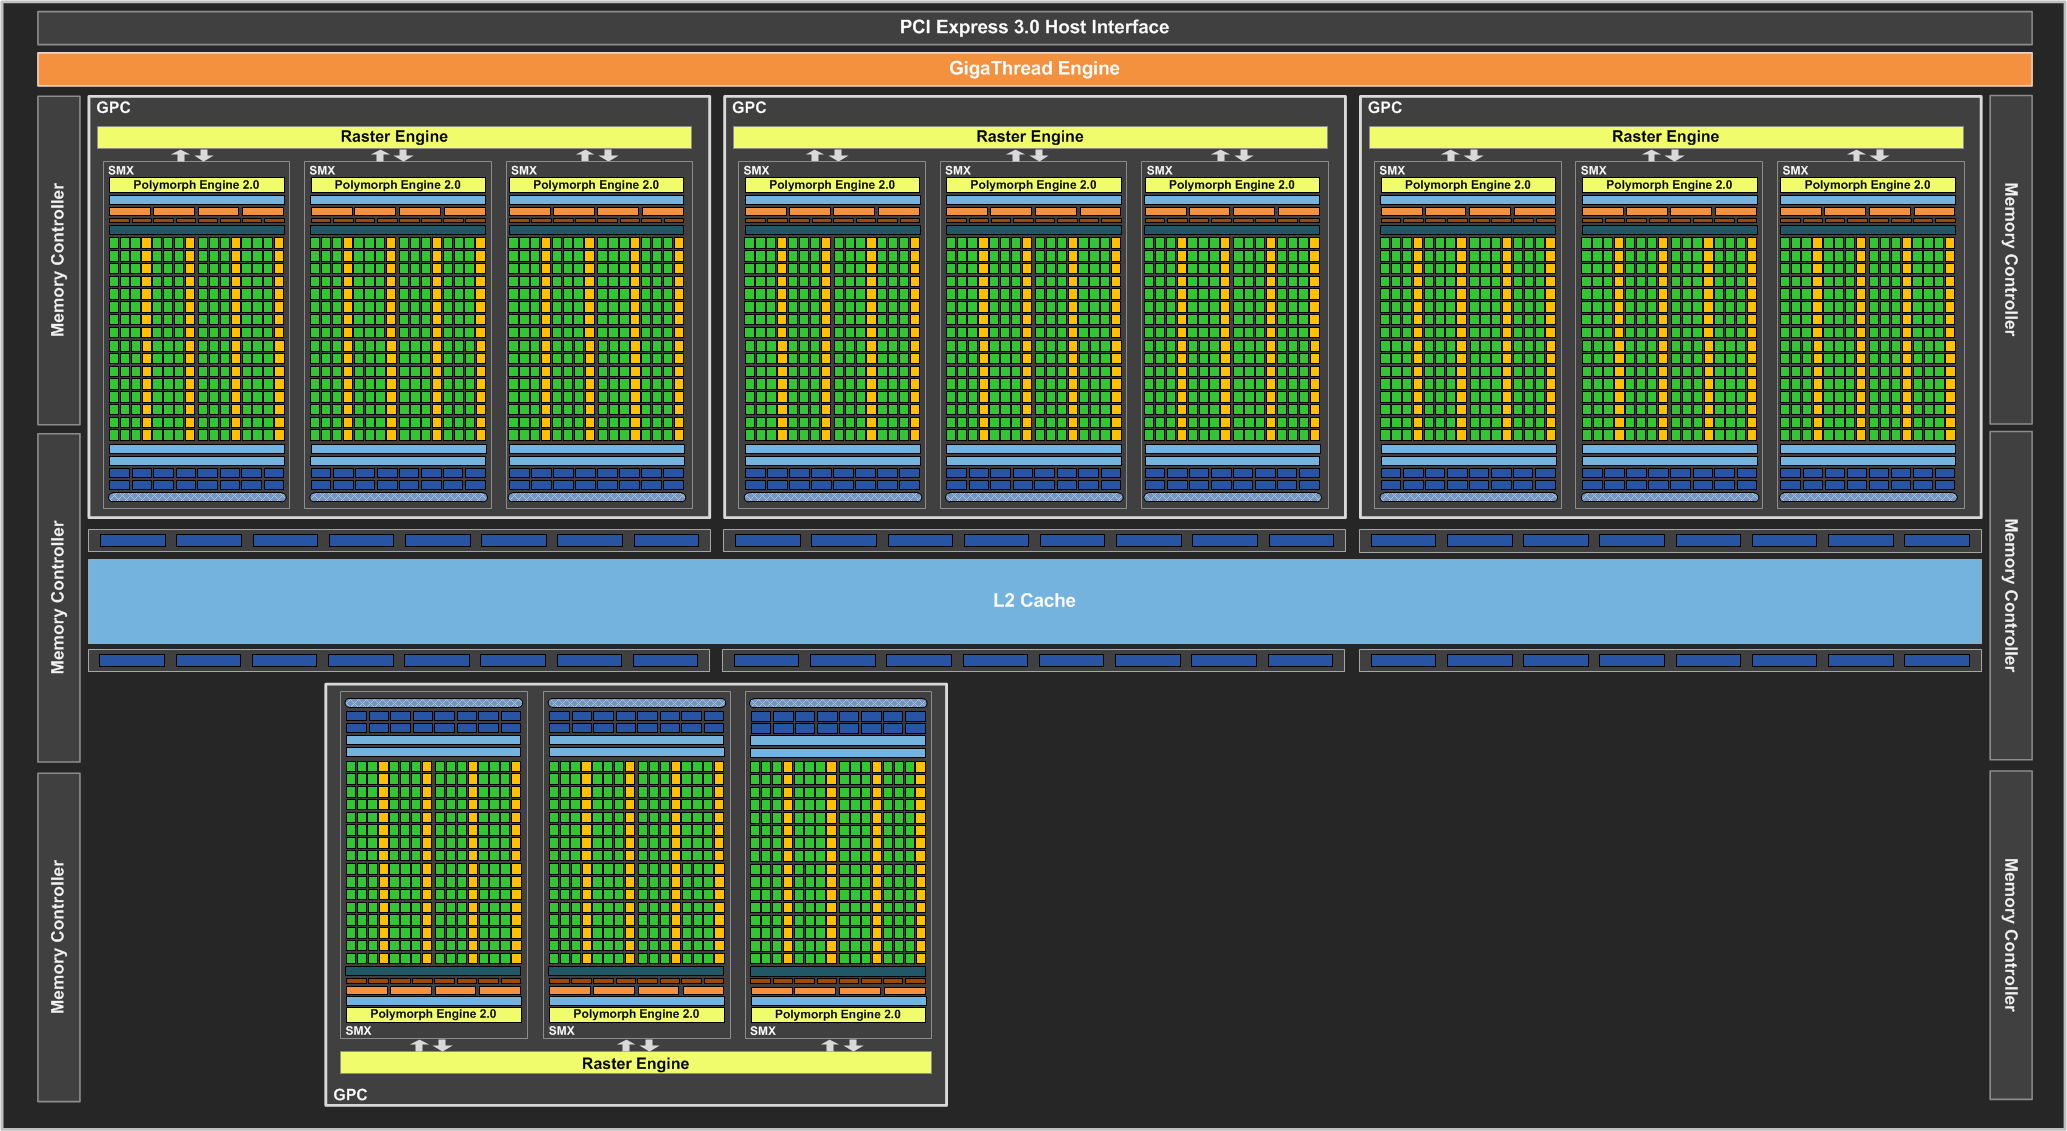
As the first of the desktop GeForce 700 lineup, GeForce GTX 780 is in almost every sense of the word a reduced price, reduced performance version of GTX Titan. This means that on the architectural side we’re looking at the same GK110 GPU, this time with fewer functional units. Titan’s 14 SMXes have been reduced to just 12 SMXes, reducing the shader count from 2688 to 2304, and the texture unit count from 224 to 192.
At the same time because NVIDIA has gone from disabling 1 SMX (Titan) to disabling 3 SMXes, GTX 780’s GPC count is now going to be variable thanks to the fact that GK110 packs 3 SMXes to a GPC. GTX 780 cards will either have 5 GPCs or 4 GPCs depending on whether the 3 disabled SMXes are all in the same GPC or not. This is nearly identical to what happened with the GTX 650 Ti, and as with the GTX 650 Ti it’s largely an intellectual curiosity since the difference in GPCs won’t notably impact performance. But it is something worth pointing out.
Moving on with our Titan comparison, much to our surprise NVIDIA has not touched the ROP/memory blocks at all (something they usually do), meaning GTX 780 comes with all 48 ROPs tied to a 384bit memory bus just as Titan does. Clockspeeds aside, this means that GTX 780 maintains Titan’s ROP/memory throughput rather than taking a performance hit, which bodes well for ROP and memory-bound scenarios. Note however that while the memory bus is the same width, NVIDIA has dropped Titan’s massive 6GB of RAM for a more conservative 3GB, giving GTX 780 the same memory bandwidth while giving it less RAM overall.
As for clockspeeds, clockspeeds have actually improved slightly, thanks to the fact that fewer SMXes need to be powered. Whereas GTX Titan had a base clockspeed of 837MHz, GTX 780 is 2 bins higher at 863MHz, with the boost clock having risen from 876MHz to 900MHz. Memory clocks meanwhile are still at 6GHz, the same as Titan, giving GTX 780 the full 288GB/sec of memory bandwidth to work from.
Taken in altogether, when it comes to theoretical performance GTX 780 should have 88% of Titan’s shading, texturing, and geometry performance, and 100% of Titan’s memory bandwidth. Meanwhile on the ROP side of matters, we actually have an interesting edge case where thanks to GTX 780’s slightly higher clockspeeds, its theoretical ROP performance exceeds Titan’s by about 3%. In practice this doesn’t occur – the loss of the SMXes is far more significant – but in ROP-bound scenarios GTX 780 should be able to stay close to Titan.
For better or worse, power consumption is also going to be very close between GTX 780 and Titan. Titan had a 250W TDP and so does GTX 780, so there won’t be much of a decrease in power consumption despite the decrease in performance. This is more atypical of NVIDIA since lower tier products usually have lower TDPs, but ultimately it comes down to leakage, binning, and the other factors that dictate how GPU tiers need to be structured so that NVIDIA can harvest as many GPUs as possible. On the other hand the fact that the TDP is still 250W (with the same +6% kicker) means that GTX 780 should have a bit more TDP headroom than Titan since GTX 780 has fewer SMXes and RAM chips to power.
On a final note from a feature/architecture standpoint there are a couple of differences between the GTX 780 and GTX Titan that buyers will want to be aware of. Even though Titan is being sold under the GeForce label, it was essentially NVIDIA’s first prosumer product, crossing over between gaming and compute. GTX 780 on the other hand is a pure gaming/consumer part like the rest of the GeForce lineup, meaning NVIDIA has stripped it of Titan’s marquee compute feature: uncapped double precision (FP64) performance. As a result GTX 780 can offer 90% of GTX Titan’s gaming performance, but it can only offer a fraction of GTX Titan’s FP64 compute performance, topping out at 1/24th FP32 performance rather than 1/3rd like Titan. Titan essentially remains as NVIDIA’s entry-level compute product, leaving GTX 780 to be a high-end gaming product.
Meanwhile, compared to the GTX 680 which it will be supplanting, the GTX 780 should be a big step up in virtually every way. As NVIDIA likes to put it, GTX 780 is 50% more of everything than GTX 680. 50% more SMXes, 50% more ROPs, 50% more RAM, and 50% more memory bandwidth. In reality due to the clockspeed differences the theoretical performance difference isn’t nearly as large – we’re looking at just a 29% increase in shading/texturing/ROP performance – but this still leaves GTX 780 as being much more powerful than its predecessor. The tradeoff of course being that with a 250W TDP versus GTX 680’s 195W TDP, GTX 780 also draws around 28% more power; without a process node improvement, performance improvements generally come about by moving along the power/performance curve.
Moving on to pricing and competitive positioning, it unfortunately won’t just be GTX 780’s performance that’s growing. As we’ve already seen clearly with the launch of GTX Titan, GK110 is in a class of its own as far as GPUs go; AMD simply doesn’t have a GPU big enough to compete on raw performance. Consequently NVIDIA is under no real pricing pressure and can price GTX 780 wherever they want. In this case GTX 780 isn’t just 50% more hardware than the GTX 680, but it’s about 50% more expensive too. NVIDIA will be pricing the GTX 780 at $650, $350 below the GTX Titan and GTX 690, and around $200-$250 more than the GTX 680. This has the benefit of bringing Titan-like performance down considerably, but as an x80 card it’s priced well above its predecessor, which launched back at the more traditional price point of $500. NVIDIA is no stranger to the $650 price point – they initially launched the GTX 280 there back in 2008 – but this is the first time in years they’ll be able to hold that position.


At $650, the GTX 780 is more of a gap filler than it is a competitor. Potential Titan buyers will want to pay close attention to the GTX 780 since it offers 90% of Titan’s gaming performance, but that’s about it for GTX 780’s competition. Above it the GTX 690 and Radeon HD 7990 offer much better gaming performance for much higher prices (AFR issues aside), and the next-closest card below GTX 780 will be the GTX 680 and Radeon HD 7970 GHz Edition, for which GTX 780 is 20%+ faster. As a cheaper Titan this is a solid price, but otherwise it’s still somewhat of a luxury card compared to the GTX 680 and its ilk.
Meanwhile as far as availability goes this will be a standard hard launch. And unlike GTX Titan and GTX 690 all of NVIDIA’s usual partners will be participating, so there will be cards from a number of companies available from day one, with semi-custom cards right around the corner.
Finally, looking at GTX 780 as an upgrade path, NVIDIA’s ultimate goal here isn’t to sell the card as an upgrade to existing GTX 680 owners, but rather as with past products the upgrade path is targeted at those buying video cards at 2+ year intervals. GTX 580 is 2.5 years old, while GTX 480 and GTX 280 are older still. A $650 won’t move GTX 680 owners, but with GTX 780 in some cases doubling GTX 580’s performance NVIDIA believe it may very well move Fermi owners, and they’re almost certainly right.
| May 2013 GPU Pricing Comparison | |||||
| AMD | Price | NVIDIA | |||
| AMD Radeon HD 7990 | $1000 | GeForce GTX Titan/GTX 690 | |||
| $650 | GeForce GTX 780 | ||||
| Radeon HD 7970 GHz Edition | $450 | GeForce GTX 680 | |||
| Radeon HD 7970 | $390 | ||||
| $350 | GeForce GTX 670 | ||||
| Radeon HD 7950 | $300 | ||||


155 Comments
View All Comments
littlebitstrouds - Thursday, May 23, 2013 - link
Being a system builder for video editors, I'd love to get some video rendering performance numbers.TheRealArdrid - Thursday, May 23, 2013 - link
The performance numbers on Far Cry 3 really show just how poorly Crysis was coded. There's no reason why new top-end hardware should still struggle on a 6 year old game.zella05 - Thursday, May 23, 2013 - link
Just no. crysis looks way better than farcry 3. dont forget, crysis is a pc game, farcry is a console portRyan Smith - Thursday, May 23, 2013 - link
On a side note, I like Far Cry 3, but I'd caution against using it as a baseline for a well forming game. It's an unusually fussy game. We have to disable HT to make it behave, and the frame pacing even on single GPU cards is more variable than what we see in most other games.zella05 - Thursday, May 23, 2013 - link
there has to be something wrong with your testing? how on earth can 2560x1440 only shave 1fps of all those cards? impossible. I have dual 580s on a dell 1440p monitor and I can say with complete conviction that when playing Crysis 3 you lose at LEAST 10% frame rate. Explain yourselves?WeaselITB - Thursday, May 23, 2013 - link
There are two 1080p graphs -- one "High Quality" and one "Very High Quality" ... the 1440p graph is "High Quality."Comparing HQ between the two gives 79.4 to 53.1 for the 780 ... seems about right to me.
-Weasel
BrightCandle - Thursday, May 23, 2013 - link
Both of your measures taken from FCAT have issues which I will try to explain below.1) The issue with the 95% point
If we take a game where 5% of the frames are being produced very inconsistently then the 95% point wont capture the issue. But worse is the fact that a 1 in 100 frame that takes twice as long is very noticeable when playing to everyone. Just 1% of the frames having an issue is enough to see a noticeable problem. Our eyes don't work by taking 95% of the frames, our eyes require a level of consistency on all frames. Thus the 95% point is not the eqvuialent of minimum FPS, that would be the 100% point. The 95% point is arbitary and ultimately not based on how we perceive the smoothness of frames. It captures AMDs current crossfire issue but it fails to have the resolution necessary as a metric to capture the general problem and compare single cards.
2) The issue with the delta averaging
By comparing to the average frame time this method would incorrectly categorise clearly better performing cards. Its the same mistake Tomshardware made. In essence if you have a game and sometimes that game is CPU limited (common) and then GPU limited the two graphics cards will show similar frame rates at some moments and the faster of them will show dramatically higher performance at other times. This makes the swing from the minimum/average to the high fps much wider. But it could be a perfectly consistent experience in the sense that frame to frame for the most part the variation is minimal. Your calculation would tell us the variation of the faster card was a problem, when actually it wasn't.
The reason that measure isn't right is that it fails to recognise the thing we humans see as a problem. We have issue with individual frames that take a long time. We also have issues with inconsistent delivery of animation in patterns. If we take 45 fps for example the 16/32/16/32 pattern that can produce in vsync is highly noticeable. The issue is that frame to frame we are seeing variation. This is why all the other review sites show the frame times, because the stuttering on a frame by frame basis really matters.
We don't particularly have issues with a single momentary jump up or down in frame rate, we might notice them but its momentary and then we adapt rapidly. What our brains do not adapt to rapidly is continuous patterns of odd delivery of frames. Thus any measure where you try to reduce the amount of data needs to be based on that moment by moment variation between individual or small numbers of frames, because big jumps up and down in fps that last for 10s of seconds are not a problem, the issue is the 10ms swing between two individual frames that keeps happening. You could look for patterns, you could use signal frequency analysis and various other techniques to tune out the "carrier" signal of the underlying FPS. But what you can't do is compare it to the average, that just blurs the entire picture. A game that started at 30 fps for half the trace and then was 60 fps for half the trace with no other variation is vastly better than one that continuously oscillates between 30 and 60 fps every other frame.
Its also important to understand that you analysis is missing fraps. Fraps isn't necessarily good for measuring what the cards are doing but it is essentially the best current way to measure what the game engine is doing. The GPU is impacting on the game simulation and its timing and variation in this affects what goes into the frames. So while FCAT captures if the frames come out smoothly it does not tell us anything about whether the contents is at the right time, fraps is what does that. NVidia is downplaying that tool because they have FCAT and are trying to show off their frame metering and AMD is downplaying it because their cards have issues but it is still a crucial measure. The ideal picture is both that the fraps times are consistent and the FCAT measures are consistent, they after all measure the input into the GPU and the output and we need both to get a true picture of the sub component.
Thus I am of the opinion your data doesn't currently show what you thought it did and your analysis needs work.
rscsrAT - Thursday, May 23, 2013 - link
As far as I understood the delta averaging, it adds the time difference between two adjacent frames.To make it clear, if you have 6 frames with 16/32/16/32/16/32ms per frame, you would calculate the value with (5*16)/((3*16+3*32)/6)=333%.
But if you have 6 framse with 16/16/16/32/32/32ms per frame, you would have 16/((3*16+3*32)/6)=67%.
Therefore you still have a higher value for a higher fluctuating framerate than with a steady framerate.
WeaselITB - Thursday, May 23, 2013 - link
For your #1 -- 95th percentile is a pretty common statistical analysis tool http://en.wikipedia.org/wiki/68-95-99.7_rule ... I'm assuming that they're assuming a normal distribution, which intuitively makes sense given that you'd expect most results to be close to the mean. I'd be interested in seeing the 3-sigma values, as that would further point out the extreme outliers, and would probably satisfy your desire for the "1%" as well.For your #2 -- they're measuring what you're describing, the differences between individual frametimes. Compare their graphs on the "Our First FCAT" page between the line graph of the frametimes of the cards and the bar graph after they massaged the data. The 7970GE has the smallest delta percentage, and the tightest line graph. The 7990 has the largest delta percentage (by far), and the line graph is all over the place. Their methodology of coming up with the "delta percentage" difference is sound.
-Weasel
jonjonjonj - Thursday, May 23, 2013 - link
amd get your act together so we have some competition. i really don't even see the point to this card at this price. what are they going to do for the 770? sell and even more crippled GK110 for $550? and the 760ti will be $450? or are they just going to sell the the 680 as a 770?