Battle of the 4 TB NAS Drives: WD Red and Seagate NAS HDD Face-Off
by Ganesh T S on September 4, 2013 6:00 AM EST- Posted in
- NAS
- Seagate
- HDDs
- Western Digital
- Enterprise
Introduction
The SMB / SOHO / consumer NAS market is expected to experience good growth over the next few years. With declining PC sales and increase in affordability of SSDs, hard drive vendors have scrambled to make up for the deficit and increase revenue by targeting the NAS market. Hard drive models specifically catering to 1-5 bay consumer NAS units have been introduced by both Western Digital and Seagate. Seagate took the lead in the capacity segment with the launch of the 4 TB NAS HDD in June 2013. Western Digital achieved parity with the launch of the second generation WD Red models yesterday.
The higher end SATA DAS/NAS storage segments have been served by 4 TB models for quite some time now. The WD Re (targeting applications where durability under heavy workloads is important) has been available in a 4 TB version since September 2012, while the WD Se (targeting applications where scalability and capacity are important) was introduced in May 2013.
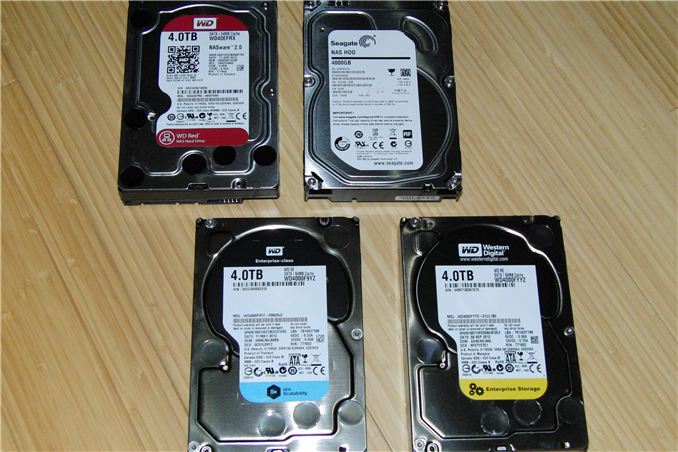
The correct choice of hard drives for a NAS system is influenced by a number of factors. These include expected workloads, performance requirements and power consumption restrictions, amongst others. In this review, we will discuss some of these aspects while evaluating four different hard drives targeting the NAS market:
- Western Digital Red 4 TB [ WDC WD40EFRX-68WT0N0 ]
- Seagate 4 TB NAS HDD [ ST4000VN000-1H4168 ]
- Western Digital Se 4 TB [ WDC WD4000F9YZ-09N20L0 ]
- Western Digital Re 4 TB [ WDC WD4000FYYZ-01UL1B0 ]
While the WD Red and Seagate NAS HDD compete against each other in the same market segment (consumer / SOHO NAS units with 1-5 bays), the WD Re and WD Se are portrayed as complementary offerings for higher end NAS units. We will also try to determine how they differ in the course of this article.
Western Digital provided us with at least two drives each of the WD Red, WD Se and WD Re, but, Seagate came forward with only one disk. Readers of our initial WD Red 3 TB review would have found us evaluating the disks in multiple NAS units with multiple RAID configurations. Unfortunately, Seagate's sampling forced us to rethink our review strategy for these NAS drives. We will start off with a feature set comparison of the four drives followed by a look at the raw performance when connected directly to a SATA 6 Gbps port. A 2-bay Intel Atom-based NAS (LenovoEMC PX2-300D) with single-bay occupancy is then used to evaluate performance in a networked environment. Power consumption numbers and other factors are addressed in the final section with the networked configuration as a point of reference.
We used two testbeds in our evaluation, one for benchmarking the raw drive performance and the other for evaluating performance when placed in a NAS unit.
| SATA Drive Benchmarking Testbed Setup | |
| Processor | Intel i7-3770K CPU - 4C/8T - 3.50GHz, 8MB Cache |
| Motherboard | Asus P8H77-M Pro |
| OS Hard Drive | Seagate Barracuda XT 2 TB |
| Secondary Drives | Corsair Performance 3 Series™ P3-128 128 GB SSD |
| WD40EFRX / ST4000VN000 / WD4000F9YZ / WD4000FYYZ | |
| Memory | G.SKILL ECO Series 4GB (2 x 2GB) SDRAM DDR3 1333 (PC3 10666) F3-10666CL7D-4GBECO CAS 7-7-7-21 |
| Case | Antec VERIS Fusion Remote Max |
| Power Supply | Antec TruePower New TP-550 550W |
| Operating System | Windows 7 Ultimate x64 |
Our NAS testbed was built for evaluating NAS units when subject to access from multiple clients (virtual machines). We ran the benchmarks presented in this review on one of the twenty five available Windows 7 VMs.
| AnandTech NAS Testbed Configuration | |
| Motherboard | Asus Z9PE-D8 WS Dual LGA2011 SSI-EEB |
| CPU | 2 x Intel Xeon E5-2630L |
| Coolers | 2 x Dynatron R17 |
| Memory | G.Skill RipjawsZ F3-12800CL10Q2-64GBZL (8x8GB) CAS 10-10-10-30 |
| OS Drive | OCZ Technology Vertex 4 128GB |
| Secondary Drive | OCZ Technology Vertex 4 128GB |
| Tertiary Drive | OCZ RevoDrive Hybrid (1TB HDD + 100GB NAND) |
| Other Drives | 12 x OCZ Technology Vertex 4 64GB (Offline in the Host OS) |
| Network Cards | 6 x Intel ESA I-340 Quad-GbE Port Network Adapter |
| Chassis | SilverStoneTek Raven RV03 |
| PSU | SilverStoneTek Strider Plus Gold Evolution 850W |
| OS | Windows Server 2008 R2 |
| Network Switch | Netgear ProSafe GSM7352S-200 |
The hard drives under the scanner were placed in a single-drive configuration in the Intel Atom D525-based LenovoEMC PX2-300D. The network links of the PX2-300D were bonded in LACP 802.3ad mode, but that shouldn't have any bearing on the results since we are looking at a single client scenario with a single GbE link.


54 Comments
View All Comments
joelypolly - Wednesday, September 4, 2013 - link
With a difference of 1 to 2 watts for the Seagate I fail to see how that would be too much of a cause for concern for cooling systems? Even with a 5 disk array it should still be under 10 watts difference in the most demanding circumstances and about 5 watts on average.owan - Wednesday, September 4, 2013 - link
I was thinking about that. 1W difference has got to be negligible for any desktop based system. Even 3-4W differences, while large on the relative scale, are small in the absolute sense. I don't see how you could make the statement "if you want more performance, Seagate, if you need cool and quiet, WD" Is there no other reason to pick one drive over the other besides a 1W performance consumption difference?glugglug - Wednesday, September 4, 2013 - link
It is hard to see the relative differences quickly switching between the performance graphs for the different drives because some of them are on different scales for each drive. Is there any way the graph scales can be made uniform?ganeshts - Wednesday, September 4, 2013 - link
Can you let me know the specific graphs you are seeing the problem in? The numbers are also reported by HD Tune Pro on the side..glugglug - Wednesday, September 4, 2013 - link
The random read and random write graphs.I can see the scale on the side, but for example the random read graph has the max Y scale value at 50ms for the WD SE drive, 100ms for the Red drive and WD RE and 200 ms for the Seagate. At first glance, it looks like the Seagate is owning because of the scale -- it requires extra thought to figure out what the graph would look like on the same scale for comparison.
ganeshts - Wednesday, September 4, 2013 - link
Got it. From what I remember, HD Tune Pro doesn't give user control over graph scales. But, I will see what can be done for future articles.ZRohlfs - Wednesday, September 4, 2013 - link
If you look closely at those graphs you can see some outliers that are very high on the graph. They are away from the statistical clump but they cause the graph to have the scales that they do.carlwu - Wednesday, September 4, 2013 - link
Can anyone comment on Seagate reliability as of late? Their 1TB drive fiasco left a bad taste my mouth.dawza - Wednesday, September 4, 2013 - link
The Seagate NAS HDDs seem quite good in terms of reliability thus far. I have a 3 TB and 4 TB in my WHS (JBOD) and they've made it past the crucial 1 month mark without issues. But as mentioned in the review, these haven't been on the market very long.These are the first Seagates I've purchased in years due to past issues you alluded to.
RealBeast - Thursday, September 5, 2013 - link
Carlwu, I had that thought also but set up one NAS with 8 x 3TB Seagate 7200rpm (the ST3000DM001) in RAID 6 and have had no issues for the six months they have run 24/7. Fingers crossed.