OCZ's Vertex 2 Pro Preview: The Fastest MLC SSD We've Ever Tested
by Anand Lal Shimpi on December 31, 2009 12:00 AM EST- Posted in
- Storage
AnandTech Storage Bench
I introduced our storage suite in our last SSD article and it’s back, now with more data :)
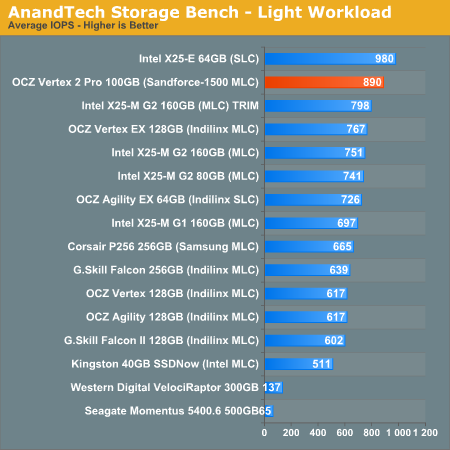
Of the MLC SSDs represented here, there’s just nothing faster than the SandForce based OCZ Vertex 2 Pro.
Intel’s SLC based X25-E actually does very well, especially for a controller that’s as old as it is. It is worth noting however that the only thing separating Intel from SandForce-level performance is the X25-M’s low sequential write speed...
The first in our benchmark suite is a light usage case. The Windows 7 system is loaded with Firefox, Office 2007 and Adobe Reader among other applications. With Firefox we browse web pages like Facebook, AnandTech, Digg and other sites. Outlook is also running and we use it to check emails, create and send a message with a PDF attachment. Adobe Reader is used to view some PDFs. Excel 2007 is used to create a spreadsheet, graphs and save the document. The same goes for Word 2007. We open and step through a presentation in PowerPoint 2007 received as an email attachment before saving it to the desktop. Finally we watch a bit of a Firefly episode in Windows Media Player 11.
There’s some level of multitasking going on here but it’s not unreasonable by any means. Generally the application tasks proceed linearly, with the exception of things like web browsing which may happen in between one of the other tasks.
The recording is played back on all of our drives here today. Remember that we’re isolating disk performance, all we’re doing is playing back every single disk access that happened in that ~5 minute period of usage. The light workload is composed of 37,501 reads and 20,268 writes. Over 30% of the IOs are 4KB, 11% are 16KB, 22% are 32KB and approximately 13% are 64KB in size. Less than 30% of the operations are absolutely sequential in nature. Average queue depth is 6.09 IOs.
The performance results are reported in average I/O Operations per Second (IOPS):
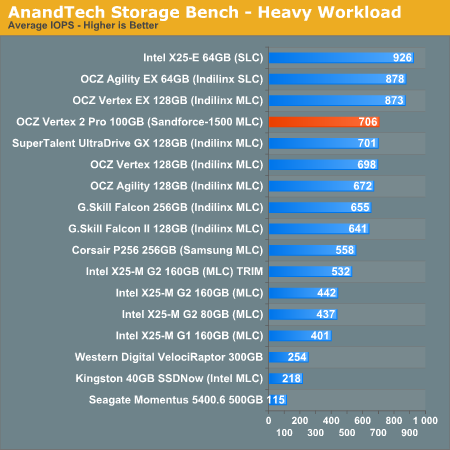
If there’s a light usage case there’s bound to be a heavy one. In this test we have Microsoft Security Essentials running in the background with real time virus scanning enabled. We also perform a quick scan in the middle of the test. Firefox, Outlook, Excel, Word and Powerpoint are all used the same as they were in the light test. We add Photoshop CS4 to the mix, opening a bunch of 12MP images, editing them, then saving them as highly compressed JPGs for web publishing. Windows 7’s picture viewer is used to view a bunch of pictures on the hard drive. We use 7-zip to create and extract .7z archives. Downloading is also prominently featured in our heavy test; we download large files from the Internet during portions of the benchmark, as well as use uTorrent to grab a couple of torrents. Some of the applications in use are installed during the benchmark, Windows updates are also installed. Towards the end of the test we launch World of Warcraft, play for a few minutes, then delete the folder. This test also takes into account all of the disk accesses that happen while the OS is booting.
The benchmark is 22 minutes long and it consists of 128,895 read operations and 72,411 write operations. Roughly 44% of all IOs were sequential. Approximately 30% of all accesses were 4KB in size, 12% were 16KB in size, 14% were 32KB and 20% were 64KB. Average queue depth was 3.59.
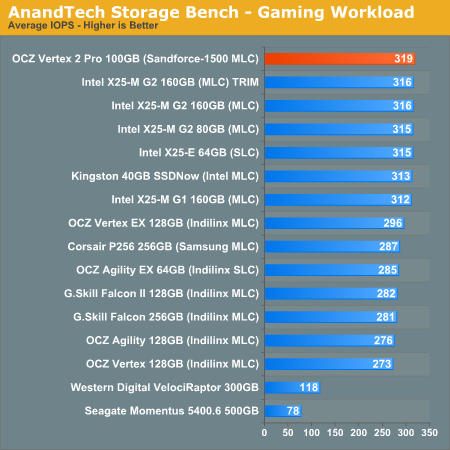
Our final test focuses on actual gameplay in four 3D games: World of Warcraft, Batman: Arkham Asylum, FarCry 2 and Risen, in that order. The games are launched and played, altogether for a total of just under 30 minutes. The benchmark measures game load time, level load time, disk accesses from save games and normal data streaming during gameplay.
The gaming workload is made up of 75,206 read operations and only 4,592 write operations. Only 20% of the accesses are 4KB in size, nearly 40% are 64KB and 20% are 32KB. A whopping 69% of the IOs are sequential, meaning this is predominantly a sequential read benchmark. The average queue depth is 7.76 IOs.


100 Comments
View All Comments
Shark321 - Monday, January 25, 2010 - link
Kingston has released a new SSD series (V+) with the Samsung controller. I hope Anandtech will review it soon. Other sites are not reliable, as they test only sequential read/writes.Bobchang - Wednesday, January 20, 2010 - link
Great Article!it's awesome to have new feature SSD and I like the performance
but, regarding your test, I don't get the same random read performance from IOMeter.
Can you let me know what version of IOMeter and configuration you used for the result? I never get more than around 6000 IOPS.
AnnonymousCoward - Wednesday, January 13, 2010 - link
Anand,Your SSD benchmarking strategy has a big problem: there are zero real-world-applicable comparison data. IOPS and PCMark are stupid. For video cards do you look at IOPS or FLOPS, or do you look at what matters in the real world: framerate?
As I said in my post here (http://tinyurl.com/yljqxjg)">http://tinyurl.com/yljqxjg), you need to simply measure time. I think this list is an excellent starting point, for what to measure to compare hard drives:
1. Boot time
2. Time to launch applications
_a) Firefox
_b) Google Earth
_c) Photoshop
3. Time to open huge files
_a) .doc
_b) .xls
_c) .pdf
_d) .psd
4. Game framerates
_a) minimum
_b) average
5. Time to copy files to & from the drive
_a) 3000 200kB files
_b) 200 4MB files
_c) 1 2GB file
6. Other application-specific tasks
What your current strategy lacks is the element of "significance"; is the performance difference between drives significant or insignificant? Does the SandForce cost twice as much as the others and launch applications just 0.2s faster? Let's say I currently don't own an SSD: I would sure like to know that an HDD takes 15s at some task, whereas the Vertex takes 7.1s, the Intel takes 7.0s, and the SF takes 6.9! Then my purchase decision would be entirely based on price! The current benchmarks leave me in the dark regarding this.
rifleman2 - Thursday, January 14, 2010 - link
I think the point made is a good one for an additional data point for the decision buying process. Keep all the great benchmarking data in the article and just add a couple of time measurements so, people can get a feel for how the benchmark numbers translate to time waiting in the real world which is what everyone really wants to know at the end of the day.Also, Anand did you fill the drive to its full capacity with already compressed data and if not, then what happens to performance and reliability when the drive is filled up with already compressed data. From your report it doesn't appear to have enough spare flash capacity to handle a worse case 1:1 ratio and still get decent performance or a endurance lifetime that is acceptable.
AnnonymousCoward - Friday, January 15, 2010 - link
Real world top-level data should be the primary focus and not just "an additional data point".This old article could not be a better example:
http://tinyurl.com/yamfwmg">http://tinyurl.com/yamfwmg
In IOPS, RAID0 was 20-38% faster! Then the loading *time* comparison had RAID0 giving equal and slightly worse performance! Anand concluded, "Bottom line: RAID-0 arrays will win you just about any benchmark, but they'll deliver virtually nothing more than that for real world desktop performance."
AnnonymousCoward - Friday, January 15, 2010 - link
Icing on the cake is this latest Vertex 2 drive, where IOPS don't equal bandwidth.It doesn't make sense to not measure time. Otherwise what you get is inaccurate results to real usage, and no grasp of how significant differences are.
jabberwolf - Friday, August 27, 2010 - link
The better way to test rather then hopping on your mac and thinking thats the end-all be-all of the world is to throw this drive into a server, vmware or xenserver... and create multiple VD sessions.1- see how many you can boot up at the same time and run heavy loads.
The boot ups will take the most IOPS.
Sorry but IOPS do matter so very much in the business world.
For stand alone drives, your read writes will be what your are looking for.
Wwhat - Wednesday, January 6, 2010 - link
This is all great, finally a company that realizes the current SSD's are too cheap and have too much capacity and that people have too much money.Oh wait..
Wwhat - Wednesday, January 6, 2010 - link
Double post was caused by anadtech saying something had gone wrong, prompting me to retry.Wwhat - Wednesday, January 6, 2010 - link
This is all great, finally a company that realizes the current SSD's are too cheap and have too much capacity and that people have too much money.Oh wait..