OWC Mercury Extreme Pro 6G SSD Review (120GB)
by Anand Lal Shimpi on May 5, 2011 1:45 AM ESTAnandTech Storage Bench 2011
I didn't expect to have to debut this so soon, but I've been working on updated benchmarks for 2011. Last year we introduced our AnandTech Storage Bench, a suite of benchmarks that took traces of real OS/application usage and played them back in a repeatable manner. I assembled the traces myself out of frustration with the majority of what we have today in terms of SSD benchmarks.
Although the AnandTech Storage Bench tests did a good job of characterizing SSD performance, they weren't stressful enough. All of the tests performed less than 10GB of reads/writes and typically involved only 4GB of writes specifically. That's not even enough exceed the spare area on most SSDs. Most canned SSD benchmarks don't even come close to writing a single gigabyte of data, but that doesn't mean that simply writing 4GB is acceptable.
Originally I kept the benchmarks short enough that they wouldn't be a burden to run (~30 minutes) but long enough that they were representative of what a power user might do with their system.
Not too long ago I tweeted that I had created what I referred to as the Mother of All SSD Benchmarks (MOASB). Rather than only writing 4GB of data to the drive, this benchmark writes 106.32GB. It's the load you'd put on a drive after nearly two weeks of constant usage. And it takes a *long* time to run.
I'll be sharing the full details of the benchmark in some upcoming SSD articles but here are some details:
1) The MOASB, officially called AnandTech Storage Bench 2011 - Heavy Workload, mainly focuses on the times when your I/O activity is the highest. There is a lot of downloading and application installing that happens during the course of this test. My thinking was that it's during application installs, file copies, downloading and multitasking with all of this that you can really notice performance differences between drives.
2) I tried to cover as many bases as possible with the software I incorporated into this test. There's a lot of photo editing in Photoshop, HTML editing in Dreamweaver, web browsing, game playing/level loading (Starcraft II & WoW are both a part of the test) as well as general use stuff (application installing, virus scanning). I included a large amount of email downloading, document creation and editing as well. To top it all off I even use Visual Studio 2008 to build Chromium during the test.
Update: As promised, some more details about our Heavy Workload for 2011.
The test has 2,168,893 read operations and 1,783,447 write operations. The IO breakdown is as follows:
| AnandTech Storage Bench 2011 - Heavy Workload IO Breakdown | ||||
| IO Size | % of Total | |||
| 4KB | 28% | |||
| 16KB | 10% | |||
| 32KB | 10% | |||
| 64KB | 4% | |||
Only 42% of all operations are sequential, the rest range from pseudo to fully random (with most falling in the pseudo-random category). Average queue depth is 4.625 IOs, with 59% of operations taking place in an IO queue of 1.
Many of you have asked for a better way to really characterize performance. Simply looking at IOPS doesn't really say much. As a result I'm going to be presenting Storage Bench 2011 data in a slightly different way. We'll have performance represented as Average MB/s, with higher numbers being better. At the same time I'll be reporting how long the SSD was busy while running this test. These disk busy graphs will show you exactly how much time was shaved off by using a faster drive vs. a slower one during the course of this test. Finally, I will also break out performance into reads, writes and combined. The reason I do this is to help balance out the fact that this test is unusually write intensive, which can often hide the benefits of a drive with good read performance.
There's also a new light workload for 2011. This is a far more reasonable, typical every day use case benchmark. Lots of web browsing, photo editing (but with a greater focus on photo consumption), video playback as well as some application installs and gaming. This test isn't nearly as write intensive as the MOASB but it's still multiple times more write intensive than what we were running last year.
As always I don't believe that these two benchmarks alone are enough to characterize the performance of a drive, but hopefully along with the rest of our tests they will help provide a better idea.
The testbed for Storage Bench 2011 has changed as well. We're now using a Sandy Bridge platform with full 6Gbps support for these tests. All of the older tests are still run on our X58 platform.
AnandTech Storage Bench 2011 - Heavy Workload
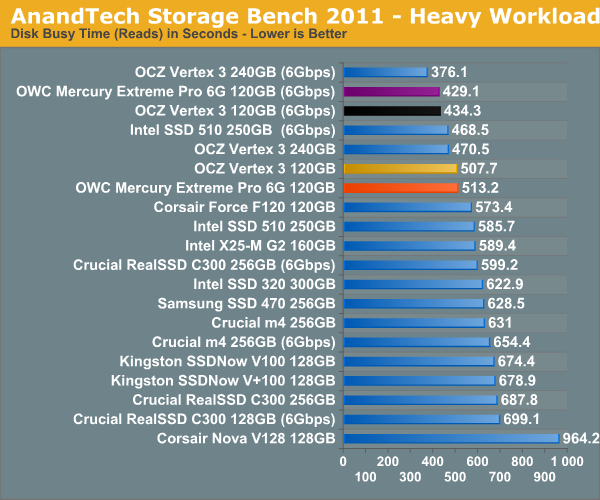
We'll start out by looking at average data rate throughout our new heavy workload test:
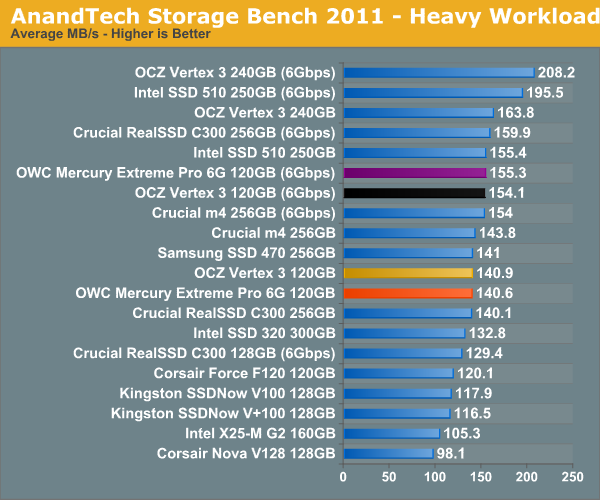
Overall performance is identical to the 120GB Vertex 3, but still behind the 240GB version due to the use of single-die NAND devices. At 240GB the choice is clear, but at 120GB I'm still waiting to get my hands on a few more drives before determining the best buy at that price point.
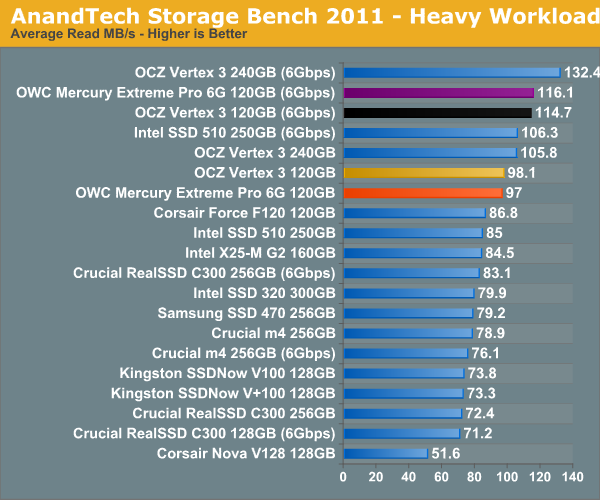
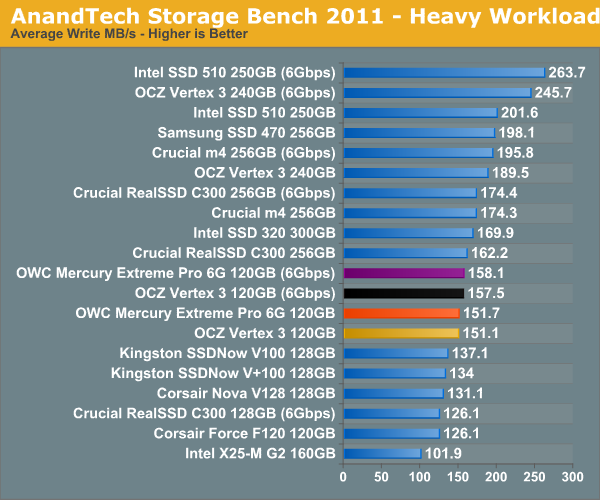
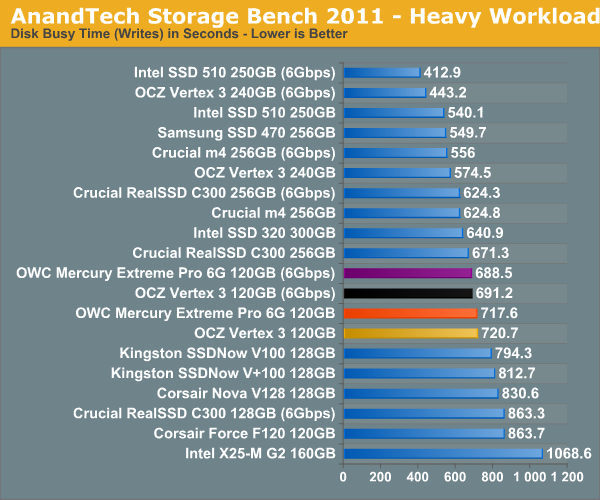
The breakdown of reads vs. writes tells us more of what's going on:
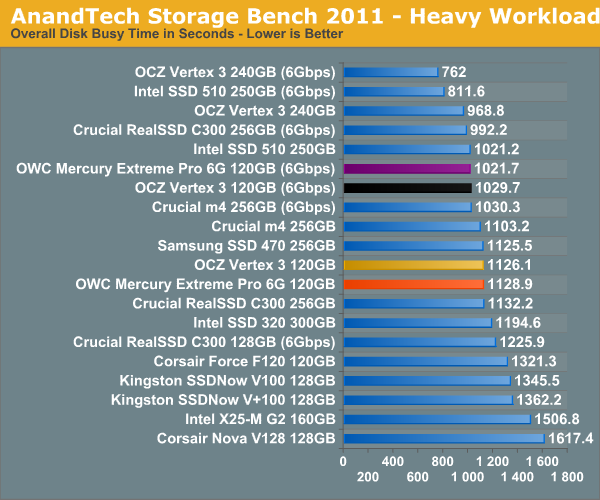
The next three charts just represent the same data, but in a different manner. Instead of looking at average data rate, we're looking at how long the disk was busy for during this entire test. Note that disk busy time excludes any and all idles, this is just how long the SSD was busy doing something:


44 Comments
View All Comments
Concillian - Thursday, May 5, 2011 - link
This is why I won't buy a SandForce SSD. Yeah, I can get a brand that doesn't have a cap. Or I can go with a different SSD that doesn't force me to jump through hoops to make sure I'm the same hardware from the right vendor.
The same hardware from different vendors should not have vastly different performance. How many people would put up with a memory bandwidth limit on P67 chipset motherboards from Gigabyte, but not ASUS? (or whatever brands.) No memory bandwidth doesn't have a huge impact on overall PC performance, but I think it would still be a big deal if something like that actually happened.
The SF-2281 either needs all vendors capped or none. It's a really shady tactic to offer two versions of the same hardware IMO.
semo - Thursday, May 5, 2011 - link
Nobody in the know likes the SF games but the whole thing is so complicated that most people won't understand it. Suits OCZ as the recent bad publicity doesn't seem to have affected them and everyone thinks they are the best choice for SSDs.Where are the Corsair force GT drives? Also, why are there no reviews of the Samsung 470?
Mr Perfect - Thursday, May 5, 2011 - link
I agree. If you want to offer vendors special products, fine, but give them a different model number. Call a controller capable of 27k a 2280 and the 52k version the 2281. You can still have incentive products, but the consumer doesn't get duped. Everyone's happy.Flunk - Thursday, May 5, 2011 - link
Almost all IC vendors do this. Intel is probably the worst by far. Selling essentially the same chip up to 50 different ways but lasering off parts of it. Almost all onboard sound chips, network chips, drive controllers, GPUs and anything else you can think of uses the same strategy.Chloiber - Thursday, May 5, 2011 - link
So the huge IOPS are pretty much useless, if the QD needs to be high - which is the case with every SSD.Anand, how is the "burst" rate of the Mercury regarding Random Write IOPS? I remember that with SF 12xx, the burst rate was exactly the same (for some seconds), only after 5-20s you could see a difference between the "unlocked" Vertex 2 and the rest. Considering how often one needs the random write performance for several seconds or even minutes (= never) I still think those huge IOPS numbers and the "unlocked firmware" stuff are just a huge marketing stunt. The benefit for the "normal" home user is = zero.
semo - Thursday, May 5, 2011 - link
Why is a high IOPS figure useless? Just because average Joe facebook doesn't do continuous IO intensive operations doesn't mean we don't need fast SSDs. You can apply your "logic" to CPU, GPU and pretty much any other technological advancement.kmmatney - Thursday, May 5, 2011 - link
For the normal home user, the Anand light workload test is really the best thing to look at - no need to look at any other metric. The drive does really well here.Robear - Thursday, May 5, 2011 - link
I believe most people who are interested in the power consumption are most interested in how it performs in a notebook. 2W versus 7W in power is negligible on a desktop. Instead of using a Velociraptor, can you please compare the SSD to a notebook hard drive, like maybe a Seagate Momentus?krazyderek - Thursday, May 5, 2011 - link
the momentus XT is included, the XT was a little more power hungry then typical notebook drives, have a look at the past review for more info to comparehttp://www.anandtech.com/show/3734/seagates-moment...
looks like some the new round of SSD's forgo power savings to move up the performance latter (ie: 240gb OCZ V3)
mschira - Thursday, May 5, 2011 - link
I was wondering if one could fit this drive into a 7mm slimline slot such as the Lenovo T420s.Lenovo only offers an Intel 160gb drive but I would fancy the possibility to insert a speedier 240gb SSD. maybe when removing some of the casing?
cheers
M.