SanDisk Extreme II Review (480GB, 240GB, 120GB)
by Anand Lal Shimpi on June 3, 2013 7:19 PM ESTAnandTech Storage Bench 2013
When I built the AnandTech Heavy and Light Storage Bench suites in 2011 I did so because we didn't have any good tools at the time that would begin to stress a drive's garbage collection routines. Once all blocks have a sufficient number of used pages, all further writes will inevitably trigger some sort of garbage collection/block recycling algorithm. Our Heavy 2011 test in particular was designed to do just this. By hitting the test SSD with a large enough and write intensive enough workload, we could ensure that some amount of GC would happen.
There were a couple of issues with our 2011 tests that I've been wanting to rectify however. First off, all of our 2011 tests were built using Windows 7 x64 pre-SP1, which meant there were potentially some 4K alignment issues that wouldn't exist had we built the trace on a system with SP1. This didn't really impact most SSDs but it proved to be a problem with some hard drives. Secondly, and more recently, I've shifted focus from simply triggering GC routines to really looking at worst case scenario performance after prolonged random IO. For years I'd felt the negative impacts of inconsistent IO performance with all SSDs, but until the S3700 showed up I didn't think to actually measure and visualize IO consistency. The problem with our IO consistency tests are they are very focused on 4KB random writes at high queue depths and full LBA spans, not exactly a real world client usage model. The aspects of SSD architecture that those tests stress however are very important, and none of our existing tests were doing a good job of quantifying that.
I needed an updated heavy test, one that dealt with an even larger set of data and one that somehow incorporated IO consistency into its metrics. I think I have that test. The new benchmark doesn't even have a name, I've just been calling it The Destroyer (although AnandTech Storage Bench 2013 is likely a better fit for PR reasons).
Everything about this new test is bigger and better. The test platform moves to Windows 8 Pro x64. The workload is far more realistic. Just as before, this is an application trace based test - I record all IO requests made to a test system, then play them back on the drive I'm measuring and run statistical analysis on the drive's responses.
Imitating most modern benchmarks I crafted the Destroyer out of a series of scenarios. For this benchmark I focused heavily on Photo editing, Gaming, Virtualization, General Productivity, Video Playback and Application Development. Rough descriptions of the various scenarios are in the table below:
| AnandTech Storage Bench 2013 Preview - The Destroyer | ||||||||||||
| Workload | Description | Applications Used | ||||||||||
| Photo Sync/Editing | Import images, edit, export | Adobe Photoshop CS6, Adobe Lightroom 4, Dropbox | ||||||||||
| Gaming | Download/install games, play games | Steam, Deus Ex, Skyrim, Starcraft 2, BioShock Infinite | ||||||||||
| Virtualization | Run/manage VM, use general apps inside VM | VirtualBox | ||||||||||
| General Productivity | Browse the web, manage local email, copy files, encrypt/decrypt files, backup system, download content, virus/malware scan | Chrome, IE10, Outlook, Windows 8, AxCrypt, uTorrent, AdAware | ||||||||||
| Video Playback | Copy and watch movies | Windows 8 | ||||||||||
| Application Development | Compile projects, check out code, download code samples | Visual Studio 2012 | ||||||||||
While some tasks remained independent, many were stitched together (e.g. system backups would take place while other scenarios were taking place). The overall stats give some justification to what I've been calling this test internally:
| AnandTech Storage Bench 2013 Preview - The Destroyer, Specs | |||||||||||||
| The Destroyer (2013) | Heavy 2011 | ||||||||||||
| Reads | 38.83 million | 2.17 million | |||||||||||
| Writes | 10.98 million | 1.78 million | |||||||||||
| Total IO Operations | 49.8 million | 3.99 million | |||||||||||
| Total GB Read | 1583.02 GB | 48.63 GB | |||||||||||
| Total GB Written | 875.62 GB | 106.32 GB | |||||||||||
| Average Queue Depth | ~5.5 | ~4.6 | |||||||||||
| Focus | Worst case multitasking, IO consistency | Peak IO, basic GC routines | |||||||||||
SSDs have grown in their performance abilities over the years, so I wanted a new test that could really push high queue depths at times. The average queue depth is still realistic for a client workload, but the Destroyer has some very demanding peaks. When I first introduced the Heavy 2011 test, some drives would take multiple hours to complete it - today most high performance SSDs can finish the test in under 90 minutes. The Destroyer? So far the fastest I've seen it go is 10 hours. Most high performance I've tested seem to need around 12 - 13 hours per run, with mainstream drives taking closer to 24 hours. The read/write balance is also a lot more realistic than in the Heavy 2011 test. Back in 2011 I just needed something that had a ton of writes so I could start separating the good from the bad. Now that the drives have matured, I felt a test that was a bit more balanced would be a better idea.
Despite the balance recalibration, there's just a ton of data moving around in this test. Ultimately the sheer volume of data here and the fact that there's a good amount of random IO courtesy of all of the multitasking (e.g. background VM work, background photo exports/syncs, etc...) makes the Destroyer do a far better job of giving credit for performance consistency than the old Heavy 2011 test. Both tests are valid, they just stress/showcase different things. As the days of begging for better random IO performance and basic GC intelligence are over, I wanted a test that would give me a bit more of what I'm interested in these days. As I mentioned in the S3700 review - having good worst case IO performance and consistency matters just as much to client users as it does to enterprise users.
Given the sheer amount of time it takes to run through the Destroyer, and the fact that the test was only completed a little over a week ago, I don't have many results to share. I'll be populating this database over the coming weeks/months. I'm still hunting for any issues/weirdness with the test so I'm not ready to remove the "Preview" label from it just yet. But the results thus far are very telling.
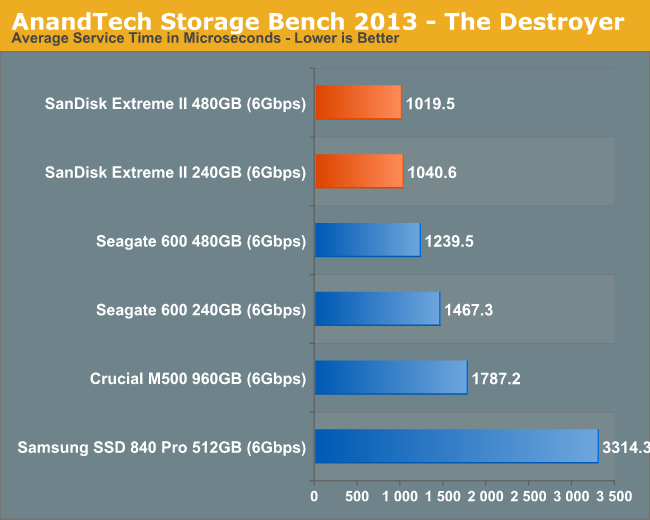
I'm reporting two primary metrics with the Destroyer: average data rate in MB/s and average service time in microseconds. The former gives you an idea of the throughput of the drive during the time that it was running the Destroyer workload. This can be a very good indication of overall performance. What average data rate doesn't do a good job of is taking into account response time of very bursty (read: high queue depth) IO. By reporting average service time we heavily weigh latency for queued IOs. You'll note that this is a metric I've been reporting in our enterprise benchmarks for a while now. With the client tests maturing, the time was right for a little convergence.
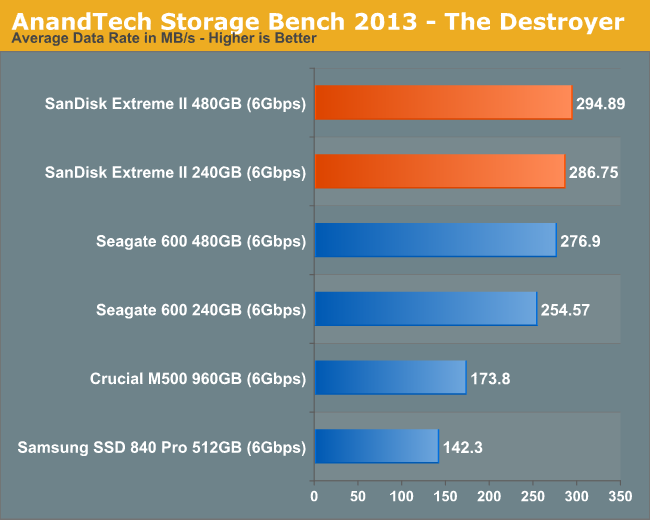
As you'd expect, the combination of great performance consistency and competitive peak performance drives the Extreme II to the top of our Destroyer charts. I didn't expect to see anyone put out an SSD faster than the Seagate 600 so soon but it looks like SanDisk did it.


51 Comments
View All Comments
Quizzical - Monday, June 3, 2013 - link
Good stuff, as usual. But at what point do SSD performance numbers cease to matter because they're all so fast that the difference doesn't matter?Back when there were awful JMicron SSDs that struggled along at 2 IOPS in some cases, the difference was extremely important. More recently, your performance consistency numbers offered a finer grained way to say that some SSDs were flawed.
But are we heading toward a future in which most SSDs do well in any test that you can come up with shows all of the SSDs performing well? Does the difference between 10000 IOPS and 20000 really matter for any consumer use? How about the difference between 300 MB/s and 400 MB/s in sequential transfers? If so, do we declare victory and cease caring about SSD reviews?
If so, then you could claim some part in creating that future, at least if you believe that vendors react to flaws that reviews point out, even if only because they want to avoid negative reviews of their own products.
Or maybe it will be like power supply reviews, where mostly only good ones get sent in for reviews, while bad ones just show up on New Egg and hope that some sucker will buy it, or occasionally get a review when some tech site buys one rather than getting a review sample sent from the manufacturer?
Tukano - Monday, June 3, 2013 - link
I feel the same way. Almost need an order of magnitude improvement to notice anything different.My question now is, where are the bottlenecks?
What causes my PC to boot in 30 seconds as opposed to 10?
I don't think I ever use the same amount of throughput as what these SSD's offer
My 2500K @ 4.5GHz doesn't seem to ever get stressed (I didn't notice a huge difference between stock vs OC)
Is it now limited to the connections between devices? i.e. transferring from SSD to RAM to CPU and vice versa?
talldude2 - Monday, June 3, 2013 - link
Storage is still the bottleneck for performance in most cases. Bandwidth between CPU and DDR3 1600 is 12.8GB/s. The fastest consumer SSDs are still ~25 times slower than that in a best case scenario. Also, you have to take into account all the different latencies associated with any given process (i.e. fetch this from the disk, fetch that from the RAM, do an operation on them, etc.). The reduced latency is really what makes the SSD so much faster than an HDD.As for the tests - I think that the new 2013 test looks good in that it will show you real world heavy usage data. At this point it looks like the differentiator really is worst case performance - i.e. the drive not getting bogged down under a heavy load.
whyso - Monday, June 3, 2013 - link
Its twice that If you have two RAM sticks.Chapbass - Monday, June 3, 2013 - link
I came in to post that same thing, talldude2. Remember why RAM is around in the first place: Storage is too slow. Even with SSDs, the latency is too high, and the performance isn't fast enough.Hell, I'm not a programmer, but perhaps more and more things could be coded differently if they knew for certain that 90-95% of customers have a high performance SSD. That changes a lot of the ways that things can be accessed, and perhaps frees up RAM for more important things. I don't know this for a fact, but if the possibility is there you never know.
Either way, back to my original point, until RAM becomes redundant, were not fast enough, IMO.
FunBunny2 - Monday, June 3, 2013 - link
-- Hell, I'm not a programmer, but perhaps more and more things could be coded differently if they knew for certain that 90-95% of customers have a high performance SSD.It's called an organic normal form relational schema. Lot's less bytes, lots more performance. But the coder types hate it because it requires so much less coding and so much more thinking (to build it, not use it).
crimson117 - Tuesday, June 4, 2013 - link
> It's called an organic normal form relational schemaI'm pretty sure you just made that up... or you read "Dr. Codd Was Right" :P
FunBunny2 - Tuesday, June 4, 2013 - link
When I was an undergraduate, freshman actually, whenever a professor (english, -ology, and such) would assign us to write a paper, we'd all cry out, "how long does it have to be????" One such professor replied, "organic length, as long as it has to be." Not very satisfying, but absolutely correct.When I was in grad school, a professor mentioned that he'd known one guy who's Ph.D. dissertation (economics, mathy variety) was one page long. An equation and its derivation. Not sure I believe that one, but it makes the point.
santiagoanders - Tuesday, June 4, 2013 - link
I'm guessing you didn't get a graduate degree in English. "Whose" is possessive while "who's" is a contraction that means "who is."FunBunny2 - Tuesday, June 4, 2013 - link
Econometrics. But, whose counting?