The AMD Ryzen 3 3300X and 3100 CPU Review: A Budget Gaming Bonanza
by Dr. Ian Cutress on May 7, 2020 9:00 AM ESTCPU Performance: System Tests
Our System Test section focuses significantly on real-world testing, user experience, with a slight nod to throughput. In this section we cover application loading time, image processing, simple scientific physics, emulation, neural simulation, optimized compute, and 3D model development, with a combination of readily available and custom software. For some of these tests, the bigger suites such as PCMark do cover them (we publish those values in our office section), although multiple perspectives is always beneficial. In all our tests we will explain in-depth what is being tested, and how we are testing.
All of our benchmark results can also be found in our benchmark engine, Bench.
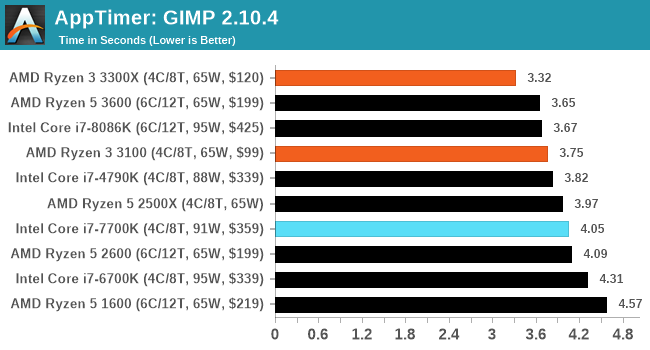
Application Load: GIMP 2.10.4
One of the most important aspects about user experience and workflow is how fast does a system respond. A good test of this is to see how long it takes for an application to load. Most applications these days, when on an SSD, load fairly instantly, however some office tools require asset pre-loading before being available. Most operating systems employ caching as well, so when certain software is loaded repeatedly (web browser, office tools), then can be initialized much quicker.
In our last suite, we tested how long it took to load a large PDF in Adobe Acrobat. Unfortunately this test was a nightmare to program for, and didn’t transfer over to Win10 RS3 easily. In the meantime we discovered an application that can automate this test, and we put it up against GIMP, a popular free open-source online photo editing tool, and the major alternative to Adobe Photoshop. We set it to load a large 50MB design template, and perform the load 10 times with 10 seconds in-between each. Due to caching, the first 3-5 results are often slower than the rest, and time to cache can be inconsistent, we take the average of the last five results to show CPU processing on cached loading.
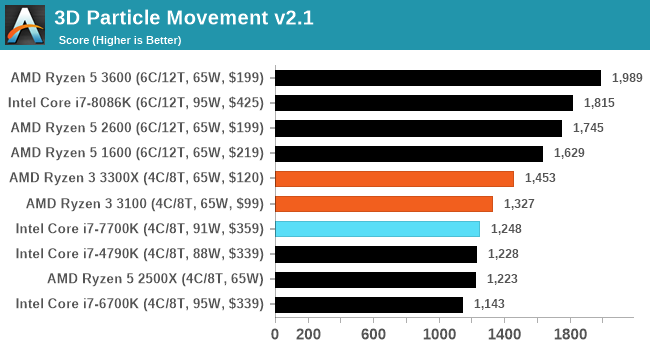
3D Particle Movement v2.1: Brownian Motion
Our 3DPM test is a custom built benchmark designed to simulate six different particle movement algorithms of points in a 3D space. The algorithms were developed as part of my PhD., and while ultimately perform best on a GPU, provide a good idea on how instruction streams are interpreted by different microarchitectures.
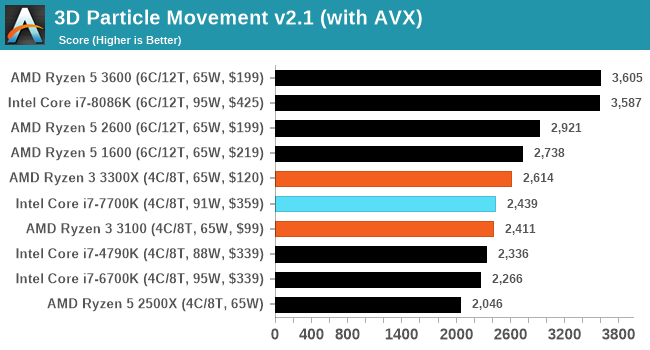
A key part of the algorithms is the random number generation – we use relatively fast generation which ends up implementing dependency chains in the code. The upgrade over the naïve first version of this code solved for false sharing in the caches, a major bottleneck. We are also looking at AVX2 and AVX512 versions of this benchmark for future reviews.
For this test, we run a stock particle set over the six algorithms for 20 seconds apiece, with 10 second pauses, and report the total rate of particle movement, in millions of operations (movements) per second. We have a non-AVX version and an AVX version, with the latter implementing AVX512 and AVX2 where possible.
3DPM v2.1 can be downloaded from our server: 3DPMv2.1.rar (13.0 MB)
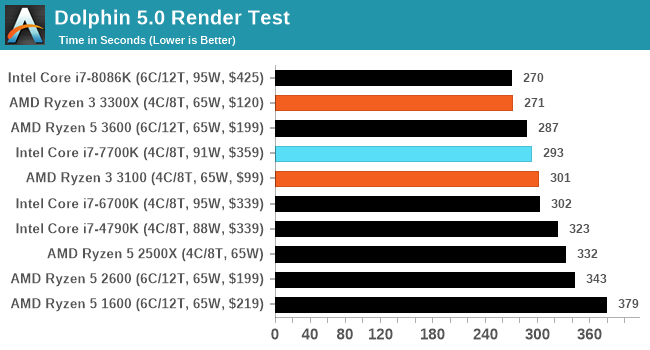
Dolphin 5.0: Console Emulation
One of the popular requested tests in our suite is to do with console emulation. Being able to pick up a game from an older system and run it as expected depends on the overhead of the emulator: it takes a significantly more powerful x86 system to be able to accurately emulate an older non-x86 console, especially if code for that console was made to abuse certain physical bugs in the hardware.
For our test, we use the popular Dolphin emulation software, and run a compute project through it to determine how close to a standard console system our processors can emulate. In this test, a Nintendo Wii would take around 1050 seconds.
The latest version of Dolphin can be downloaded from https://dolphin-emu.org/
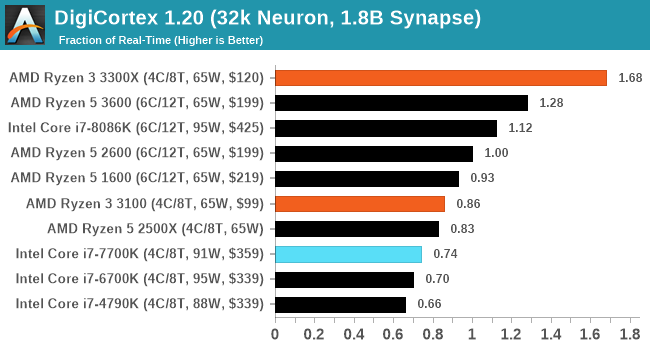
DigiCortex 1.20: Sea Slug Brain Simulation
This benchmark was originally designed for simulation and visualization of neuron and synapse activity, as is commonly found in the brain. The software comes with a variety of benchmark modes, and we take the small benchmark which runs a 32k neuron / 1.8B synapse simulation, equivalent to a Sea Slug.
Example of a 2.1B neuron simulation
We report the results as the ability to simulate the data as a fraction of real-time, so anything above a ‘one’ is suitable for real-time work. Out of the two modes, a ‘non-firing’ mode which is DRAM heavy and a ‘firing’ mode which has CPU work, we choose the latter. Despite this, the benchmark is still affected by DRAM speed a fair amount.
DigiCortex can be downloaded from http://www.digicortex.net/
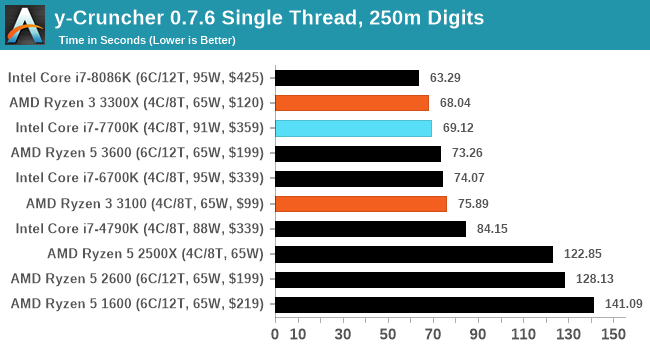
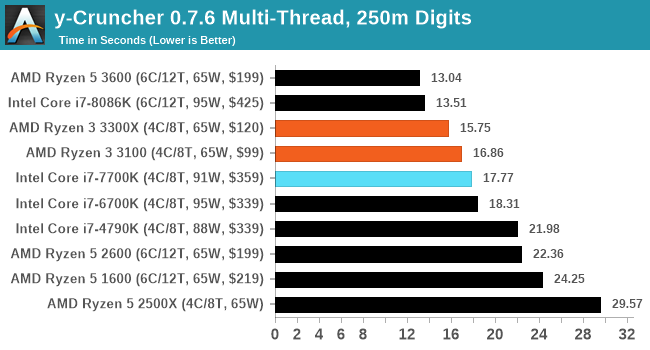
y-Cruncher v0.7.6: Microarchitecture Optimized Compute
I’ve known about y-Cruncher for a while, as a tool to help compute various mathematical constants, but it wasn’t until I began talking with its developer, Alex Yee, a researcher from NWU and now software optimization developer, that I realized that he has optimized the software like crazy to get the best performance. Naturally, any simulation that can take 20+ days can benefit from a 1% performance increase! Alex started y-cruncher as a high-school project, but it is now at a state where Alex is keeping it up to date to take advantage of the latest instruction sets before they are even made available in hardware.
For our test we run y-cruncher v0.7.6 through all the different optimized variants of the binary, single threaded and multi-threaded, including the AVX-512 optimized binaries. The test is to calculate 250m digits of Pi, and we use the single threaded and multi-threaded versions of this test.
Users can download y-cruncher from Alex’s website: http://www.numberworld.org/y-cruncher/
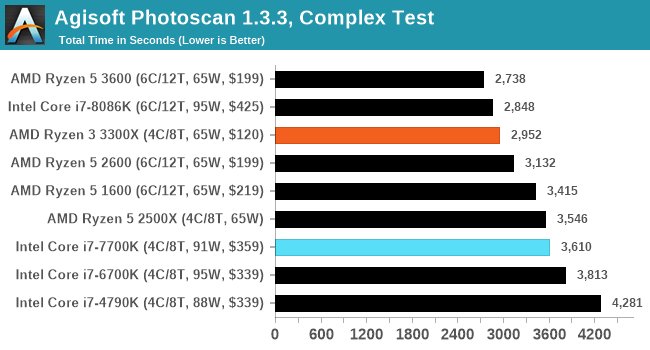
Agisoft Photoscan 1.3.3: 2D Image to 3D Model Conversion
One of the ISVs that we have worked with for a number of years is Agisoft, who develop software called PhotoScan that transforms a number of 2D images into a 3D model. This is an important tool in model development and archiving, and relies on a number of single threaded and multi-threaded algorithms to go from one side of the computation to the other.
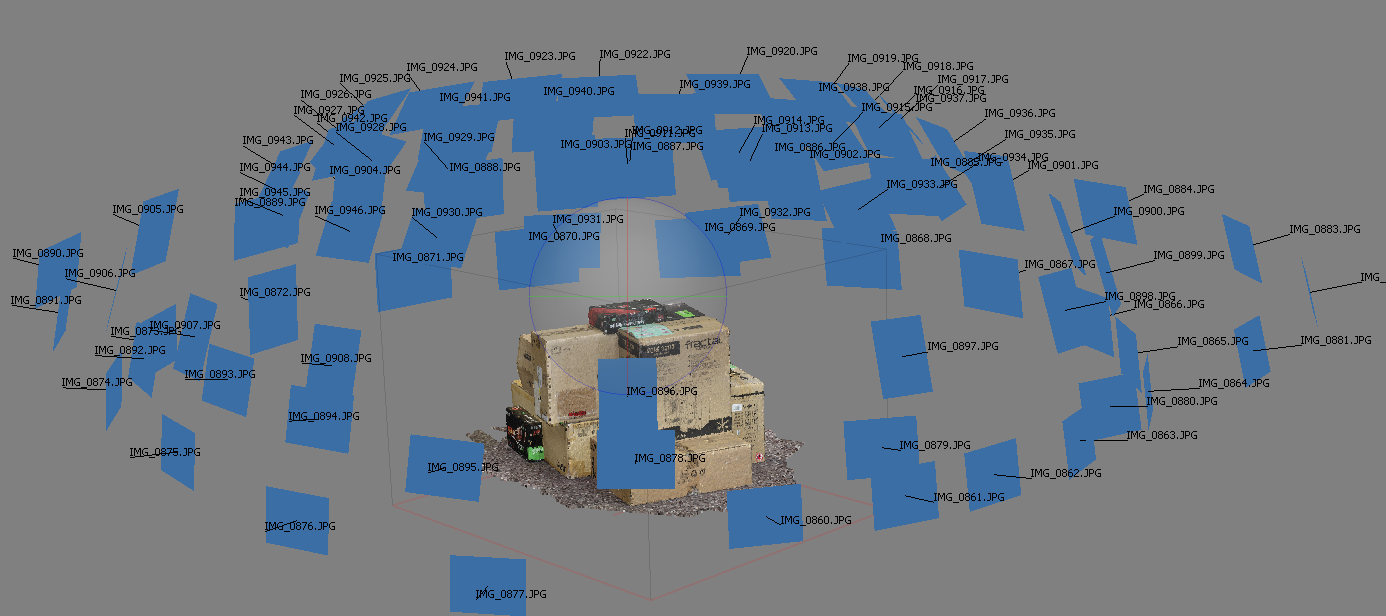
In our test, we take v1.3.3 of the software with a good sized data set of 84 x 18 megapixel photos and push it through a reasonably fast variant of the algorithms, but is still more stringent than our 2017 test. We report the total time to complete the process.
Agisoft’s Photoscan website can be found here: http://www.agisoft.com/


249 Comments
View All Comments
paulemannsen - Saturday, May 9, 2020 - link
@schujj07 Interesting. Your claim sounds totally alien to me, so can you show us some examples where a CPU is significantly slower in 1080p than in 720p when the GPU isnt the bottleneck pls?schujj07 - Sunday, May 10, 2020 - link
Just look at this review and there are a couple examples of this a 720p and 1080p ultra.Spunjji - Monday, May 11, 2020 - link
@superdawgwtfd - If the resolution is too low then you artificially amplify the differences between CPUs. Meanwhile at 1080p you're testing a resolution people will acttually use for high-frame-rate displays, and a decent GPU is still not going to be the primary limit at that resolution.Fataliity - Friday, May 8, 2020 - link
Also a 7700K should be similar to the new 10th gens with same amount of cores. It's same arch / node. Just frequency changes (and I think the low end new ones are saame or slightly lower.Ian Cutress - Friday, May 8, 2020 - link
7700K was tested last year on the same driver sets. It's been in Bench for a whileschujj07 - Thursday, May 7, 2020 - link
The 9100F is 4c/4t with a 3.6/4.2 clock. The 7700k is 4c/8t with a 4.2/4.5 clock. Since both the 7th & 9th gen are both Sky Lake, they will have identical IPC. Based on that we know that the 9100F will perform worse than the 7700k and makes that inclusion pretty pointless. Not to mention that Ian said he never got review samples of the 9th gen i3's. In a lot of the benchmarks we see the R5 1600 & 2600 and the 1600AF will be right between those 2 CPUs in performance. The inclusion of the 4790k and 8086k are nice as they show comparisons from the top 2014 CPU and 2018 CPU. When it comes to single threaded applications, a stock 8086k will be as fast than as a stock 9900k due to having the same boost and IPC. Therefore we are able to extrapolate a lot of data from this whole thing.Spunjji - Monday, May 11, 2020 - link
You made a succession of excellent points here. Alas, I feel some people would rather use their brain for trolling than for processing the information they claim to want in the course of said trolling.crimson117 - Thursday, May 7, 2020 - link
1600AF performance is identical to the 2600, so just use that.3600 is an unfortunate omission.
schujj07 - Thursday, May 7, 2020 - link
Due to the clock differences between the 2 CPUs that is false. The 1600AF will fall between the 1600 & 2600 in performance.crimson117 - Thursday, May 7, 2020 - link
You're right, not identical, but like 95% the performance at worst and often exactly the same in practice (especially gaming above 1080p): https://www.techspot.com/review/1977-amd-ryzen-160...