The AMD Radeon R9 290 Review
by Ryan Smith on November 5, 2013 12:01 AM EST- Posted in
- GPUs
- AMD
- Radeon
- Hawaii
- Radeon 200
Compute
Jumping into pure compute performance, this is another scenario where the 290X shouldn’t throttle as much, and as such the performance differences between the 290 and 290X should be closer to what they are on paper. With compute workloads the ROPs aren’t being hit hard, so that’s power and thermal savings that lets both cards operate at close to their maximum boost clocks.
As always we'll start with our DirectCompute game example, Civilization V, which uses DirectCompute to decompress textures on the fly. Civ V includes a sub-benchmark that exclusively tests the speed of their texture decompression algorithm by repeatedly decompressing the textures required for one of the game’s leader scenes. While DirectCompute is used in many games, this is one of the only games with a benchmark that can isolate the use of DirectCompute and its resulting performance.
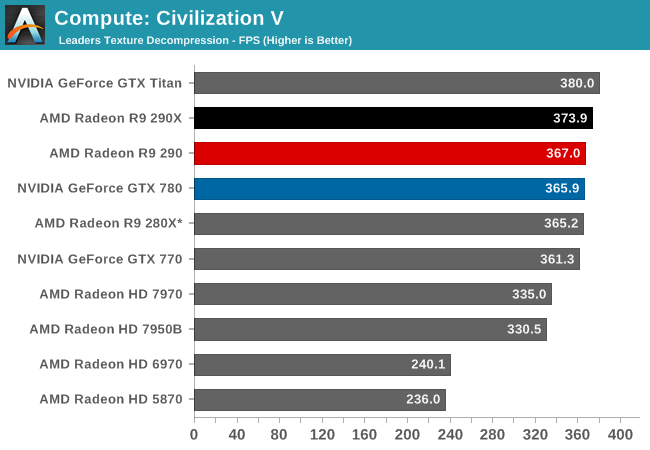
As with the 290X, Civ V can’t tell us much of value due to the fact that we’re running into CPU bottlenecks, not to mention increasingly absurd frame rates. The 290 is marginally slower than the 290X due to the lower clockspeeds and missing CUs, but minimally so.
Our next benchmark is LuxMark2.0, the official benchmark of SmallLuxGPU 2.0. SmallLuxGPU is an OpenCL accelerated ray tracer that is part of the larger LuxRender suite. Ray tracing has become a stronghold for GPUs in recent years as ray tracing maps well to GPU pipelines, allowing artists to render scenes much more quickly than with CPUs alone.
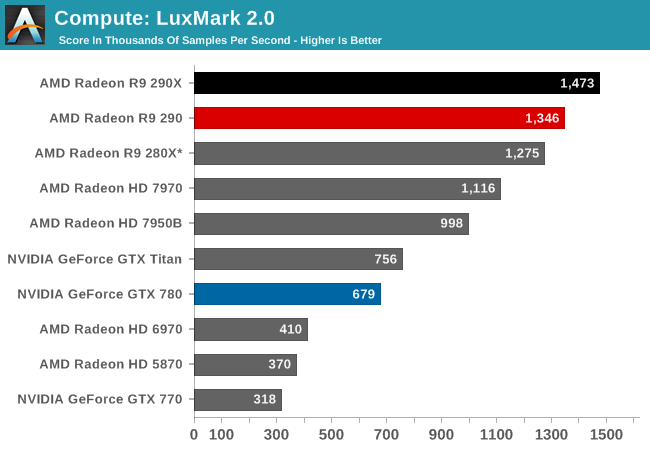
With both cards unthrottled and bound solely by shader performance, it’s an outright foot race for the Radeon cards. 290 trails 290X by around 9%, closely mirroring the difference in the CU count between the two cards. Though 290 is being very closely chased by the 280X, as Hawaii in general seems to have trouble getting the most out of its shader hardware on this benchmark.
Our 3rd compute benchmark is Sony Vegas Pro 12, an OpenGL and OpenCL video editing and authoring package. Vegas can use GPUs in a few different ways, the primary uses being to accelerate the video effects and compositing process itself, and in the video encoding step. With video encoding being increasingly offloaded to dedicated DSPs these days we’re focusing on the editing and compositing process, rendering to a low CPU overhead format (XDCAM EX). This specific test comes from Sony, and measures how long it takes to render a video.
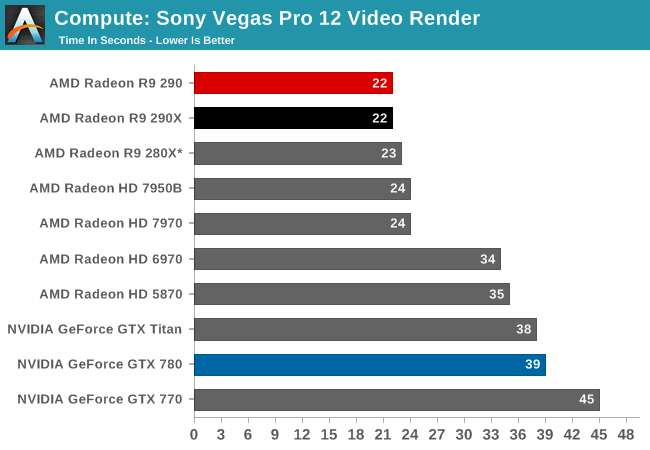
There’s not enough of a GPU performance difference between the two cards to matter with this test. Both tie at 22 seconds.
Our 4th benchmark set comes from CLBenchmark 1.1. CLBenchmark contains a number of subtests; we’re focusing on the most practical of them, the computer vision test and the fluid simulation test. The former being a useful proxy for computer imaging tasks where systems are required to parse images and identify features (e.g. humans), while fluid simulations are common in professional graphics work and games alike.
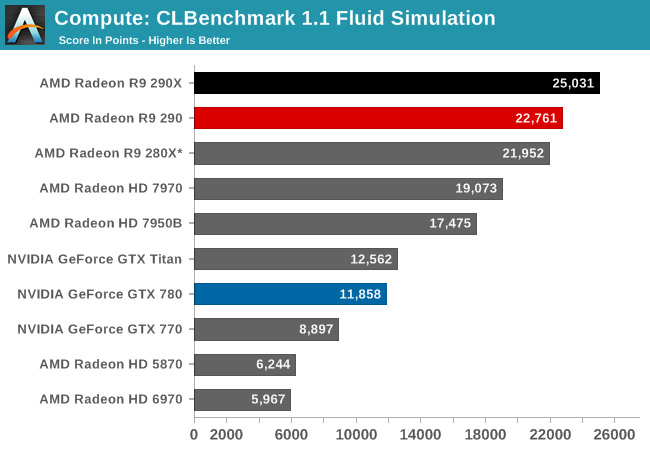
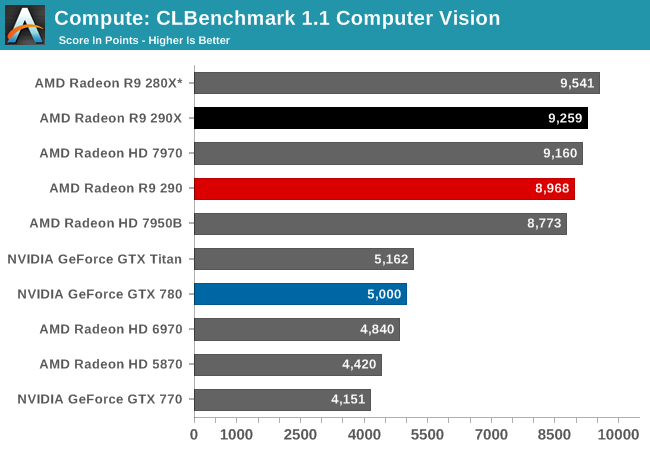
In the CLBenchmark fluid simulation the 290X and 290 take the top spots as expected, with the 290 trailing once more by 9%. However both Hawaii cards are still struggling with the computer vision benchmark, leading to the 290 being edged out by the 7970 of all things.
Moving on, our 5th compute benchmark is FAHBench, the official Folding @ Home benchmark. Folding @ Home is the popular Stanford-backed research and distributed computing initiative that has work distributed to millions of volunteer computers over the internet, each of which is responsible for a tiny slice of a protein folding simulation. FAHBench can test both single precision and double precision floating point performance, with single precision being the most useful metric for most consumer cards due to their low double precision performance. Each precision has two modes, explicit and implicit, the difference being whether water atoms are included in the simulation, which adds quite a bit of work and overhead. This is another OpenCL test, as Folding @ Home has moved exclusively to OpenCL this year with FAHCore 17.
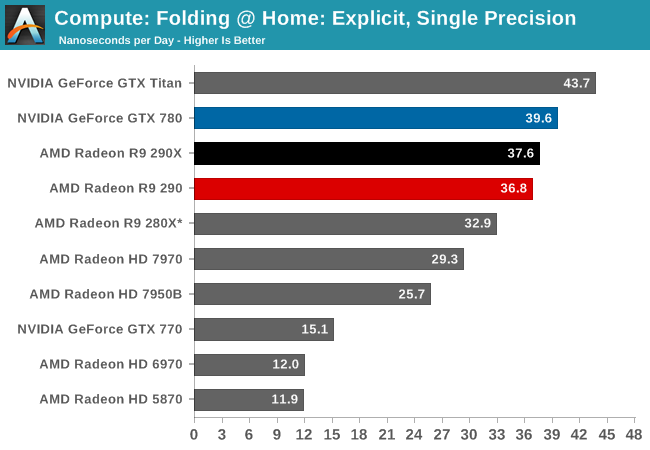
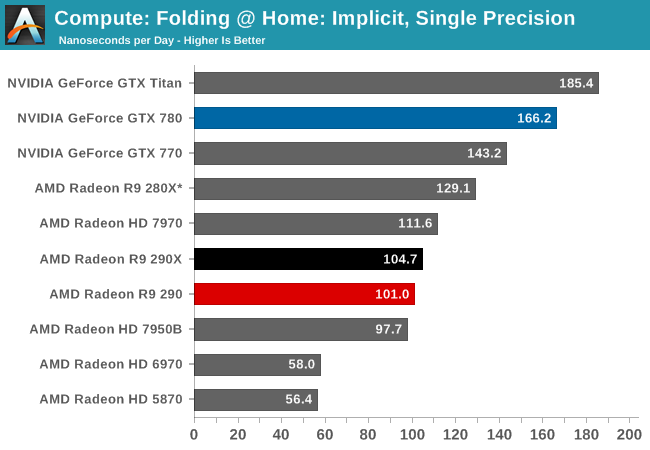
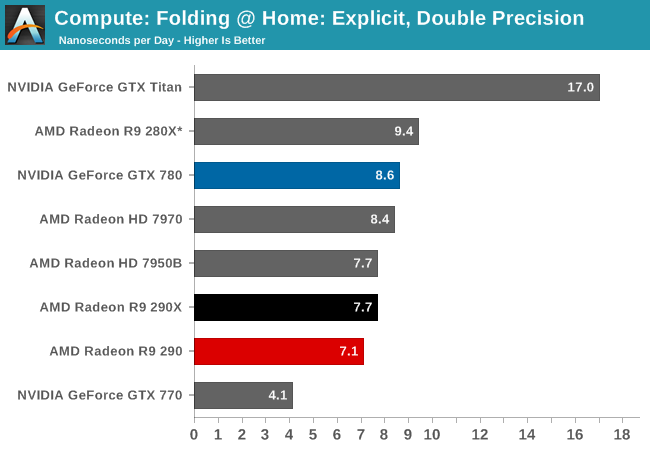
Generally Tahiti and Hawaii are strong performers in the GPU compute arena, but that isn’t of particular help to the 290 here, as it loses out to the GTX 780 in every mode. In single precision FAHBench has trouble putting Hawaii to good use at times, while double precision tests have the 1/8th DP rate 290 and 290X falling behind due to their lower than Tahiti DP throughput.
Wrapping things up, our final compute benchmark is an in-house project developed by our very own Dr. Ian Cutress. SystemCompute is our first C++ AMP benchmark, utilizing Microsoft’s simple C++ extensions to allow the easy use of GPU computing in C++ programs. SystemCompute in turn is a collection of benchmarks for several different fundamental compute algorithms, as described in this previous article, with the final score represented in points. DirectCompute is the compute backend for C++ AMP on Windows, so this forms our other DirectCompute test.
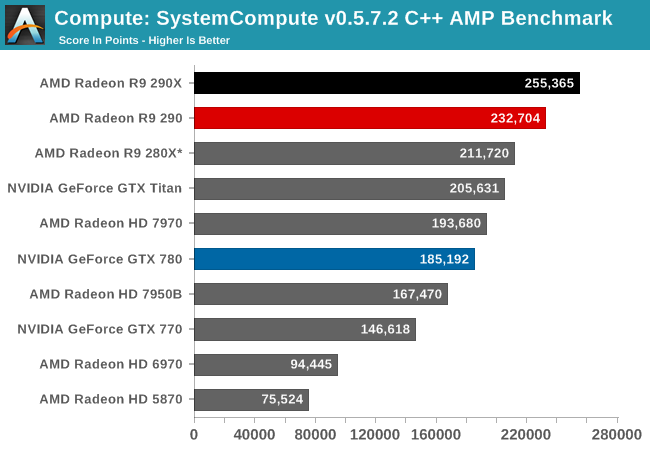
SystemCompute is another benchmark where 290 and 290X do not experience meaningful throttling, and as such are separated by more than what happens in our gaming benchmarks. In this case 290 yet again trails 290X by 9%, though it still enjoys a considerable lead over the GTX 780 and all other NVIDIA cards.


295 Comments
View All Comments
TheJian - Tuesday, November 5, 2013 - link
Which is why I won't buy this or Deltas :) as both are "unacceptably loud"Homeles - Tuesday, November 5, 2013 - link
Do you really think AnandTech readers are representative of your average R9 290 buyer? You're quite misled, if you do.JimmiG - Tuesday, November 5, 2013 - link
Custom PCB's and coolers are going to make this card truly awesome. With better cooling and lower noise levels it will easily match the 290X...techkitsune - Tuesday, November 5, 2013 - link
What I'm waiting for is for all the GPU makers to catch up to me and start making multi-layered metal thermal PCBs so they can ditch the plastic nonsense and get some real thermal dissipation going. No more need to dedicate some heat sink to RAM or VRM, just use all of that on that GPU and cram more power in there!dishayu - Tuesday, November 5, 2013 - link
I would LOVE to know how much noise it makes at 100% fan speed. I'm sure Ryan can find a pair of earmuffs and run that test as well. Just for fun. :DShieTar - Tuesday, November 5, 2013 - link
Ha. Keep in mind that noise is generated by a mechanical vibration. 100% fan speed might damage the card. Also, their sound measurement equipment might blow a fuse ;-)kiwidude - Tuesday, November 5, 2013 - link
I'd be interested to know what your sound level testing methodology is PCPer measured 48.5dB and Techpowerup measured 49dB. I have no idea what PCPer's method is but TPU measures from 100cm with the side of the case open. They both mentioned the card was loud so I'm not crying bias here just interested. [H] said the card wasn't too loud for them at 47% and only got obnoxious at 65%.Ryan Smith - Tuesday, November 5, 2013 - link
Side of the case open, at a foot.Though on a subjective basis all the testing we do means I'm listening to the card for hours on end while the case is fully closed up, so anything that loud when the case is opened for sound testing is still loud even when closed up.
techkitsune - Tuesday, November 5, 2013 - link
" so anything that loud when the case is opened for sound testing is still loud even when closed up."That's because you used an acoustically horrible case choice.
psychobriggsy - Wednesday, November 6, 2013 - link
Wait, case open, one foot away? Is this a joke?Is the volume level noticeable, in gaming, with game audio on at a reasonable level, with the case closed and the distance being around 4 foot (assuming the computer is under the desk and your head is looking at a monitor on top of the desk)?