Original Link: https://www.anandtech.com/show/2192
Since our AMD 690G performance review was published we have been inundated with questions. One of the most common requests is to see how an integrated graphics chipset destined for the typical µATX (commonly referred to as microATX or mATX) platform compares to a more performance-oriented chipset designed for mainstream ATX configurations, with all other components being equal.
This is not necessarily a question we typically ask ourselves as we have always assumed the answer centers on the board design and BIOS options. These will in general determine any performance differences between motherboards using the same chipset, or in this case between boards using chipsets within the same family. We typically find the integrated graphics chipset designs are based upon their non-integrated graphics siblings so performance from a chipset level is usually considered to be equal.
However, there appears to be an urban myth or general misconception from some that integrated graphics chipsets offer inferior system level performance when compared to their sexier siblings. This thought process has been created in part by the standard IGP board design, as most IGP systems are based on the µATX form factor, a standard that usually ends up being featured in the typical low cost office or home machine. These systems represent about 90% of the personal computers sold in the North American market each year and just a little more worldwide.
The µATX platforms usually offer few BIOS tuning options and are geared for the value sector, yet they still offer reliable operation in an environment where performance is secondary to compatibility, ease of use, and serviceability. Naturally, these µATX units usually do not offer the performance level of systems targeting the gaming, workstation, or enthusiast users but that does not mean their overall performance potential should be any less. After all, there is not a standard that dictates µATX boards or IGP designs should perform worse, just a perception they will even if all other factors are equal.
We generally find that if the manufacturer offers the same level of component quality and BIOS options on µATX designs then performance is equal to or at least close enough to the ATX setups that benchmarks are required to spot any differences. We are also surprised that more non-integrated graphic chipsets do not find their way onto µATX boards, although potential cooling issues for overclocking and the limited amount of expansion slots are likely the main reasons for this.
With this in mind and our mailboxes full of requests we decided to break away from our normal test routines and do a little myth busting to see if a couple of very similar boards in our arsenal offer the same level of performance. Let's see what happens when you have a G965 µATX board square off against a P965 ATX board.
Test Setup
| Gigabyte GA-965P-S3 / GA-965GM-S2 Testbed | |
| Processor: | Intel Core 2 Duo E6300 Dual Core, 1.86GHz, 2MB Unified Cache 1066FSB, 7x Multiplier |
| CPU Voltage: | 1.3250V |
| Cooling: | Zalman 9500 Air Cooling |
| Power Supply: | Corsair CMPSU-620HX 620W |
| Memory: | OCZ Flex XLC PC2-6400 (2x1GB) (ProMOS Memory Chips) |
| Memory Settings: | 3-4-4-9 1.90V |
| Video Cards: | MSI X1950XT |
| Video Drivers: | ATI Catalyst 7.2 |
| Hard Drive: | Western Digital 74GB 10,000RPM SATA 16MB Buffer Seagate Barracuda 7200.10 500GB SATA 16MB Buffer |
| Optical Drives: | Plextor PX-760A, PX-B900A |
| Case: | Cooler Master CM Stacker 830 |
| Operating System: | Windows Vista Home Premium 32-bit |
| . | |
Our two boards are from Gigabyte and each one offers similar features, BIOS options, and board level components. The street price for each board is around $105 at this time. We would like to mention that Foxconn and ASUS have matching sibling pairs but our Gigabyte GA-965GM-S2 was already in testing so it was chosen in the interest of saving time. Our Foxconn G9657MA-8KS2H offers a wider selection of BIOS options including the ability to change several voltage options, so it may perform slightly better overall but not enough to dramatically alter our findings. We set up each board with the exact same BIOS settings and found that the Gigabyte GA-965P-S3 ran slightly tighter memory sub-timings. We thought about using MemSet to adjust the sub-timings but figured in the end that most users would not utilize this utility to change timings on boards in the price sector.
A 2GB memory configuration is standard in our entry level Vista test beds as we highly recommend this amount of memory now. Our choice of mid-range OCZ Flex XLC PC-6400 memory represents an excellent balance of price and performance and offers a very wide range of memory settings at stock voltages. Our memory timings are determined by finding the best memory bandwidth via MemTest 86 along with test application results for each board. We only optimize the four main memory settings (CAS, tRCD, tRP, and tRAS) with sub-timings remaining at Auto settings. This will benefit the P965 platform slightly as we found the memory sub-timings were generally tighter on this board than on the G965 variant.
We are utilizing an MSI X1950 XTX video card to prevent our 1280x1024 resolutions from becoming completely GPU bound for our motherboard test results. All of our tests are run in an enclosed case with a dual optical/hard drive setup to reflect a moderately loaded system platform. Windows Vista is fully updated and we load a clean drive image for each system to ensure driver conflicts are kept to a minimum.
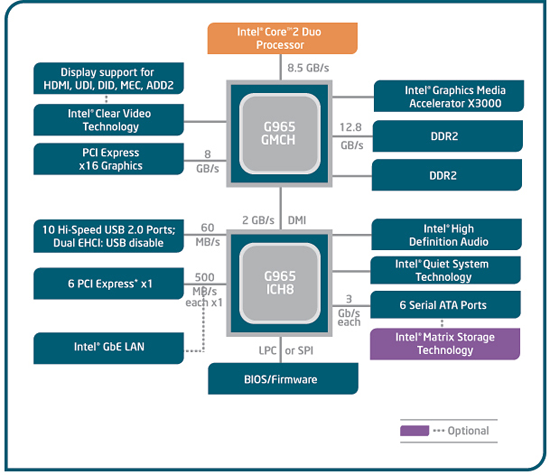
We are not going to address overclocking capabilities of the two boards in today's test results. However, the G965 is limited to 350FSB due to the X3000 graphics core and shared memory pipeline. The realistic overclock levels we have seen on our best G965 samples have been around 325FSB. Based upon this, if overclocking is a priority then we definitely recommend the P965 based boards in this price sector.
Synthetic Memory Performance
 |
| Click to enlarge |
In our Sandra memory test, we see the P965 based board scoring slightly higher in both the buffered and unbuffered scores due to tighter sub-timing settings for the memory. We will see this slight performance improvement in the unbuffered scores generally give the P965 board an advantage in the memory sensitive benchmarks. When we equalize the settings, the P965 still scored about 40 points better on each result - less than a 1% advantage.
We know Intel made a few concessions with the memory controller due to the on-board X3000 graphics core but this primarily affects overclocking capabilities. With additional BIOS tuning from Gigabyte in the memory and MCH timing settings we are sure the end results could be even. The results with SuperPi 1.5 also reflect a slight but unnoticeable difference between the two boards.
Synthetic Graphics Performance
The 3DMark series of benchmarks developed and provided by Futuremark are among the most widely used tools for benchmark reporting and comparisons. Although the benchmarks are very useful for providing apple to apple comparisons across a broad array of GPU and CPU configurations they are not a substitute for actual application and gaming benchmarks. In this sense we consider the 3DMark benchmarks to be purely synthetic in nature but still valuable for providing consistent measurements of performance.
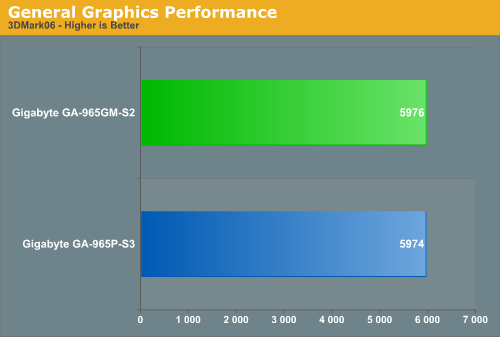
In our GPU intensive 3DMark06 test, each platform score is basically the same although we see the G965 board finishing slightly ahead which indicates there is not a noticeable performance penalty for using a discreet GPU solution on this particular integrated graphics platform. Our G965 board also offered the best CPU performance in this benchmark.
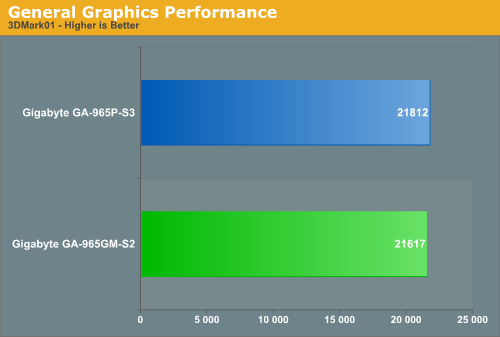
In the more memory and CPU sensitive 3DMark01 benchmark we see P965 board topping the G965 board. We have generally found that the Sandra unbuffered memory bandwidth results will correlate with benchmarks that are memory sensitive. After equalizing the memory sub-timings we consistently had a 90 point difference between the two boards over five different test runs. Either way, the difference is still less than 1%.
General System Performance
The PCMark05 benchmark developed and provided by Futuremark was designed for determining overall system performance for the typical home computing user. This tool provides both system and component level benchmarking results utilizing subsets of real world applications or programs. This benchmark is useful for providing comparative results across a broad array of Graphics, CPU, Hard Disk, and Memory configurations along with multithreading results. In this sense we consider the PCMark benchmark to be both synthetic and real world in nature and it provides consistency in our benchmark results.
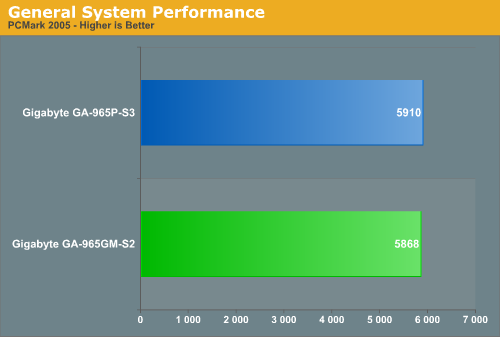
The P965 board once again tops the chart although the margin remains slim. Both boards basically tied each other in the individual tests with the P965 board performing slightly better in the multitasking tests.
Multitasking Performance
We devised a script that would compress our standard test folder consisting of 444 files, ten subfolders, and 602MB worth of data, convert a 137MB High Definition QuickTime movie clip to a 37MB MPEG-4 format, play back the first two chapters of Office Space with PowerDVD, and run our AVG anti-virus program in the background. We stop the script when the file compression and video conversion are complete. This is a very taxing script for the CPU, Memory, and Storage subsystem. We also find this to be a good indicator of system stability during our overclocking testing.
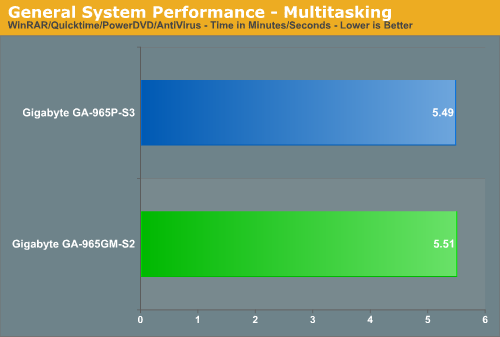
The performance difference basically mirrors our other tests with the P965 board finishing first due to great CPU/disk performance during the AVG virus scan. Although our video conversion and playback never stuttered during testing on the G965 board we did see pauses in the AVG scanning and the number of files scanned was about two percent less at the end of the test. However, the differences in scores is absolutely minimal and only something a benchmark would detect.
Media Encoding Performance
Our first series of tests is quite easy - we take our original Office Space DVD and use AnyDVD and Nero Recode 2 to copy the full DVD to the hard drive without compression, thus providing an almost exact duplicate of the DVD. We then fired up Nero Recode 2, selected our Office Space copy on the hard drive, and performed a shrink operation to allow the entire movie along with extras to fit on a single 4.5GB DVD disc. We then go back and use Nero Recode to shrink the full DVD copy and burn it onto our DVD disc. We left all options on their defaults except we checked off the advanced analysis option. The scores reported include the full encoding process and are represented in minutes/seconds, with lower numbers indicating better performance.
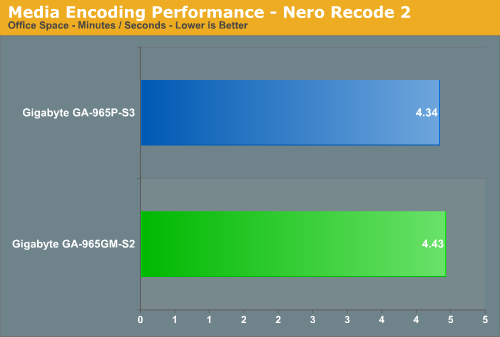
We continue to see a strong performance from the P965 board in our application tests. Our only issue with the G965 board was that the conversion process would slow down at various intervals while the disk was being heavily accessed. The quality of the video conversion was never affected but it appeared under heavy CPU usage that disk performance or throughput suffered ever so slightly. Both boards utilize the same ICH8 Southbridge so our conclusion would be potential timing or tuning issues between the Northbridge and Southbridge as our disk access/throughput scores in HDTune and IPEAK were identical between the two boards. The end result is one of the larger (a whopping 2.1%!) performance differences - again not something you would typically detect.
Media Performance
We utilize the widely available Retouch Artists Photoshop Speed Test for measuring platform performance in Adobe's Photoshop CS3. The benchmark applies a number of actions to a test image and we measure the total time elapsed during the active portion of the test. We set history states to 1, cache levels to 4, and CS3 is configured to make use of all available system memory. The scores reported include the full conversion process and are represented in minutes/seconds, with lower numbers indicating better performance.
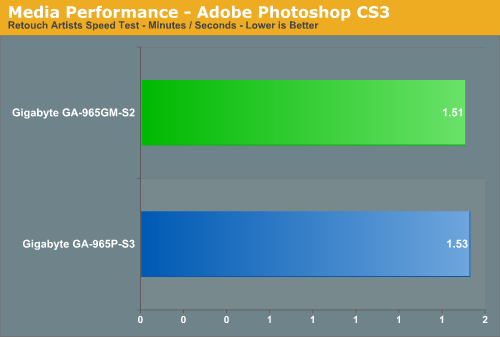
The results are once again interesting as we did not expect our G965 board to perform this well after the previous results. Photoshop has generally favored CPU and memory throughput speeds so our results indicate our Encoding and Multitasking scores show an issue with timing or tuning between the Northbridge and Southbridge. However, any differences in actual scores are minor and probably just indicate something additional BIOS tuning could fix.
Audio Encoding Performance
Our audio test suite consists of Exact Audio Copy v095.b4 and LAME 3.98a3. We utilize the INXS Greatest Hits CD that contains 16 tracks totaling 606MB of one time '80s hits.
We set up EAC for variable bit rate encoding, burst mode for extraction, use external program for compression, and to start the external compressor upon extraction (EAC will read the next track while LAME is working on the previous track, thus removing a potential bottleneck with the optical drive). We also set the number of active threads to two to ensure both cores are active during testing. The results are presented in minutes/seconds for the encoding process, with lower numbers being better.
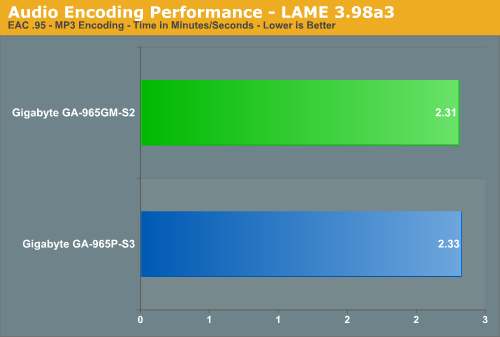
Our Plextor drive consistently takes two minutes and nine seconds to read all sixteen tracks. This means our test systems are only utilizing one core during testing until the midway point of the extraction process where the drive speed begins exceeding the capability of the encoder and requires the use of a second thread.
As in the Photoshop test, the more intensive CPU tests seem to favor the G965 over our P965 board when running at the same basic memory timings. The differences are once again minimal showing that both systems are equal in our opinion.
File Compression Performance
In order to save space on our hard drives and ensure we had another CPU crunching utility, we will be reporting our file compression results with the latest version of WinRAR that fully supports multi-treaded operations and should be of particular interest for those users with dual core or multi-processor systems. Our series of file compression tests utilizes WinRAR 3.62 to compress our test folder that contains 444 files, ten subfolders, and 602MB worth of data. All default settings are utilized in WinRAR along with our hard drive being defragmented before each test.
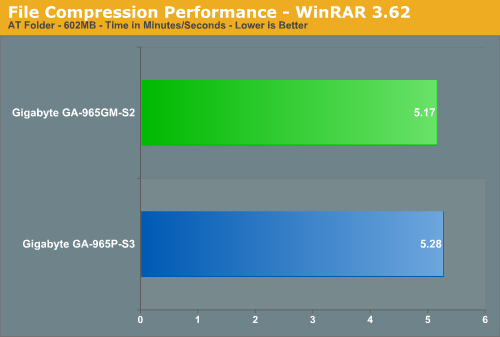
Once again in a CPU crunching test we see the G965 fair better than the P965. This test is slightly surprising as it tends to be fairly disk intensive. However, the read/write operations are very short in nature with burst speeds being important compared to the constant write activity in the media encoding tests. Where the media encoding favored the P965 by 2%, the reverse is true here and the G965 gets its largest margin of victory: a similarly "huge" 2.1% discrepancy. That's relatively close to the margin of error for these tests anyway, so we can declare performance to be more or less a tie between the two platforms.
Standard Gaming Performance
As usual, gaming performance was tested with a variety of current games. We ran benchmarks with our standard 1280x1024 resolution without antialiasing enabled (and generally without anisotropic filtering, though that varies by game). Given the number of users that run 19" LCDs, 1280x1024 represents one of the most commonly used resolutions. We could certainly increase the amount of eye candy being displayed in most of the games, but as this is a motherboard/chipset benchmark we aren't particularly interested in maxing out the graphics cards in our tests.
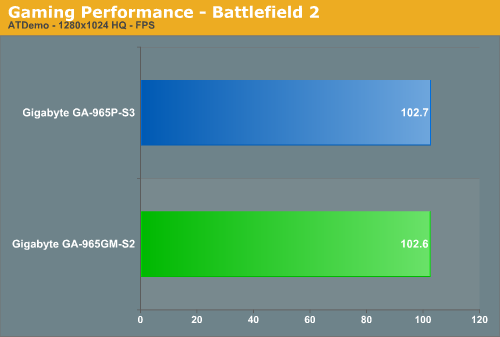
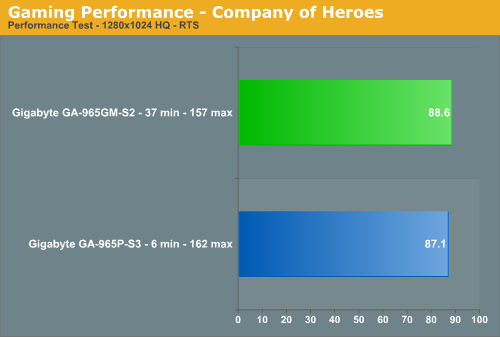
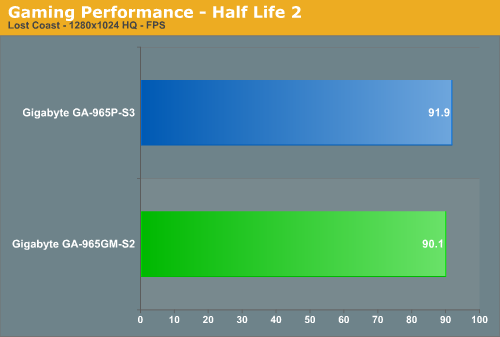
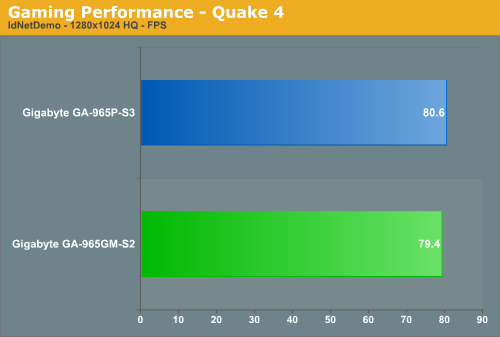
Our three FPS games favor the P965 board as we expected since they are memory sensitive at these resolutions and settings. Our CPU crunching RTS game favors the G965 platform as did the previous CPU intensive tests with the most telling benchmark result being the minimum frame rate in Company of Heroes. Our P965 board consistently hit 4 to 6 frames per second minimums in our tests even though its maximum frame rate was always higher. We noticed the same pattern in Age of Empires and Supreme Commander. Otherwise, unless we had tested with a benchmark, the performance difference between the two boards is not noticeable during usage except for a couple of stutters in Company of Heroes.
Power Consumption
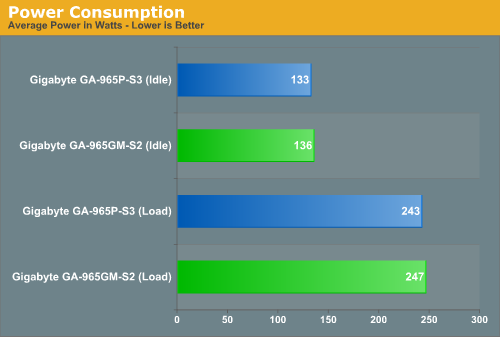
Our power consumption numbers are based on our test setup for this article and each board has C1E/EIST turned off. We will provide additional power and thermal numbers in our µATX roundup articles. The G965 consumes a little more power due to the additional circuitry onboard for the X3000 graphics core but we were surprised the difference was not greater.
Quick Take
Our initial performance results indicate a toss up as to which solution is better. That was to be expected as we have two almost identical boards from a features and BIOS perspective that only differ in their use of chipsets and layout design. Even though the chipsets are different, they are based on the same core logic so any real performance differences would be derived from BIOS tuning, options, and the quality of board components.
While the G965 boards will never overclock as well as their P965 siblings, the base performance is almost identical if you have the ability to tune the board. This is a limitation of the chipset and not the µATX board design. On the AM2 side, we have already seen excellent overclocking results from the abit and DFI µATX boards and expect even better performance with their GeForce 7050 designs next month. Also, the performance differences between AM2 solutions in the µATX and ATX designs mirror our test results on the Intel platform for the most part.
We have a few µATX boards with the G965 chipset that have very limited BIOS options, but even so our initial performance tests only indicate up to a 2% difference in most test results due to the memory timings being the prime differentiator in the scores. In fact, probably the biggest difference we have witnessed in our game tests is 5% between a top tier P965 ATX board that has been tuned and a base level G965 µATX board from Intel utilizing auto settings. Our application tests vary from 1% to 3% in scores at stock CPU settings between the two boards with DDR2-800 memory.
In the end, we feel like your choice of a µATX or ATX solution should be dictated by the requirements of the system (price, features, layout, overclocking, warranty, etc.). The use of an integrated graphics chipset will not inherently reduce performance relative to a discrete graphics chipsets, provided you use identical components. It will be the other aspects - particularly overclocking if that's a concern - that will warrant the use of a discrete graphics chipset rather than an IGP solution.


