Original Link: https://www.anandtech.com/show/2280
NVIDIA 680i SLI: Official 1333MHz FSB CPU Support Arrives
by Gary Key on July 20, 2007 12:01 AM EST- Posted in
- CPUs
Intel's P35 chipset was recently introduced amid gala fanfare with "official" support for the upcoming 45nm based Penryn products and the newly arrived 1333MHz FSB based processors. While the spotlight has been on Intel's latest chipset for the past few weeks, we kept hearing whispers from the guys in green wondering what all the fuss was about. After all, they told us bluntly, we have a chipset that has been in the market for almost nine months now that fully supports the same features that everyone got excited about when the blue team rolled into Computex 2007 with sirens blazing.
True enough, NVIDIA has always discussed these capabilities with us and in fact they hold true for the entire 600i series of chipsets. However, even after getting our arms twisted a little and noticing the whispers becoming increasingly louder, who would blame us for still being a little skeptical about "official" 1333FSB support. After all, there was a lot of hype, fanfare, and a great deal of media coverage that surrounded the launch of the NVIDIA 600i family of chipsets last November. Since that time users have experienced a number of maladies with these chipsets that ranged from crackling audio with SLI, data corruption, degraded RAID arrays, USB keyboard compatibility problems, and poor quad core overclocking just to name a few that we have experienced first hand.
Several BIOS releases later, new board designs, and even a few component changes, it seems as if the majority (not all) of these problems and others have finally been solved. To be fair, the Intel P965 was also plagued with a like number of problems upon launch that have since been solved - well, most of them. So, it was with great interest after receiving our first 1333MHz FSB processors that we set out to see if the 600i series of chipsets lived up to NVIDIA's claims about "official" 1333FSB support. We already knew they fully supported 1333FSB rates and beyond, but how they would act with a native 1333FSB processor was the wild card in our tests.
We lined up several 600i motherboards on the test bench, popped our QX6850 in each one, flipped the switch, and then took several deep breaths as board after board failed to run properly. A couple of boards would not even POST, a few worked fine, and some would boot into Vista and then act strange - not Britney Spears strange mind you; more like Paris Hilton behind bars. You just knew that QX6850 wanted to escape its confines and party all night long, but instead it was limited to a few whimpers and constant pleas for help from its socket induced hell.
We thought about hiring a team of psychologists and maybe a good lawyer to help our performance challenged CPU out of this mess, but then realized all we needed was a P35 board. Alright, that was probably uncalled for and we should have saved any zingers for discussions about the complete lack of Vista driver updates for our 680i platform since February. As it turns out the only assistance required to set this processor free was BIOS updates from the respective manufacturers for our group of 600i based motherboards. Those BIOS updates have been coming in hot and heavy over the past two weeks and we are glad to say that every 600i board in the lab is now running correctly, and a couple are even impressing us in early test results.
We wanted to bring you a full roundup and comparison against the best that Intel has to offer but most of our BIOS releases are still in beta testing so that will have to wait. We have discovered very few problems at this time, which is a testament to the maturity of these platforms. While our test subjects are still busily running the new benchmark suite, we thought it would be a perfect time to provide an early look at the performance of the 680i chipset and the QX6850 before our efforts switch to the budget sector. We chose the QX6850 as the majority of overclocking issues with the 680i boards have centered on quad core processors in the past, although these issues appear to be solved to a certain degree.
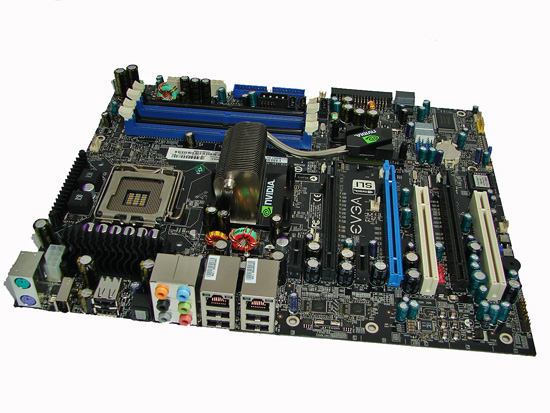
Overclocking is never guaranteed but when you purchase a 680i board that is advertised as being "designed for the gamer and serious enthusiast" with extreme overclocking in mind, this would lead one to believe overclocking will not be a problem. Our article today will provide a glimpse as to how well our EVGA 680i SLI motherboard officially handles a 1333MHz FSB quad core and overclocking along with general performance results.
QX6850 Quad Core Overclocking:
| EVGA 680i SLI Overclocking Testbed |
|
| Processor | Intel Core 2 Extreme QX6850 Quad Core, 3.00GHz, 8MB Unified Cache 1333FSB, 9x Multiplier |
| CPU Voltage | 1.4625V (default 1.2750V) |
| Cooling | Tuniq 120 Air Cooling |
| Power Supply | OCZ ProXStream 1000W |
| Memory | OCZ Reaper PC2-9200 (2x1GB) 3-4-3-9 |
| Video Cards | 1 x MSI 8800GTX |
| Hard Drive | Western Digital 150GB 10,000RPM SATA 16MB Buffer |
| Case | Cooler Master CM Stacker 830 |
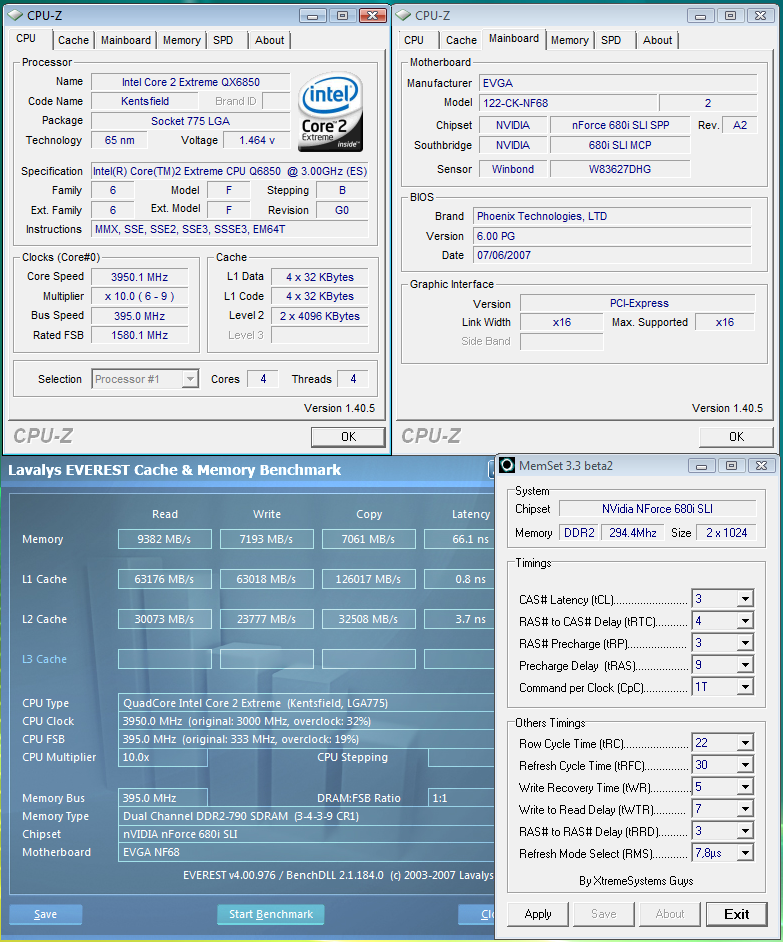
| Maximum CPU OC | 395x10 (3-4-3-9 1T, 790MHz, 2.15V), CPU 1.4625V 3950MHz (+32% CPU) |
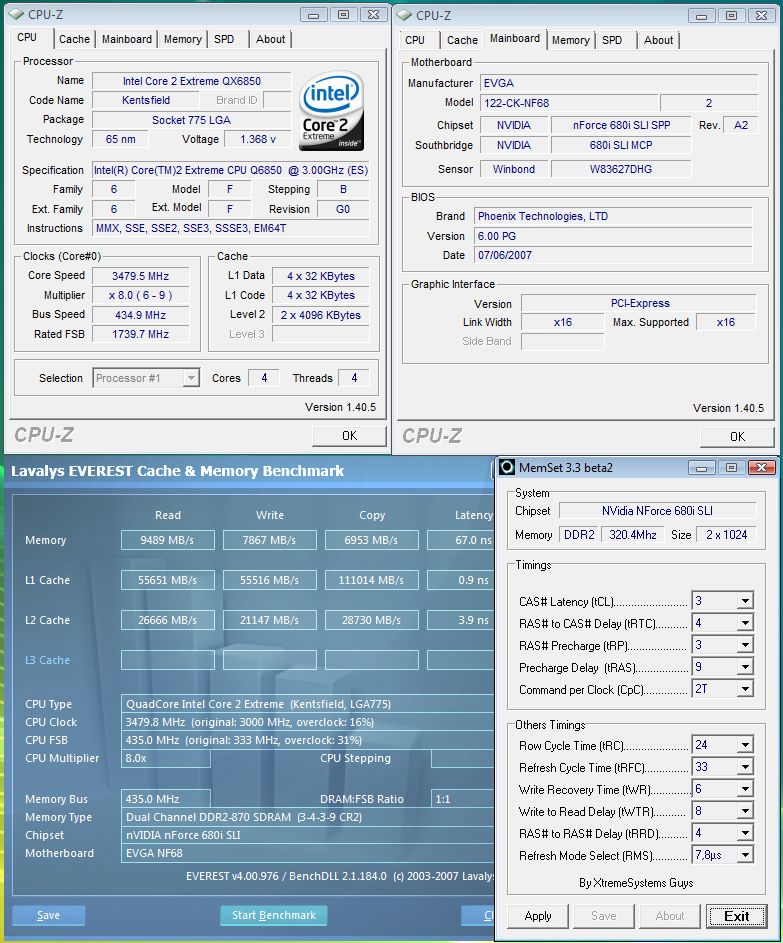
| Maximum FSB OC | 435x8 (3-4-3-9, 870MHz, 2.15V), CPU 1.3625V 3480MHz (+31% FSB) |
| . | |
We need to state up front that our QX6850 sample is not the best of the lot when it comes to overclocking. In fact, it seems downright disappointing to us as it does not matter what voltages or board we utilize: this processor refuses to POST once you dial in 4GHz.
 |
| Click to enlarge |
We are utilizing the recently released P30 BIOS that features additional tuning for 1333MHz FSB processors. We did notice some improvements over the P29 Beta but to be honest, the majority of improvements are with the 1066FSB based processors. These improvements range from slightly higher overclocks with lower voltage requirements to improved compatibility with our RAID cards.
Our first test is designed to maximize our CPU speed while also overclocking the FSB as much as possible. We ended up with a final 10x395 setting with our memory operating in Sync mode at DDR2-790 with timings at 3-4-3-9 1T. We noticed with this CPU and board combination that throughout testing we had a choice of either running tight timings near DDR2-800 or having to really loosen up the timings at DDR2-1066 or above in order to maintain stability.
Our OCZ PC2-9200 will normally do 4-4-4-12 timings up to DDR2-1100 but we had to run 5-5-5-15 or higher above 1000 with this CPU. We determined our best memory throughput and latencies were around DDR2-800 so we remained in this range throughout testing. We also tried additional memory modules from Corsair, G.Skill, and SuperTalent with the same results. It appears to us that some fine tuning is still required with the P30 BIOS at this time.
 |
| Click to enlarge |
We dropped the multiplier on our QX6850 to eight and were rewarded with a final 8x435FSB setting compared to a 8x475FSB on the ASUS Blitz Extreme board. This board did make it to 8x470FSB with greatly increased voltages, but it was not stable over the time it takes to run our benchmark test suite. The main culprit is heat and even with additional air cooling, the system is just not stable on a 24/7 basis.
We should also note that we experienced one of the infamous 680i "holes" with our component combination that started around 440FSB and stayed until the 465FSB range. That left us with a choice of 435FSB or 470FSB; we really tried to make the 470FSB work on a consistent basis but we just could not get the system stable enough to sign off on it for daily usage. Once again, we had a degree of difficulty running our memory in the DDR2-1066 to 1170 range without resorting to very loose timings with 5-7-7-24 required at DDR2-1170 for stability. This did not occur with our E6850 CPU so the problem seems to be the quad core setup.
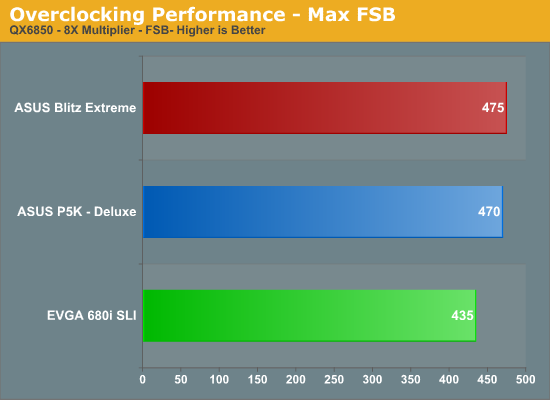
While our current EVGA 680i SLI sample tops out around 40FSB lower than our two ASUS P35 boards, we still consider 435FSB with the 680i chipset to be very good. We have a fairly strong opinion about the current FSB race and the detriments it brings to overall system performance and stability, but we'll save it for the roundup.
Test Setup:
| Standard Test Bed Vista Ultimate 64-Bit Test Configuration |
|
| Processor | Intel Core 2 Duo QX6850 (3.00GHz, 8MB Unified Cache) |
| RAM | OCZ Reaper PC2-9200 (2x1GB) TEAM Xtreem DDR3-1600 (2x1GB) |
| Hard Drive | Western Digital 150GB 10,000RPM SATA 16MB Buffer |
| System Platform Drivers | Intel 8.3.0.1013 NVIDIA 15.00 |
| Video Cards | 1 x MSI 8800GTX |
| Video Drivers | NVIDIA 163.11 |
| CPU Cooling | Tuniq 120 |
| Power Supply | OCZ ProXStream 1000W |
| Optical Drives | Plextor PX-760A, Plextor PX-B900A |
| Case | Cooler Master CM Stacker 830 |
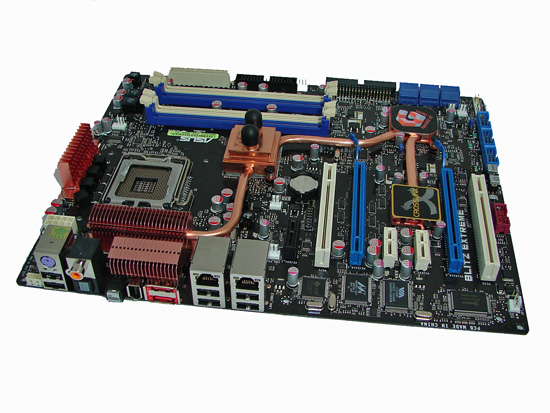
| Motherboards | ASUS Blitz Extreme (Intel P35 DDR3) - BIOS 0702 ASUS P5K Deluxe (Intel P35 DDR2) - BIOS 0404 EVGA 680i SLI (NVIDIA 680i DDR2) - BIOS P30 |
| Operating System | Windows Vista Ultimate 64-Bit |
| . | |
Test conditions were maintained the same, as much as possible, over the platforms tested. Our game tests were run at settings of 1280x1024 HQ to ensure our GPU was not a bottleneck during testing. All results are reported in our charts and color-coded for easier identification of results.
We utilize new drive images on each board in order to minimize any potential driver conflicts. Our 3DMark results are generated utilizing the standard benchmark resolution for each program. We run each benchmark five times, throw out the two low and high scores, and report the remaining score. All results are run at stock speeds for this article with memory timings at 6-6-6-15 1333-DDR3 for the ASUS Blitz Extreme, 4-4-4-10 1066-DDR2 for the ASUS P5K Deluxe and 3-3-3-6 1T 800-DDR2 for the EVGA 680i SLI motherboard. In order for our tests to be fair, we did upgrade to the latest BIOS releases for the ASUS P35 boards for comparison scores.
Our choice of software applications to test is based on programs that enjoy widespread use and produce repeatable and consistent results during testing. Microsoft Vista has thrown a monkey wrench into testing as the aggressive nature of the operating system to constantly optimize application loading and retrieval from memory or the storage system presents some interesting obstacles. This along with the lack of driver maturity or features (Hello NVIDIA) will continue to present problems in the near future with benchmark selections.
Our normal process was to change our power settings to performance, delete the contents of the prefetch folder, and then reboot after each benchmark run. This is a lengthy process to be sure, but it results in consistency over the course of benchmark testing. All applications were run with administer privileges.
Synthetic Graphics Performance:
The 3DMark series of benchmarks developed and provided by Futuremark are among the most widely used tools for benchmark reporting and comparisons. Although the benchmarks are very useful for providing apples-to-apples comparisons across a broad array of GPU and CPU configurations they are not a substitute for actual application and gaming benchmarks. In this sense we consider the 3DMark benchmarks to be purely synthetic in nature but still very valuable for providing consistent measurements of performance.
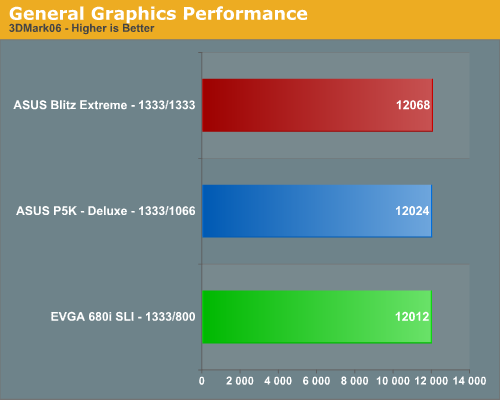
In our 3DMark06 test, all of the boards are bunched together with a 0.004% spread from top to bottom. In essence all of the boards perform equally from a total score viewpoint. The Intel boards had a 1.8% advantage in the CPU tests while the NV board had a 1.67% advantage in the Graphics section of the test. This will be a familiar pattern in our limited benchmark results today.
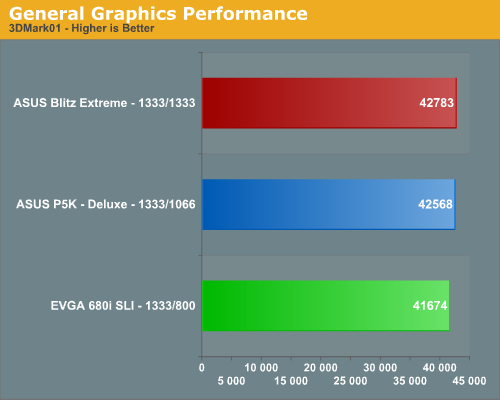
In the more memory/CPU throughput sensitive 3DMark01 benchmark we see our Intel boards taking top honors. The spread is only 2.6%, however, so minor differences in performance are not really noticeable in either 3DMark unless you count on the differences for benchmark scores.
General System Performance
The PCMark05 benchmark developed and provided by Futuremark was designed for determining overall system performance for the typical home computing user. This tool provides both system and component level benchmarking results utilizing subsets of real world applications or programs. This benchmark is useful for providing comparative results across a broad array of Graphics, CPU, Hard Disk, and Memory configurations along with multithreading results. In this sense we consider the PCMark benchmark to be both synthetic and real world in nature, and it again provides for consistency in our benchmark results.
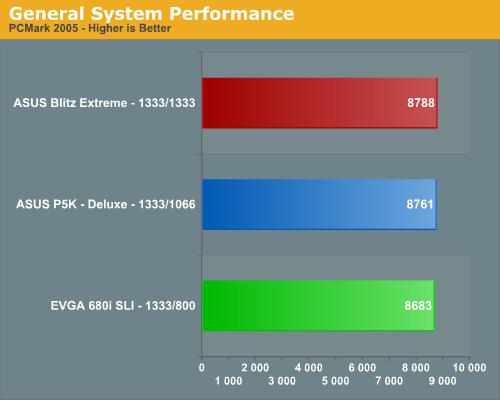
The ASUS boards have always done well in this benchmark due to very strong multitasking performance and the same holds true once again with our EVGA board trailing by only 1%. In the individual tests that make up this benchmark, the Intel chipsets scored the best in the CPU and memory sections while the NVIDIA based board had top honors in the graphics and hard disk tests.
The PC WorldBench 6.0 test suite developed and provided by PCWorld is designed for determining overall system performance for the home office user. This tool provides results for 10 different real world applications that range from Adobe Photoshop to AutoDesk 3ds Max. This benchmark is useful for providing comparative results across a broad array of Graphics, CPU, Hard Disk, and Memory configurations.
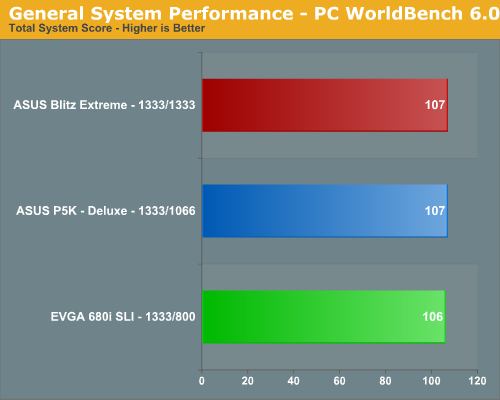
Once again, we see the Intel P35 chipsets scoring just slightly better than the NVIDIA 680i although the difference is absolutely minimal. Within the individual test scores the same pattern holds true with the Intel chipsets taking top honors in the CPU intensive benchmarks and NVIDIA placing first in the graphic and storage system intensive applications. In fact, if it were not for the 15% lower score in the Nero Recode test, we believe the EVGA board would have had the top overall score.
Media Encoding Performance:
Our first series of tests is quite easy - we take our original Office Space DVD and use AnyDVD and Nero Recode 2 to copy the full DVD to the hard drive without compression, thus providing an almost exact duplicate of the DVD. We then fired up Nero Recode 2, selected our Office Space copy on the hard drive, and performed a shrink operation to allow the entire movie along with extras to fit on a single 4.5GB DVD disc. We left all options on their defaults except we checked off the advanced analysis option. The scores reported include the full encoding process and is represented in seconds, with lower numbers providing better performance.
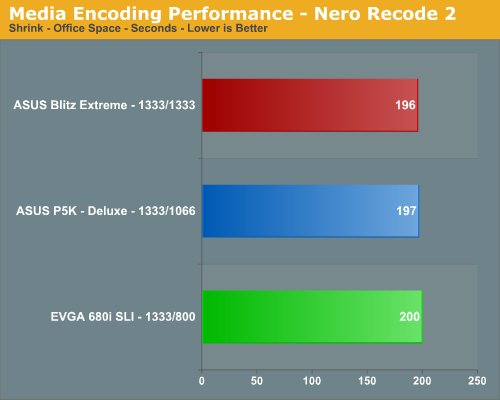
The Nero Recode Shrink results show the improved CPU throughput speeds of the Intel P35 boards resulting in a 2% advantage over the EVGA 680i SLI board.
Rendering Performance:
We are using the Cinebench 9.5 benchmark as it tends to heavily stress the CPU subsystem while performing graphics modeling and rendering. Cinebench 9.5 features two different benchmarks with one test utilizing a single core and the second test showcasing the power of multiple cores in rendering the benchmark image. We utilize the standard multiple core benchmark demo and default settings.
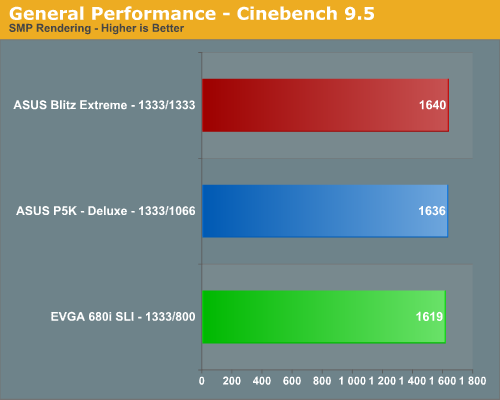
Once again, we notice the advantage of an Intel chipset in a CPU throughput test with the P35 placing 1% ahead of the EVGA 680i SLI board. In the grand scheme of things, this difference and the one in our Nero test is actually very minor.
File Compression Performance:
In order to save space on our hard drives and ensure we had another CPU crunching utility, we will be reporting our file compression results with the latest version of WinRAR that fully supports multithreaded operations and should be of particular interest for those users with dual core or multi-processor systems. Our series of file compression tests utilizes WinRAR 3.62 to compress our test folder that contains 444 files, ten subfolders, and 602MB worth of data. All default settings are utilized in WinRAR along with our hard drive being defragmented before each test.
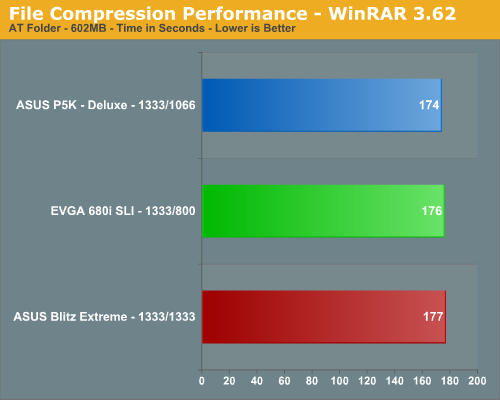
In this test that stresses overall memory latencies and CPU/Memory throughput we see the DDR3 configuration finishing last. The nature of file compression is such that memory is accessed almost constantly in a very random fashion, so page misses requiring additional time as memory banks are swapped is common. The 680i did not perform as bad as we originally thought it would in this test considering its memory speed although latencies are decent.
Gaming Performance:
We ran benchmarks with our standard 1280x1024 resolution with all games set to High Quality mode. Given the number of users that run 19" LCDs these days, 1280x1024 represents one of the most commonly used resolutions and it also ensures our comparisons are not GPU limited.
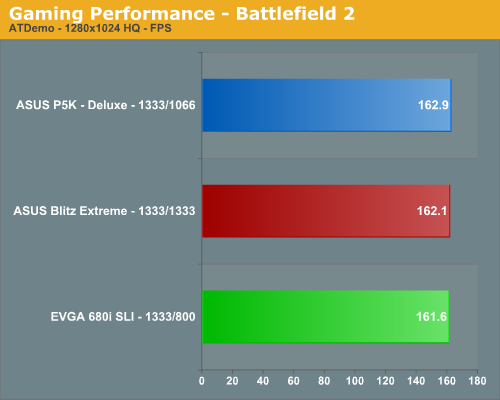
Battlefield 2
This benchmark is performed using DICE's built-in demo playback functionality with additional capture capabilities designed in house. When using the built-in demo playback features of BF2, frames rendered during the loading screen are counted in the benchmark. In order to get a real idea of performance, we use the instantaneous frame time and frames per second data generated from our benchmark run. We discard the data collected during the loading screen and calculate a result that represents actual game play. While DICE maintains that results over 100fps aren't always reliable, our methods have allowed us to get useful data from high performing systems.
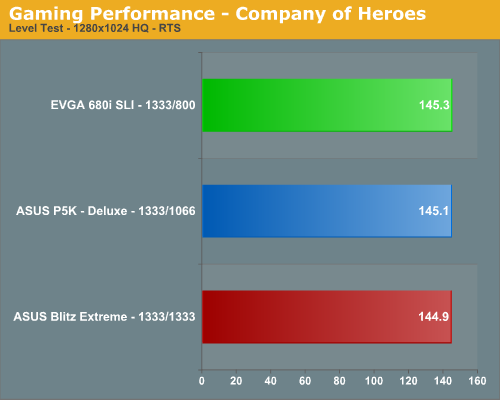
Company of Heroes
Company of Heroes is still proving to be a very addictive RTS game around the office. The game is extremely GPU intensive and also requires a hefty CPU at times. The game contains a built-in performance test that utilizes the game engine to generate several different action scenes. We found the performance test gives a good indication of how well your system will perform throughout the game on average. We have found some of the in-game action sequences to be more demanding than the performance test and are working on game play benchmark that is repeatable. We generally found the game to be enjoyable with an average frame rate above 35fps.
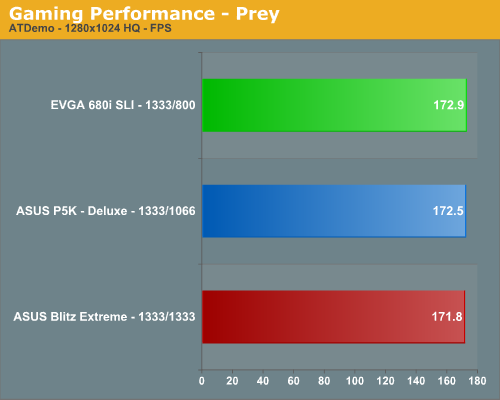
Prey
Prey offers some superb action sequences, unique weapons and characters, and is a visually stunning game at times. It still requires a very good GPU to run it with all of the eye candy turned on. We set all graphic settings to their maximum except for AA/AF and utilize a custom timedemo that takes place during one of the more action oriented sequences. We generally found the game to be enjoyable with an average frame rate above 35fps.
Gaming Summary
The NVIDIA 680i chipset has always been a top performer in gaming and this trends continues in our limited test suite. Although the performance differences between the boards are extremely minor, we see the EVGA 680i taking the top score in two of the benchmarks. This is reversal from previous P35 test results that utilized an AMD HD 2900XT card. Still, gaming performance is driven by the GPU, especially in the latest titles, but every extra bit of performance always helps.
Quick Thoughts:
At first glance, all facts indicate the NVIDIA 680i chipset fully supports the new 1333MHz FSB processors. Dare we say that at times the performance capability of the 680i chipset even excels when utilizing the latest and greatest CPU from Intel? This is in stark contrast to several of our test results when the P35 was first launched and indicates NVIDIA has been busy tweaking the BIOS to gain some additional speed. If only NVIDIA had spent some additional time tweaking their Vista drivers then we would be truly happy - not really, but close enough.
There was nothing really surprising in the initial test results from a historical viewpoint. Both chipsets showed their strengths in certain areas and held on tight in the others. In applications that are GPU or storage system sensitive, the 680i consistently finishes first in most of our benchmarks. It is only in the memory bandwidth, CPU throughput, or latency sensitive applications that we see the Intel P35 chipset pull away, although the differences for both are minimal in nearly all cases.
As far as the new P30 BIOS goes for the EVGA 680i SLI board, there are not any additional settings or features when compared to previous releases. However, official 1333FSB support is present and working properly with a wide range of E6x50 processors that we have tried to date. In fact, the advantages we noticed in lower voltage requirements when overclocking and improved memory throughput with the 1066FSB processors is what impressed us the most about this BIOS. However, not all is perfect in the land of 1333 and that brings us to our concerns about this BIOS.
We had a very difficult time running our memory at settings above DDR2-1000 unless we really relaxed our timings with the QX6850. This did not occur with our E6850 or E6550 processors for the most part - we still had to relax the memory sub-timings compared to the 1066FSB cousins but nothing like we had to do with quad core. We have had some luck running our memory at 1T above DDR2-800 on this board in the past but not this time. We still noticed a couple of "holes" where the straps change, something that is present in all 600i chipsets, but with the QX6850 the frequency and spread seemed worse.
Our 435FSB overclocking result with the QX6850 processor is very good for a 680i based board although we firmly believe it could be better if it were not for the location of the strap changes and memory timing problems. That said, the FSB increases would not be much higher unless additional cooling is present on the MCP/SPP and associated chips around the CPU area. The voltages required to reach the 470+ FSB range with the QX6850 created significant thermal issues with our board when testing 24/7. The heat buildup did not allow us to keep the board at our 8x470FSB setting for more than a few hours during benchmark testing.
We also had problems when setting our memory to Linked and utilizing any sub-setting other than Sync when overclocking the QX6850. The board was not always stable, would not post, or required greatly relaxed timings with the 5:4, 3:2, or even the auto ratio settings once we passed the 385FSB mark. At this time we believe some additional BIOS tuning will solve most of these problems as we have already noticed strap and ratio changes in the latest ASUS, MSI, and Gigabyte BIOS releases that have cured some of their early ills.
Overall, we were pleasantly surprised with the performance of the 680i chipset and the QX6850. In early testing we are seeing very good results with other 600i based boards and have no doubt performance will continue to improve over time. Our advice if you have a 600i based board and want to purchase one of the new 1333FSB based processors is to go for it. Just realize chances are your current 1066FSB Core 2 Duo will probably already run at 1333FSB without too much trouble, so the more likely reason to upgrade CPUs is if you're looking at moving to quad core. Even then, we'd likely stick with the Q6600, especially next week when the new prices kick in.


