Original Link: https://www.anandtech.com/show/2829
The SSD Relapse: Understanding and Choosing the Best SSD
by Anand Lal Shimpi on August 30, 2009 12:00 AM EST- Posted in
- Storage
One Tough Act to Follow
What have I gotten myself into? The SSD Anthology I wrote back in March was read over 2 million times. Microsoft linked it, Wikipedia linked it, my esteemed colleagues in the press linked it, Linus freakin Torvalds linked it.
The Anthology took me six months to piece together; I wrote and re-wrote parts of that article more times than I'd care to admit. And today I'm charged with the task of producing its successor. I can't do it.
The article that started all of this was the Intel X25-M review. Intel gave me gold with that drive; the article wrote itself, the X25-M was awesome, everything else in the market was crap.
Intel's X25-M SSDs: The drives that started a revolution
The Anthology all began with a spark: the SSD performance degradation issue. It took a while to put together, but the concept and the article were handed to me on a silver platter: just use an SSD for a while and you’ll spot the issue. I just had to do the testing and writing.
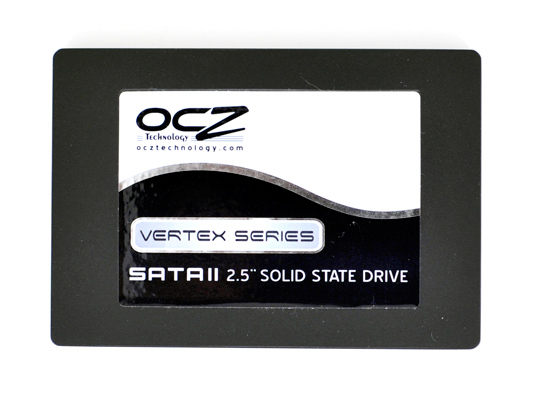
OCZ's Vertex: The first Indilinx drive I reviewed, the drive that gave us hope there might be another.
But today, as I write this, the words just aren't coming to me. The material is all there, but it just seems so mature and at the same time, so clouded and so done. We've found the undiscovered country, we've left no stone unturned, everyone knows how these things work - now SSD reviews join the rest as a bunch of graphs and analysis, hopefully with witty commentary in between.
It's a daunting, no, deflating task to write what I view as the third part in this trilogy of articles. JMicron is all but gone from the market for now, Indilinx came and improved (a lot) and TRIM is nearly upon us. Plus, we all know how trilogies turn out. Here's hoping that this one doesn't have Ewoks in it.
What Goes Around, Comes Around
No we're not going back to the stuttering crap that shipped for months before Intel released their X25-M last year, but we are going back in the way we have to look at SSD performance.
In my X25-M review the focus was on why the mainstream drives at the time stuttered and why the X25-M didn't. Performance degradation over time didn't matter because all of the SSDs on the market were slow out of the box; and as I later showed, the pre-Intel MLC SSDs didn’t perform worse over time, they sucked all of the time.
Samsung and Indilinx emerged with high performance, non-stuttering alternatives, and then we once again had to thin the herd. Simply not stuttering wasn't enough, a good SSD had to maintain a reasonable amount of performance over the life of the drive.
The falling performance was actually a side effect of the way NAND flash works. You write in pages (4KB) but you can only erase in blocks (128 pages or 512KB); thus SSDs don't erase data when you delete it, only when they run out of space to write internally. When that time comes, you run into a nasty situation called the read-modify-write. Here, even to just write 4KB, the controller must read an entire block (512KB), update the single page, and write the entire block back out. Instead of writing 4KB, the controller has to actually write 512KB - a much slower operation.
I simulated this worst case scenario performance by writing to every single page on the SSDs I tested before running any tests. The performance degradation ranged from negligible to significant:
| PCMark Vantage HDD Score | New | "Used" |
| Corsair P256 (Samsung MLC) | 26607 | 18786 |
| OCZ Vertex Turbo (Indilinx MLC) | 26157 | 25035 |
So that's how I approached today's article. Filling the latest generations of Indilinx, Intel and Samsung drives before testing them. But, my friends, things have changed.
The table below shows the performance of the same drives showcased above, but after running the TRIM instruction (or a close equivalent) against their contents:
| PCMark Vantage HDD Score | New | "Used" | After TRIM/Idle GC | % of New Perf |
| Corsair P256 (Samsung MLC) | 26607 | 18786 | 24317 | 91% |
| OCZ Vertex Turbo (Indilinx MLC) | 26157 | 25035 | 26038 | 99.5% |
Oh boy. I need a new way to test.
A Quick Flash Refresher
DRAM is very fast. Writes happen in nanoseconds as do CPU clock cycles, those two get along very well. The problem with DRAM is that it's volatile storage; if the charge stored in each DRAM cell isn't refreshed, it's lost. Pull the plug and whatever you stored in DRAM will eventually disappear (and unlike most other changes, eventually happens in fractions of a second).
Magnetic storage, on the other hand, is not very fast. It's faster than writing trillions of numbers down on paper, but compared to DRAM it plain sucks. For starters, magnetic disk storage is mechanical - things have to physically move to read and write. Now it's impressive how fast these things can move and how accurate and relatively reliable they are given their complexity, but to a CPU, they are slow.
The fastest consumer hard drives take 7 milliseconds to read data off of a platter. The fastest consumer CPUs can do something with that data in one hundred thousandth that time.
The only reason we put up with mechanical storage (HDDs) is because they are cheap, store tons of data and are non-volatile: the data is still there even when you turn em off.
NAND flash gives us the best of both worlds. They are effectively non-volatile (flash cells can lose their charge but after about a decade) and relatively fast (data accesses take microseconds, not milliseconds). Through electron tunneling a charge is inserted into an N-channel MOSFET. Once the charge is in there, it's there for good - no refreshing necessary.
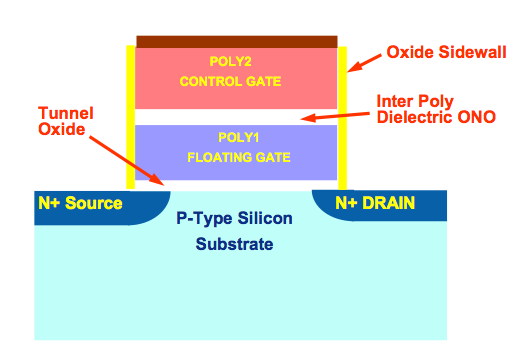
N-Channel MOSFET. One per bit in a NAND flash chip.
One MOSFET is good for one bit. Group billions of these MOSFETs together, in silicon, and you've got a multi-gigabyte NAND flash chip.
The MOSFETs are organized into lines, and the lines into groups called pages. These days a page is usually 4KB in size. NAND flash can't be written to one bit at a time, it's written at the page level - so 4KB at a time. Once you write the data though, it's there for good. Erasing is a bit more complicated.
To coax the charge out of the MOSFETs requires a bit more effort and the way NAND flash works is that you can't discharge a single MOSFET, you have to erase in larger groups called blocks. NAND blocks are commonly 128 pages, that means if you want to re-write a page in flash you have to first erase it and all 127 adjacent pages first. And allow me to repeat myself: if you want to overwrite 4KB of data from a full block, you need to erase and re-write 512KB of data.
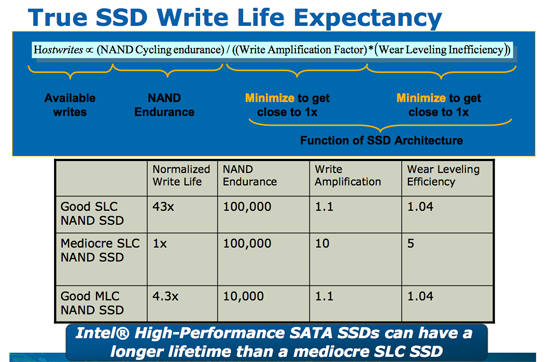
To make matters worse, every time you write to a flash page you reduce its lifespan. The JEDEC spec for MLC (multi-level cell) flash is 10,000 writes before the flash can start to fail.
Dealing with all of these issues requires that controllers get very crafty with how they manage writes. A good controller must split writes up among as many flash channels as possible, while avoiding writing to the same pages over and over again. It must also deal with the fact that some data is going to get frequently updated while others will remain stagnant for days, weeks, months or even years. It has to detect all of this and organize the drive in real time without knowing anything about how it is you're using your computer.
It's a tough job.
But not impossible.
Live Long and Prosper: The Logical Page
Computers are all about abstraction. In the early days of computing you had to write assembly code to get your hardware to do anything. Programming languages like C and C++ created a layer of abstraction between the programmer and the hardware, simplifying the development process. The key word there is simplification. You can be more efficient writing directly for the hardware, but it’s far simpler (and much more manageable) to write high level code and let a compiler optimize it.
The same principles apply within SSDs.
The smallest writable location in NAND flash is a page; that doesn’t mean that it’s the largest size a controller can choose to write. Today I’d like to introduce the concept of a logical page, an abstraction of a physical page in NAND flash.
Confused? Let’s start with a (hopefully, I'm no artist) helpful diagram:
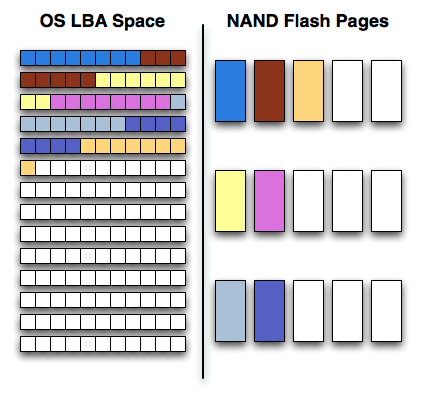
On one side of the fence we have how the software views storage: as a long list of logical block addresses. It’s a bit more complicated than that since a traditional hard drive is faster at certain LBAs than others but to keep things simple we’ll ignore that.
On the other side we have how NAND flash stores data, in groups of cells called pages. These days a 4KB page size is common.
In reality there’s no fence that separates the two, rather a lot of logic, several busses and eventually the SSD controller. The latter determines how the LBAs map to the NAND flash pages.
The most straightforward way for the controller to write to flash is by writing in pages. In that case the logical page size would equal the physical page size.
Unfortunately, there’s a huge downside to this approach: tracking overhead. If your logical page size is 4KB then an 80GB drive will have no less than twenty million logical pages to keep track of (20,971,520 to be exact). You need a fast controller to sort through and deal with that many pages, a lot of storage to keep tables in and larger caches/buffers.
The benefit of this approach however is very high 4KB write performance. If the majority of your writes are 4KB in size, this approach will yield the best performance.
If you don’t have the expertise, time or support structure to make a big honkin controller that can handle page level mapping, you go to a larger logical page size. One such example would involve making your logical page equal to an erase block (128 x 4KB pages). This significantly reduces the number of pages you need to track and optimize around; instead of 20.9 million entries, you now have approximately 163 thousand. All of your controller’s internal structures shrink in size and you don’t need as powerful of a microprocessor inside the controller.
The benefit of this approach is very high large file sequential write performance. If you’re streaming large chunks of data, having big logical pages will be optimal. You’ll find that most flash controllers that come from the digital camera space are optimized for this sort of access pattern where you’re writing 2MB - 12MB images all the time.
Unfortunately, the sequential write performance comes at the expense of poor small file write speed. Remember that writing to MLC NAND flash already takes 3x as long as reading, but writing small files when your controller needs large ones worsens the penalty. If you want to write an 8KB file, the controller will need to write 512KB (in this case) of data since that’s the smallest size it knows to write. Write amplification goes up considerably.
Remember the first OCZ Vertex drive based on the Indilinx Barefoot controller? Its logical page size was equal to a 512KB block. OCZ asked for a firmware that enabled page level mapping and Indilinx responded. The result was much improved 4KB write performance:
| Iometer 4KB Random Writes, IOqueue=1, 8GB sector space | Logical Block Size = 128 pages | Logical Block Size = 1 Page |
| Pre-Release OCZ Vertex | 0.08 MB/s | 8.2 MB/s |
The Cleaning Lady and Write Amplification
Imagine you’re running a cafeteria. This is the real world and your cafeteria has a finite number of plates, say 200 for the entire cafeteria. Your cafeteria is open for dinner and over the course of the night you may serve a total of 1000 people. The number of guests outnumbers the total number of plates 5-to-1, thankfully they don’t all eat at once.
You’ve got a dishwasher who cleans the dirty dishes as the tables are bussed and then puts them in a pile of clean dishes for the servers to use as new diners arrive.
Pretty basic, right? That’s how an SSD works.
Remember the rules: you can read from and write to pages, but you must erase entire blocks at a time. If a block is full of invalid pages (files that have been overwritten at the file system level for example), it must be erased before it can be written to.
All SSDs have a dishwasher of sorts, except instead of cleaning dishes, its job is to clean NAND blocks and prep them for use. The cleaning algorithms don’t really kick in when the drive is new, but put a few days, weeks or months of use on the drive and cleaning will become a regular part of its routine.
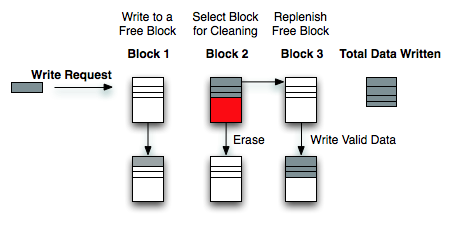
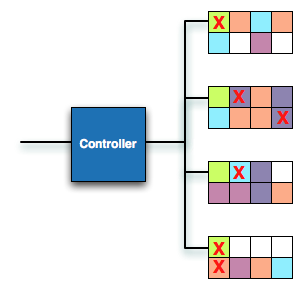
Remember this picture?
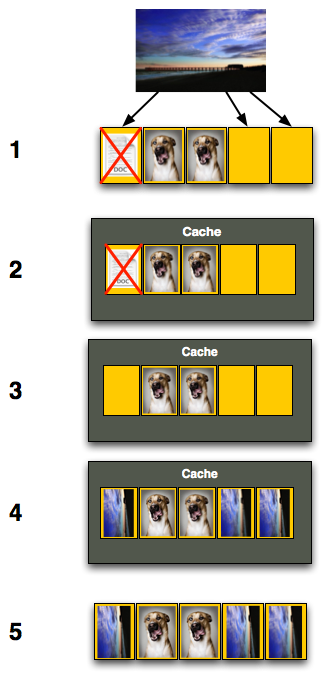
It (roughly) describes what happens when you go to write a page of data to a block that’s full of both valid and invalid pages.
In actuality the write happens more like this. A new block is allocated, valid data is copied to the new block (including the data you wish to write), the old block is sent for cleaning and emerges completely wiped. The old block is added to the pool of empty blocks. As the controller needs them, blocks are pulled from this pool, used, and the old blocks are recycled in here.
IBM's Zurich Research Laboratory actually made a wonderful diagram of how this works, but it's a bit more complicated than I need it to be for my example here today so I've remade the diagram and simplified it a bit:
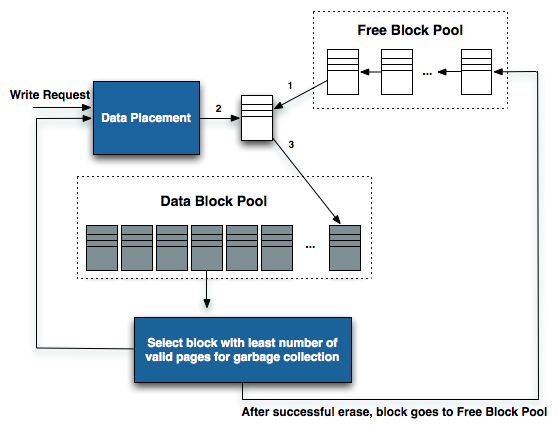
The diagram explains what I just outlined above. A write request comes in, a new block is allocated and used then added to the list of used blocks. The blocks with the least amount of valid data (or the most invalid data) are scheduled for garbage collection, cleaned and added to the free block pool.
We can actually see this in action if we look at write latencies:
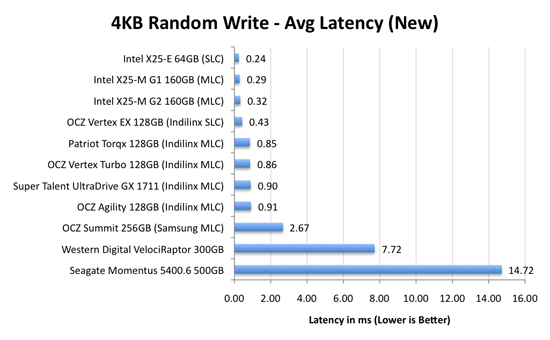
Average write latencies for writing to an SSD, even with random data, are extremely low. But take a look at the max latencies:
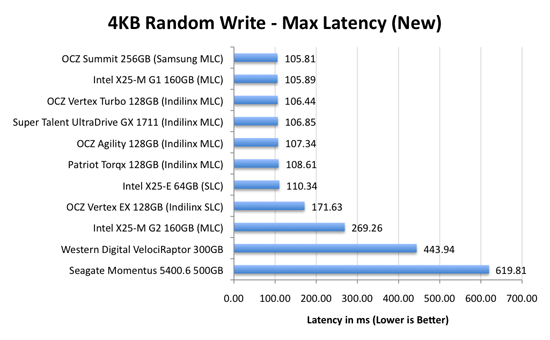
While average latencies are very low, the max latencies are around 350x higher. They are still low compared to a mechanical hard disk, but what's going on to make the max latency so high? All of the cleaning and reorganization I've been talking about. It rarely makes a noticeable impact on performance (hence the ultra low average latencies), but this is an example of happening.
And this is where write amplification comes in.
In the diagram above we see another angle on what happens when a write comes in. A free block is used (when available) for the incoming write. That's not the only write that happens however, eventually you have to perform some garbage collection so you don't run out of free blocks. The block with the most invalid data is selected for cleaning; its data is copied to another block, after which the previous block is erased and added to the free block pool. In the diagram above you'll see the size of our write request on the left, but on the very right you'll see how much data was actually written when you take into account garbage collection. This inequality is called write amplification.
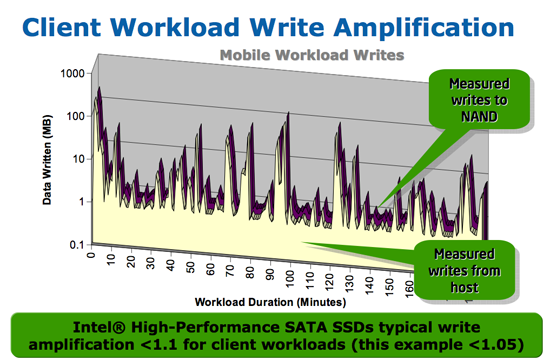
Intel claims very low write amplification on its drives, although over the lifespan of your drive a < 1.1 factor seems highly unlikely
The write amplification factor is the amount of data the SSD controller has to write in relation to the amount of data that the host controller wants to write. A write amplification factor of 1 is perfect, it means you wanted to write 1MB and the SSD’s controller wrote 1MB. A write amplification factor greater than 1 isn't desirable, but an unfortunate fact of life. The higher your write amplification, the quicker your drive will die and the lower its performance will be. Write amplification, bad.
Why SSDs Care About What You Write: Fragmentation & Write Combining
PC Perspective's Allyn Malventano is a smart dude, just read one of his articles to figure that out. He pieced together a big aspect of how the X25-M worked on his own, a major key to how to improve SSD performance.
You'll remember from the Anthology that SSDs get their high performance by being able to write to multiple flash die across multiple channels in parallel. This works very well for very large files since you can easily split the reads and writes across multiple die/channels.
Here we go to write a 128KB file, it's split up and written across multiple channels in our tiny mock SSD:
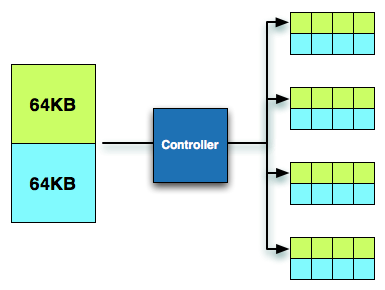
When we go to read the file, it's read across multiple channels and performance is once again, excellent.
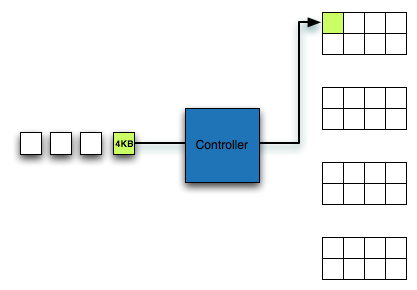
Remember what we talked about before however: small file random read/write performance is actually what ends up being slowest on hard drives. It's what often happens on a PC and thus we run into a problem when performing such an IO. Here we go to write a 4KB file. The smallest size we can write is 4KB and thus it's not split up at all, it can only be written to a single channel:
As Alyn discovered, Intel and other manufacturers get around this issue by combining small writes into larger groups. Random writes rarely happen in a separated manner, they come in bursts with many at a time. A write combining controller will take a group of 4KB writes, arrange them in parallel, and then write them together at the same time.
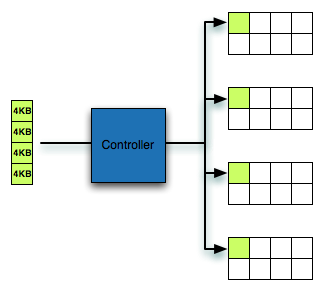
This does wonders for improving random small file write performance, as everything completes as fast as a larger sequential write would. What it hurts is what happens when you overwrite data.
In the first example where we wrote a 128KB file, look what happens if we delete the file:
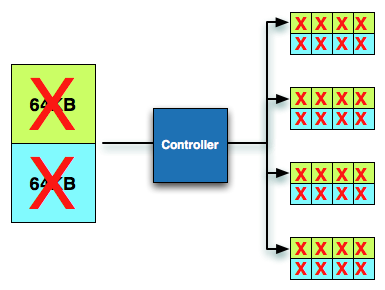
Entire blocks are invalidated. Every single LBA in these blocks will come back invalid and can quickly be cleaned.
Look at what happens in the second example. These 4KB fragments are unrelated, so when one is overwritten, the rest aren't. A few deletes and now we're left with this sort of a situation:
Ugh. These fragmented blocks are a pain to deal with. Try to write to it now and you have to do a read-modify-write. Without TRIM support, nearly every write to these blocks will require a read-modify-write and send write amplification through the roof. This is the downside of write combining.
Intel's controller does its best to recover from these situations. That's why its used random write performance is still very good. Samsung's controller isn't very good at recovering from these situations.
Now you can see why performing a sequential write over the span of the drive fixes a fragmented drive. It turns the overly fragmented case into one that's easy to deal with, hooray. You can also see why SSD degradation happens over time. You don't spend all day writing large sequential files to your disk. Instead you write a combination of random and sequential, large and small files to the disk.
A Wear Leveling Refresher: How Long Will My SSD Last?
As if everything I’ve talked about thus far wasn’t enough to deal with, there’s one more major issue that directly impacts the performance of these drives: wear leveling.
Each MLC NAND cell can be erased ~10,000 times before it stops reliably holding charge. You can switch to SLC flash and up that figure to 100,000, but your cost just went up 2x. For these drives to succeed in the consumer space and do it quickly, it must be using MLC flash.
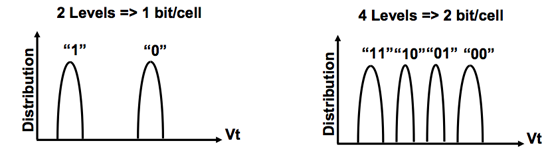
SLC (left) vs. MLC (right) flash
Ten thousand erase/write cycles isn’t much, yet SSD makers are guaranteeing their drives for anywhere from 1 - 10 years. On top of that, SSD makers across the board are calling their drives more reliable than conventional hard drives.
The only way any of this is possible is by some clever algorithms and banking on the fact that desktop users don’t do a whole lot of writing to their drives.
Think about your primary hard drive. How often do you fill it to capacity, erase and start over again? Intel estimates that even if you wrote 20GB of data to your drive per day, its X25-M would be able to last you at least 5 years. Realistically, that’s a value far higher than you’ll use consistently.
My personal desktop saw about 100GB worth of writes (whether from the OS or elsewhere) to my SSD and my data drive over the past 14 days. That’s a bit over 7GB per day of writes. Let’s do some basic math:
| My SSD | |
| NAND Flash Capacity | 256 GB |
| Formatted Capacity in the OS | 238.15 GB |
| Available Space After OS and Apps | 185.55 GB |
| Spare Area | 17.85 GB |
If I never install another application and just go about my business, my drive has 203.4GB of space to spread out those 7GB of writes per day. That means in roughly 29 days my SSD, if it wear levels perfectly, I will have written to every single available flash block on my drive. Tack on another 7 days if the drive is smart enough to move my static data around to wear level even more properly. So we’re at approximately 36 days before I exhaust one out of my ~10,000 write cycles. Multiply that out and it would take 360,000 days of using my machine the way I have been for the past two weeks for all of my NAND to wear out; once again, assuming perfect wear leveling. That’s 986 years. Your NAND flash cells will actually lose their charge well before that time comes, in about 10 years.
This assumes a perfectly wear leveled drive, but as you can already guess - that’s not exactly possible.
Write amplification ensures that while my OS may be writing 7GB per day to my drive, the drive itself is writing more than 7GB to its flash. Remember, writing to a full block will require a read-modify-write. Worst case scenario, I go to write 4KB and my SSD controller has to read 512KB, modify 4KB, write 512KB and erase a whole block. While I should’ve only taken up one write cycle for 2048 MLC NAND flash cells, I will have instead knocked off a single write cycle for 262,144 cells.
You can optimize strictly for wear leveling, but that comes at the expense of performance.
Understanding Spare Area (or Why My 80GB Drive Appears as 74.5GB)
Intel's 80GB X25-M has 80GB of NAND flash on it. That's 85,899,345,920 bytes or 80 x 1024^3 bytes (1024 bytes in a kilobyte x 1024 kilobytes in a megabyte x 1024 megabytes in a gigabyte x 80 gigabytes).
Hard drive makers however assume that 80GB means 80,000,000,000 bytes, since they use the definition of 1GB = 1,000,000,000 bytes. SSD vendors thus use the same definition. Now 80,000,000,000 bytes actually equals 74.5GB, so that's all the space you get to use on the drive.
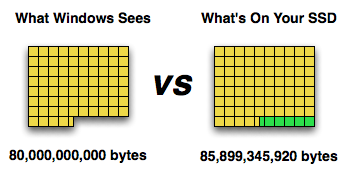
How much space is there really on the drive? 80GB. How much space does Windows let you use? 74.5GB. What happens to the remaining 5.5GB? It's used by the drive's controller as spare area.
Intel’s controller is dynamic, it uses the entire drive as spare area until you’ve written every LBA once. Then it relies on the remaining 7.5% of non-user-space as its scratch pad. That’s why its new, out of box, performance is so good.
Other controllers may not be quite as dynamic, but they may also take a smaller performance hit when fully used. Why would Intel work so hard to make its out of box performance so high, even when it’ll be short lived? Because of TRIM.
The Instruction That Changes (almost) Everything: TRIM
TRIM is an interesting command. It lets the SSD prioritize blocks for cleaning. In the example I used before, a block is cleaned only when the drive runs out of places to write things and has to dip into its spare area. With TRIM, if you delete a file, the OS sends a TRIM command to the drive along with the associated LBAs that are no longer needed. The TRIM command tells the drive that it can schedule those blocks for cleaning and add them to the pool of replacement blocks.
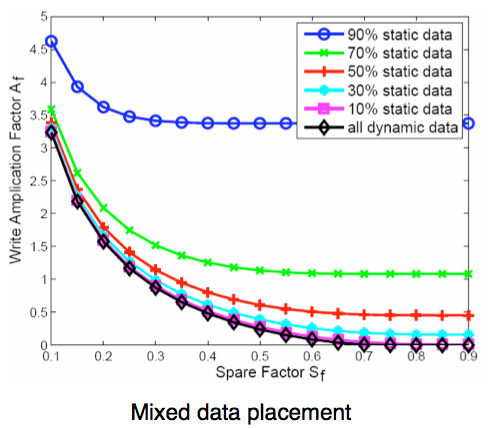
A used SSD will only have its spare area to use as a scratch pad for moving data around; on most consumer drives that’s around 7%. Take a look at this graph from a study IBM did on SSD performance:
Write Amplification vs. Spare Area, courtesy of IBM Zurich Research Laboratory
Note how dramatically write amplification goes down when you increase the percentage of spare area the drive has. In order to get down to a write amplification factor of 1 our spare area needs to be somewhere in the 10 - 30% range, depending on how much of the data on our drive is static.
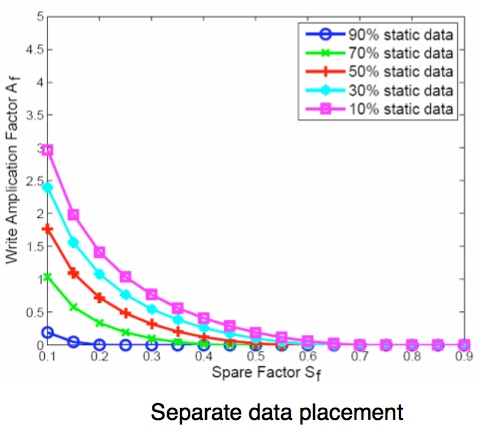
Remember our pool of replacement blocks? This graph actually assumes that we have multiple pools of replacement blocks. One for frequently changing data (e.g. file tables, pagefile, other random writes) and one for static data (e.g. installed applications, data). If the SSD controller only implements a single pool of replacement blocks, the spare area requirements are much higher:
Write Amplification vs. Spare Area, courtesy of IBM Zurich Research Laboratory
We’re looking at a minimum of 30% spare area for this simpler algorithm. Some models don’t even drop down to 1.0x write amplification.
But remember, today’s consumer drives only ship with roughly 6 - 7% spare area on them. That’s under the 10% minimum even from our more sophisticated controller example. By comparison, the enterprise SSDs like Intel’s X25-E ship with more spare area - in this case 20%.
What TRIM does is help give well architected controllers like that in the X25-M more spare area. Space you’re not using on the drive, space that has been TRIMed, can now be used in the pool of replacement blocks. And as IBM’s study shows, that can go a long way to improving performance depending on your workload.
Tying it All Together: SSD Performance Degradation
More spare area is better for random workloads, but desktop workloads aren’t random enough to justify setting aside more spare area to improve performance; most reviews don’t test in a used state, and more users would simply flock to lower price-per-GB drives with less spare area.
Drives that drop the most in performance from new to used state have the most to gain from the TRIM instruction. Depending on how you use your drive of course:
| % Performance Drop in Used State vs. New State | |||
| 4KB Random Write | 2MB Sequential Write | PCMark Vantage HDD Suite | |
| Intel X25-E 64GB (SLC) | 26.1% | 5.4% | 9.7% |
| Intel X25-M G1 160GB (MLC) | 35.5% | 3.8% | 16.7% |
| Intel X25-M G2 160GB (MLC) | 0.7% | 2.2% | 15.3% |
| OCZ Agility 128GB (Indilinx MLC) | 44.8% | 15.0% | 4.4% |
| OCZ Summit 256GB (Samsung MLC) | 72.4% | 3.0% | 23.6% |
| OCZ Vertex EX 128GB (Indilinx SLC) | 60.5% | 20.8% | 0.8% |
| OCZ Vertex Turbo 128GB (Indilinx MLC) | 44.0% | 15.4% | 4.5% |
| Patriot Torqx 128GB (Indilinx MLC) | 44.6% | 15.6% | 3.5% |
Depending on the scenario, all three controllers have a lot to gain from TRIM. Random write performance drops significantly for almost every single drive. The worst is the Samsung RBB controller, which lost over 70% of its performance between new and used states; Samsung needs TRIM.
Intel made some significant improvements going from the G1 to G2 drives, the new drive loses no performance in our random write test. This is thanks to firmware tweaks and having twice as much DRAM to track data in; the more data the Intel drive can keep track of, the better it is at organization, management and garbage collection. From a pure performance standpoint, the G2 might actually be better for server workloads than the X25-E. In terms of lifespan however, the X25-E has the G2 beat.
Only the Indilinx drives lose an appreciable amount of performance in the sequential write test, but they are the only drives to not lose any performance in the more real-world PCMark Vantage HDD suite. Although not displayed here, the overall PCMark Vantage score takes an even smaller hit on Indilinx drives. This could mean that in the real world, Indilinx drives stand to gain the least from TRIM support. This is possibly due to Indilinx using a largely static LBA mapping scheme; the only spare area is then the 6.25% outside of user space regardless of how used the drive is.
Both Samsung and Intel have a lot to gain from TRIM. Samsung’s performances goes from utterly unacceptable to reasonable (but not price justified) with TRIM. Intel’s performance goes from class-leading to more, er, class-leading.
Used vs. New Performance: Revisited
Nearly all good SSDs perform le sweet when brand new. None of the blocks have any data in them, each write is performed at full speed, all is bueno. Over time, your drive gets written to, all blocks get occupied with data (both valid and invalid) and now every time you write to the SSD its controller has to do that painful read modify write and cleaning.
In the Anthology I simulated this worst used case by first filling the drive with data, deleting the partition, then installing the OS and running my benchmarks. This worked very well because it filled every single flash block with data. The OS installation and actual testing added a few sprinkles of randomness that helped make the scenario even more strenuous, which I liked.
The problem here is that if a drive properly supports TRIM, the act of formatting the drive will erase all of the wonderful used data I purposefully filled the drive with. My “used” case on a drive supporting TRIM will now just be like testing a drive in a brand new state.
To prove this point I provide you with an example of what happens when you take a drive supporting TRIM, fill it with data and then format the drive:
| SuperTalent UltraDrive GX 1711 | 4KB Random Write IOPS |
| Clean Drive | 13.1 MB/s |
| Used Drive | 6.93 MB/s |
| Used Drive After TRIM | 12.9 MB/s |
Oh look, performance doesn’t really change. The cleaning process takes longer now but other than that, the performance is the same.
So, I need a new way to test. It’s a shame because I’m particularly attached to the old way I tested, mostly because it provides a very stressful situation for the drives to deal with. After all, I don’t want to fool anyone into thinking a drive is faster than it is.
Once TRIM is enabled on all drives, the way I will test is by filling a drive after it’s been graced with an OS. I will fill it with both valid and invalid data, delete the invalid data and measure performance. This will measure how well the drive performs closer to capacity as well as how well it can TRIM data.
Unfortunately, no drives properly support TRIM yet. The beta Indilinx firmware with TRIM support works well, unless you put your system to sleep. Then there’s a chance you might lose your data. Woops. There’s also the problem with Intel’s Matrix Storage Manager not passing TRIM to your drives. All of this will get fixed before the end of the year, but it’s just a bit too early to get TRIM happy.
What we get today is the first stage of migrating the way we test. In order to simulate a real user environment I take a freshly secure erased drive, install Windows 7 x64 on it (no cloning, full install this time), then install drivers/apps, then fill the remaining space on the drive and delete it. This fills the drive with invalid data that the drive must keep track of and juggle, much like what you'd see by simply using your system.
I’m using the latest IMSM driver so TRIM doesn’t get passed to the drives; I’m such a jerk to these poor SSDs.
I’ll start look at both new and used performance on the coming pages. Once TRIM gets here in full force I’ll just start using it and we won't have to worry about looking at new vs. used performance.
The Test
| CPU | Intel Core i7 965 running at 3.2GHz (Turbo & EIST Disabled) |
| Motherboard: | Intel DX58SO (Intel X58) |
| Chipset: | Intel X58 |
| Chipset Drivers: | Intel 9.1.1.1015 + Intel IMSM 8.9 |
| Memory: | Qimonda DDR3-1066 4 x 1GB (7-7-7-20) |
| Video Card: | eVGA GeForce GTX 285 |
| Video Drivers: | NVIDIA ForceWare 190.38 64-bit |
| Desktop Resolution: | 1920 x 1200 |
| OS: | Windows 7 x64 |
Intel's X25-M 34nm vs 50nm: Not as Straight Forward As You'd Think
It took me a while to understand exactly what Intel did with its latest drive, mostly because there are no docs publicly available on either the flash used in the drives or on the controller itself. Intel is always purposefully vague about important details, leaving everything up to clever phrasing of questions and guesswork with tests and numbers before you truly uncover what's going on. But after weeks with the drive, I think I've got it.
| X25-M Gen 1 | X25-M Gen 2 | |
| Flash Manufacturing Process | 50nm | 34nm |
| Flash Read Latency | 85 µs | 65 µs |
| Flash Write Latency | 115 µs | 85 µs |
| Random 4KB Reads | Up to 35K IOPS | Up to 35K IOPS |
| Random 4KB Writes | Up to 3.3K IOPS | Up to 6.6K IOPS (80GB) Up to 8.6K IOPS (160GB) |
| Sequential Read | Up to 250MB/s | Up to 250MB/s |
| Sequential Write | Up to 70MB/s | Up to 70MB/s |
| Halogen-free | No | Yes |
| Introductory Price | $345 (80GB) $600 - $700 (160GB) | $225 (80GB) $440 (160GB) |
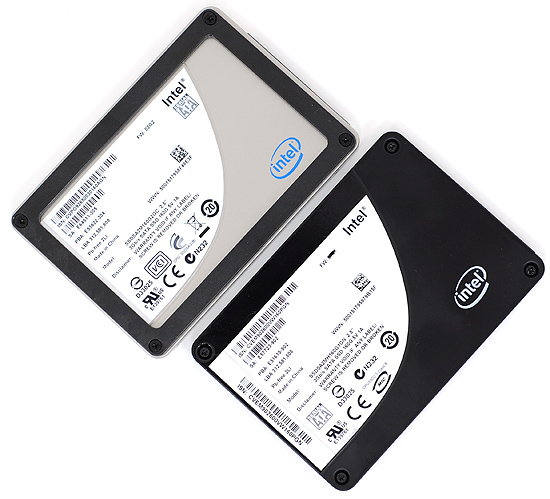
The old X25-M G1
The new X25-M G2
Moving to 34nm flash let Intel drive the price of the X25-M to ultra competitive levels. It also gave Intel the opportunity to tune controller performance a bit. The architecture of the controller hasn't changed, but it is technically a different piece of silicon (that happens to be Halogen-free). What has changed is the firmware itself.
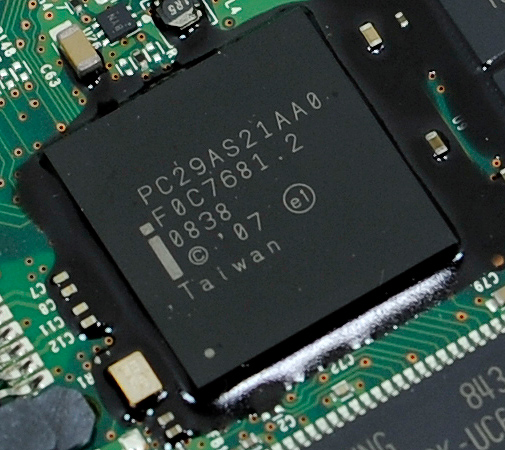
The old controller
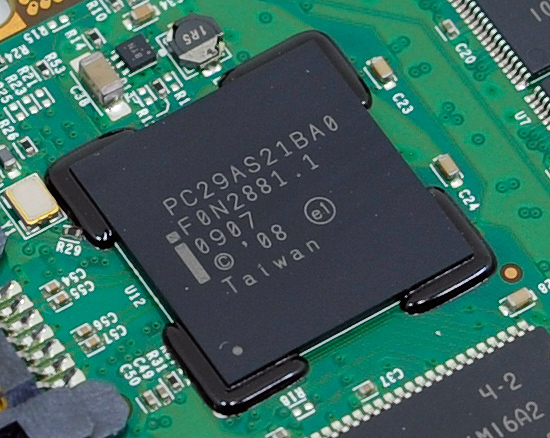
The new controller
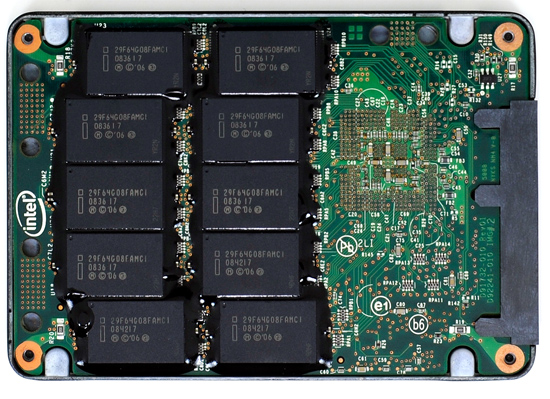
The new X25-M G2 has twice as much DRAM on-board as the previous drive. The old 160GB drive used a 16MB Samsung 166MHz SDRAM (CAS3):
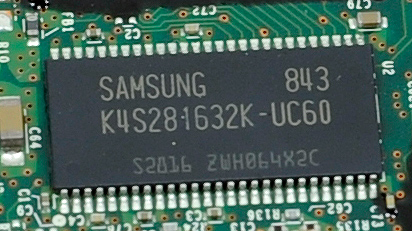
Goodbye Samsung
The new 160GB G2 drive uses a 32MB Micron 133MHz SDRAM (CAS3):
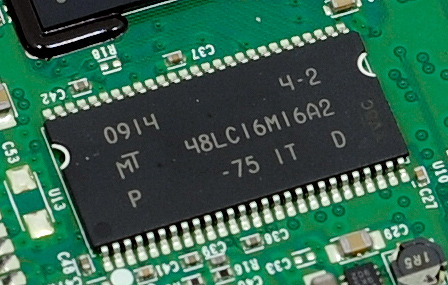
Hello Micron
More memory means that the drive can track more data and do a better job of keeping itself defragmented and well organized. We see this reflected in the "used" 4KB random write performance, which is around 50% higher than the previous drive.
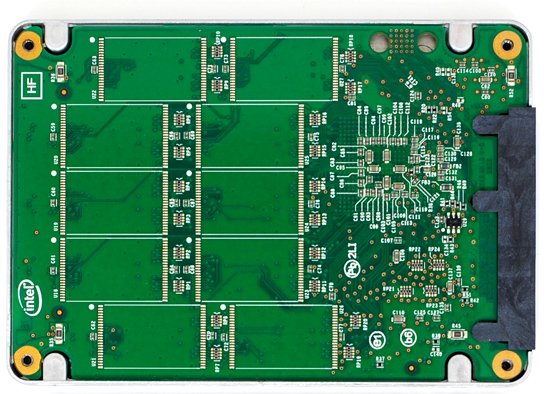
Intel is now using 16GB flash packages instead of 8GB packages from the original drive. Once 34nm production really ramps up, Intel could outfit the back of the PCB with 10 more chips and deliver a 320GB drive. I wouldn't expect that anytime soon though.
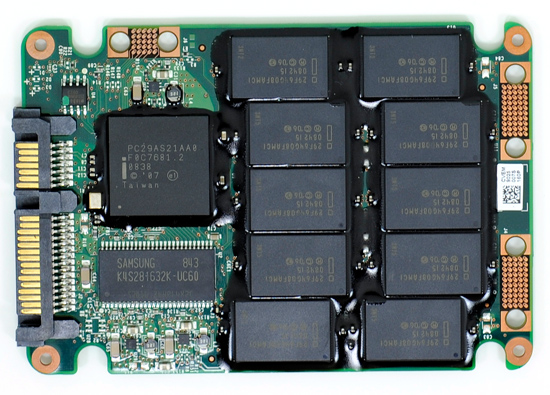
The old X25-M G1
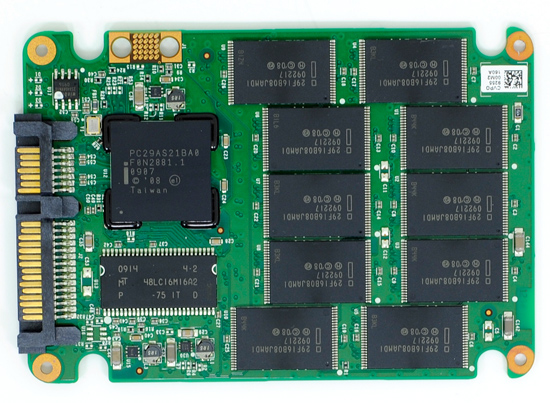
The new X25-M G2
Low level performance of the new drive ranges from no improvement to significant depending on the test:
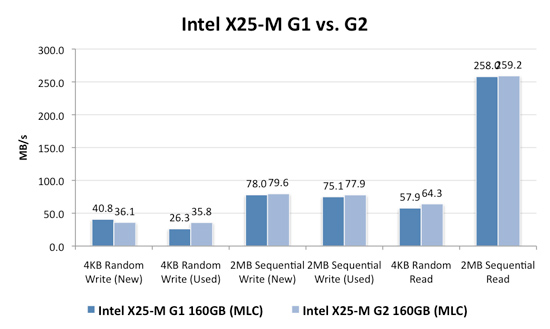
Note that these results are a bit different than my initial preview. I'm using the latest build of Iometer this time around, instead of the latest version from iometer.org. It does a better job filling the drives and produces more reliable test data in general.
The trend however is clear: the new G2 drive isn't that much faster. In fact, the G2 is slower than the G1 in my 4KB random write test when the drive is brand new. The benefit however is that the G2 doesn't drop in performance when used...at all. Yep, you read that right. In the most strenuous case for any SSD, the new G2 doesn't even break a sweat. That's...just...awesome.
The rest of the numbers are pretty much even, with the exception of 4KB random reads where the G2 is roughly 11% faster.
I continue to turn to PCMark Vantage as the closest indication to real world performance I can get for these SSDs, and it echoes my earlier sentiments:
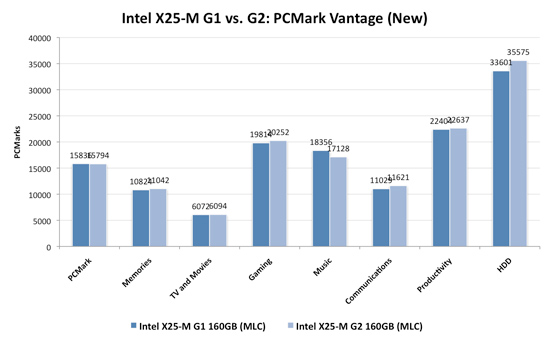
When brand new, the G1 and the G2 are very close in performance. There are some tests where the G2 is faster, others where the G1 is faster. The HDD suite shows the true potential of the G2 and even there we're only looking at a 5.6% performance gain.
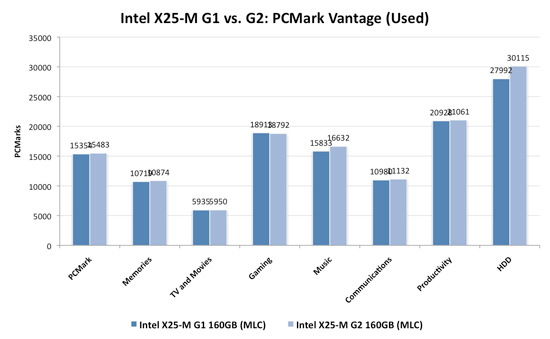
It's in the used state that we see the G2 pull ahead a bit more, but still not drastic. The advantage in the HDD suite is around 7.5%, but the rest of the tests are very close. Obviously the major draw to the 34nm drives is their price, but that can't be all there is to it...can it?
The new drives come with TRIM support, albeit not out of the box. Sometime in Q4 of this year, Intel will offer a downloadable firmware that enables TRIM on only the 34nm drives. TRIM on these drives will perform much like TRIM does on the OCZ drives using Indilinx' manual TRIM tool - in other words, restoring performance to almost new.
Because it can more or less rely on being able to TRIM invalid data, the G2 firmware is noticeably different from what's used in the G1. In fact, if we slightly modify the way I tested in the Anthology I can actually get the G1 to outperform the G2 even in PCMark Vantage. In the Anthology, to test the used state of a drive I would first fill the drive then restore my test image onto it. The restore process helped to fragment the drive and make sure the spare-area got some use as well. If we take the same approach but instead of imaging the drive we perform a clean Windows install on it, we end up with a much more fragmented state; it's not a situation you should ever encounter since a fresh install of Windows should be performed on a clean, secure erased drive, but it does give me an excellent way to show exactly what I'm talking about with the G2:
| PCMark Vantage (New) | PCMark Vantage HDD (New) | PCMark Vantage (Fragmented + Used) | PCMark Vantage HDD (Fragmented + Used) | |
| Intel X25-M G1 | 15496 | 32365 | 14921 | 26271 |
| Intel X25-M G2 | 15925 | 33166 | 14622 | 24567 |
| G2 Advantage | 2.8% | 2.5% | -2.0% | -6.5% |
Something definitely changed with the way the G2 handles fragmentation, it doesn't deal with it as elegantly as the G1 did. I don't believe this is a step backwards though, Intel is clearly counting on TRIM to keep the drive from ever getting to the point that the G1 could get to. The tradeoff is most definitely performance and probably responsible for the G2's ability to maintain very high random write speeds even while used. I should mention that even without TRIM it's unlikely that the G2 will get to this performance state where it's actually slower than the G1; the test just helps to highlight that there are significant differences between the drives.
Overall the G2 is the better drive but it's support for TRIM that will ultimately ensure that. The G1 will degrade in performance over time, the G2 will only lose performance as you fill it with real data. I wonder what else Intel has decided to add to the new firmware...
I hate to say it but this is another example of Intel only delivering what it needs to in order to succeed. There's nothing that keeps the G1 from also having TRIM other than Intel being unwilling to invest the development time to make it happen. I'd be willing to assume that Intel already has TRIM working on the G1 internally and it simply chose not to validate the firmware for public release (an admittedly long process). But from Intel's perspective, why bother?
Even the G1, in its used state, is faster than the fastest Indilinx drive. In 4KB random writes the G1 is even faster than an SLC Indilinx drive. Intel doesn't need to touch the G1, the only thing faster than it is the G2. Still, I do wish that Intel would be generous to its loyal customers that shelled out $600 for the first X25-M. It just seems like the right thing to do. Sigh.
All Indilinx Drives Are Built Alike
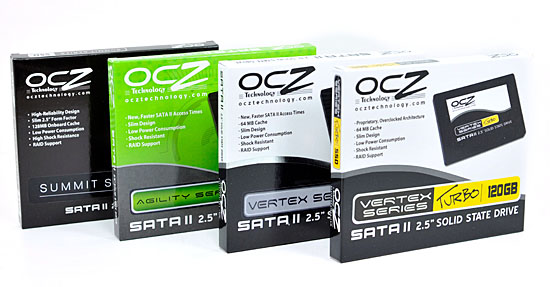
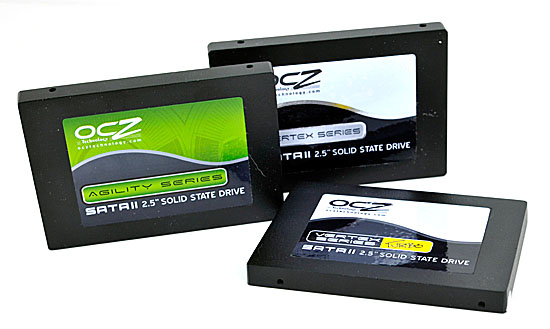
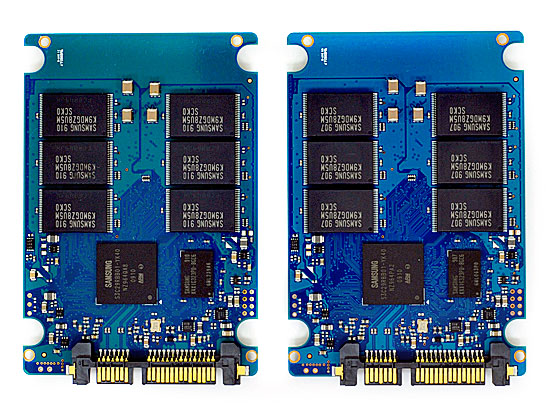
G.Skill, OCZ, Super Talent and Patriot all sent their Indilinx MLC drives in for review. If you take the drives apart you see that most are the very same on the inside, despite differences externally:
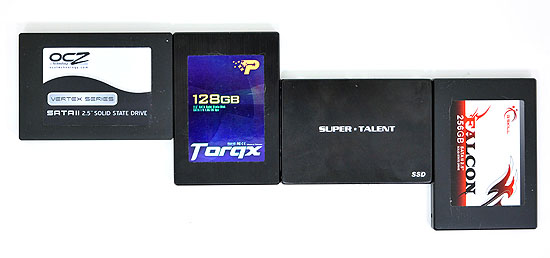
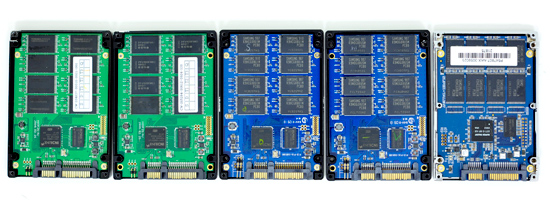
From Left to Right: OCZ Vertex Turbo, OCZ Agility, Patriot Torqx, G.Skill Falcon and Super Talent UltraDrive GX. Only the Super Talent drive uses a different PCB design.
Even the packaging doesn’t appear to vary much between manufacturers; that part I don’t really understand. All that seems to change is the artwork on the outside.
There are some minor differences between drives. Patriot ships its Torqx with a 2.5” to 3.5” drive bay adapter, a nice addition. The Torqx also comes with a 10 year warranty, the longest of any Indilinx based manufacturer. OCZ is next with a 3 year warranty, followed by Super Talent and G.Skill at 2 years.
Indilinx is still a very small company so it relies on its customers to help with validation, testing and even provide feedback for firmware development. As far as I can tell, every single Indilinx customer gets the same firmware revisions. Some vendors choose to rename the firmware revisions, while others do not. OCZ calls its latest stable firmware 1.30, while G.Skill, Super Talent and Patriot call it 1571.
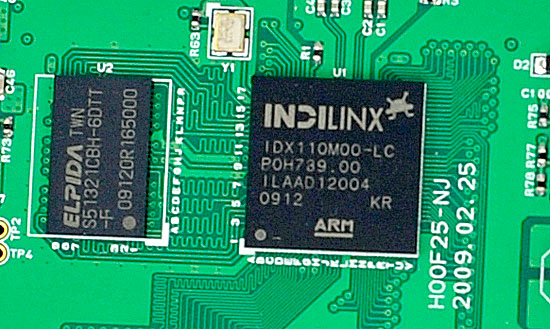
The Indilinx Barefoot controller (right), powered by an ARM core.
Of all the Indilinxites, OCZ and Super Talent work closest with the controller manufacturer. In exchange for their help in manufacturing and validation, OCZ and Super Talent also get access to the latest firmwares earlier than the rest of the manufacturers. Ultimately all manufacturers will get access to the same firmware, it just takes longer if you’re not OCZ or Super Talent.
You no longer need to use a jumper to upgrade your firmware, provided that you’re already running fw revision 1275 or later. If you have a previous version you’re pretty much out of luck as you need to upgrade to 1275 first before upgrading to anything else, and none of the manufacturers make it easy to do. Some don’t even offer links to the necessary firmware you’d need to jump to 1275. Thankfully pretty much anything you buy today should come nearly up to date, so this mostly impacts the original customers of the drive.
Performance, as you’d expect, is the same regardless of manufacturer:
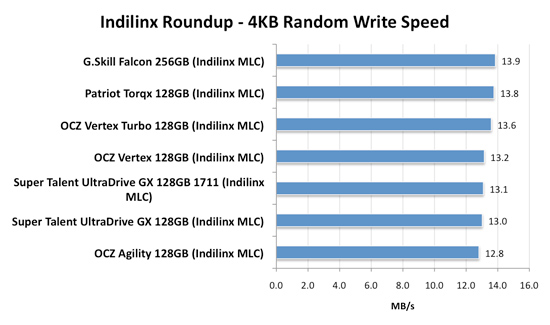
There's normal variance between drives depending on the flash/controller, that's why the OCZ Vertex is slower than the Patriot Torqx here but faster than the Super Talent UltraDrive GX. The manufacturer and size of the flash has more to do with determining performance. Samsung is used on all of these drives but the larger the drive, the better the performance. The 256GB model here will always be faster than a 128GB drive, which will always be faster than a 64GB, etc...
All of the drives here use the same firmware (1571) except for one of the Super Talent drives. That drive is using the beta 1711 firmware with TRIM support that was pulled.
When it comes to the best overall package, I’d say Patriot’s Torqx is the nicest for a desktop customer. You get a 3.5” adapter bracket and a 10 year warranty (although it’s difficult to predict what Patriot’s replacement strategy will be in 10 years).
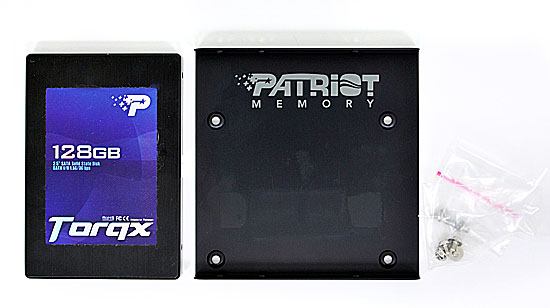
The Patriot Torqx bundle, complete with a 2.5" to 3.5" adapter.
Prices vary a bit between manufacturers, although most of the more expensive drives here have a $30 rebate to bring their prices in line:
| Price for 128GB | |
| Corsair Extreme Series | $384.00 |
| OCZ Agility | $329.00 |
| OCZ Vertex | $369.00 |
| OCZ Vertex Turbo | $439.00 |
| Patriot Torqx | $354.99 |
OCZ does do some unique things that the other manufacturers don’t such as deliver an overclocked drive (Turbo) and a drive with slower flash (Agility). There’s a Mac Edition of the Vertex, unfortunately it’s no different than the regular drive - it just has a different sticker on it and a higher pricetag.
The Wiper Tool
The only Microsoft OS with TRIM support is Windows 7. Windows XP and Vista users are out of luck when it comes to TRIM, even if your drive supports it, the OS will never send it the command. Luckily there’s a workaround, one first popularized by Indilinx - not Intel. Kudos to the Indilinx guys.
It’s called the Indilinx Wiper Tool.
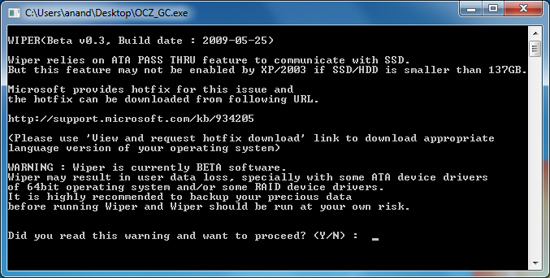
The tool asks the OS for all available LBAs (free space as far as the OS is concerned), then feeds the list to the SSD and tells the drive to TRIM those LBAs - prioritizing them for cleaning. It shouldn’t touch valid data, the key word being shouldn’t. Once cleaned, with no existing data in those blocks, performance goes back to its new state.
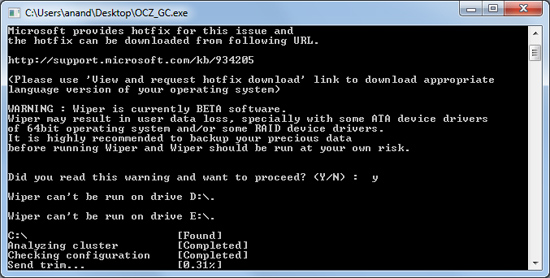
It’s a very simple solution actually. TRIM works because the OS knows when a file is deleted and it uses the TRIM command to inform the SSD of the deletion. Don’t have OS level TRIM support? Well, just run a tool that asks the OS what locations aren’t in use any longer. You get the same result, it just takes one extra step: running the wiper tool.
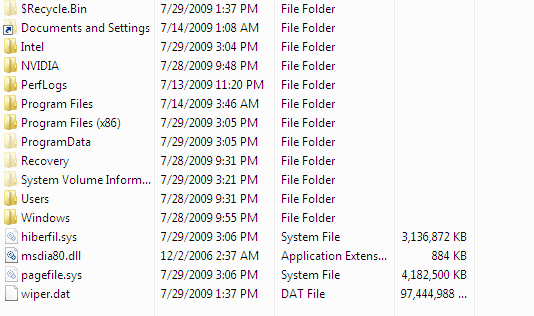
See wiper.dat? It's eating up all available LBAs then telling the controller to TRIM those blocks. Clever.
I tested the Wiper Tool to make sure it worked as promised and indeed it did, I actually showed you the results at the beginning of this story. One pass of the tool and the drive went from used to new performance:
| PCMark Vantage HDD Score | New | "Used" | After TRIM/Idle GC | % of New Perf |
| OCZ Vertex Turbo (Indilinx MLC) | 26157 | 25035 | 26038 | 99.5% |
You’ll need to get the tool from your drive vendor and it currently works under both 32-bit and 64-bit Windows OSes (XP through 7). I found that it works best in IDE mode; with your controller set to RAID or AHCI I’ve seen issues where the manual trim process can easily take more than several hours. When running properly it takes a couple of minutes to trim an entire drive.
You don’t need to run the tool that often (Indilinx drives don’t drop significantly in real world performance anyway) and once we get official TRIM support, Windows 7 users won’t need to do anything at all. But until then it does provide a nice way to keep your drive fresh.
Impact of Idle Garbage Collection
The other option that Indilinx provides its users to improve used performance is something called idle or background garbage collection. The idea is that without any effort on your or the OS’ part your drive, while idle, will defragment itself.
The feature was actually first introduced by Samsung for its RBB based drives, but I’ll get to the issues with Samsung’s drives momentarily.
It either works by looking at the data on the drive and organizing it into a less fragmented state, or by looking at the file system on the drive and attempting to TRIM based on what it finds. Both Indilinx and Samsung have attempted to implement this sort of idle garbage collection and it appears they do it in different ways. While the end result is the same, how they get there determines the usefulness of this feature.
In the first scenario, this is not simply TRIMing the contents of the drive, the drive doesn’t know what to TRIM; it must still keep track of all data. Instead, the drive is re-organizing its data to maximize performance.
The second scenario requires a compatible file system (allegedly NTFS for the Samsung drives) and then the data is actually TRIMed as it would be with the TRIM instruction.
Details are slim, but the idle garbage collection does work in improving performance:
| PCMark Vantage HDD Score | New | "Used" | After TRIM/Idle GC | % of New Perf |
| Corsair P256 (Samsung MLC) | 26607 | 18786 | 24317 | 91% |
Presumably this isn’t without some impact to battery life in a notebook. Furthermore, it’s impossible to tell what impact this has on the lifespan of the drive. If a drive is simply reorganizing data on the fly into a better (higher performing) state, that’s a lot of reads and writes when you’re doing nothing at all. And unfortunately, there’s no way to switch it off.
While Indilinx is following in Samsung's footsteps with enabling idle garbage collection, I believe it's a mistake. Personally, real TRIM support (or at least the wiper tool) is the way to go and it sounds like we’ll be getting it for most if not all of these SSDs in the next couple of months. Idle garbage collection worries me.
Early TRIM Support on Indilinx Drives
As I already briefly mentioned, Indilinx has added support for the TRIM instruction in an early firmware for OCZ and Super Talent drives. OCZ calls this firmware 1.42 while Super Talent sticks with the Indilinx label: 1711. Unfortunately, the firmware caused data loss if you put your machine to sleep and has since been pulled from both OCZ and Super Talent's websites.
When it was available, the firmware did work:
| SuperTalent UltraDrive GX 1711 | 4KB Random Write IOPS |
| Clean Drive | 13.1 MB/s |
| Used Drive | 6.93 MB/s |
| Used Drive After TRIM | 12.9 MB/s |
TRIM is triggered by two things it seems. Either deleting a file and emptying the recycle bin (to truly delete it) or formatting the drive. Simply deleting a partition doesn't TRIM the entire drive as I found out the hard way. During normal use, TRIM should deliver somewhere in the upper 90s in terms of percent of new performance.
There are significant limitations to TRIM at this point. The instruction only works in a supported OS (Windows 7 and some Linux builds) and only with supported drivers. Under Windows 7 that means you have to use a Microsoft made IDE or AHCI driver (you can't install chipset drivers from anyone else).
Unfortunately if you’re running an Intel controller in RAID mode (whether non-member RAID or not), Windows 7 loads Intel’s Matrix Storage Manager driver, which presently does not pass the TRIM command. Intel is working on a solution to this and I'd expect that it'll get fixed after the release of Intel's 34nm TRIM firmware in Q4 of this year.
OCZ Gets Clever: Agility vs. Vertex, Even Cheaper Indilinx SSDs
Samsung makes SSDs for OEMs, Samsung sells pre-made SSDs to companies like OCZ and Corsair and Samsung also makes NAND flash. Samsung actually made all of the flash that was used in the first generation of Indilinx SSDs. Unfortunately, prices went up.
OCZ was quick to adapt and started making Indilinx drives using flash from different manufacturers. This is the OCZ Vertex, we’re all familiar with it:
This is the OCZ Agility. You get the same controller as the Vertex, but with either Intel 50nm or Toshiba 40nm flash:
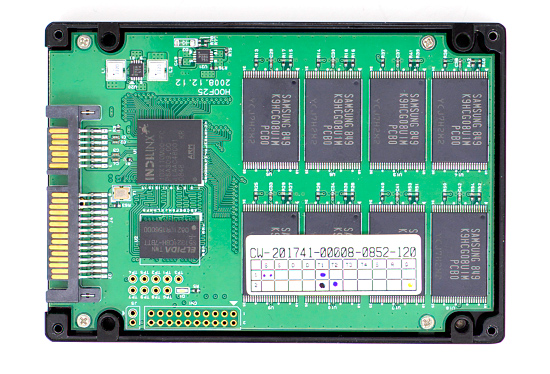
My Vertex used Samsung flash, like all other Indilinx drives
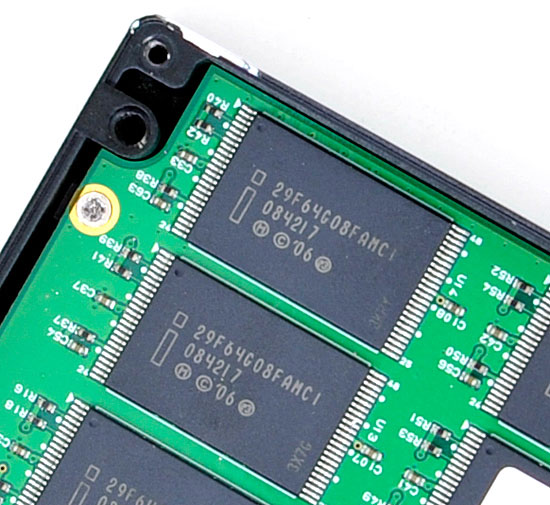
My Agility used Intel's 50nm flash
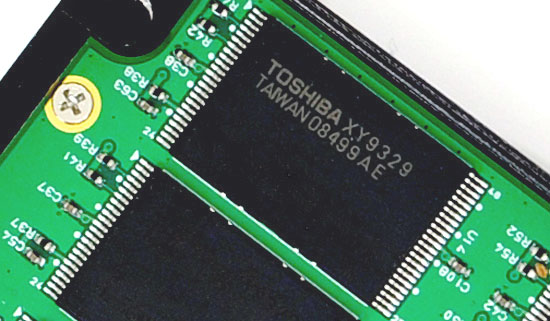
Some lucky Agility owners get Toshiba 40nm flash, which is faster.
The performance is a lower since the flash chips themselves are slower. I'm actually comparing the Vertex Turbo here but my Turbo sample actually runs as fast as most stock Indilinx MLC drives so it provides good reference for an Agility vs. a good Vertex drive:
| Used Performance | OCZ Agility | OCZ Vertex | Vertex Advantage |
| 4KB Random Write | 7.1 MB/s | 7.6 MB/s | 7% |
| 4KB Random Read | 35.9 MB/s | 37.4 MB/s | 4.2% |
| 2MB Sequential Write | 136.3 MB/s | 155.8 MB/s | 14.3% |
| 2MB Sequential Read | 241.3 MB/s | 254.2 MB/s | 5.3% |
| PCMark Vantage Overall | 14468 | 14694 | 1.6% |
| PCMark Vantage HDD | 24293 | 25309 | 4.2% |
The performance ranges from 0 - 5% in the PCMark suite and jumps up to 4 - 14% in the low level tests. The price difference amounts to around 12% for a 128GB drive and 9.5% for a 64GB drive. There's no 256GB Agility.
| OCZ Agility | OCZ Vertex | Price Difference | |
| 64GB | $199.00 | $219.00 | $19 |
| 128GB | $329.00 | $369.00 | $40 |
| 256GB | N/A | $725.00 | N/A |
If you want to make the jump to an SSD and are looking to save every last dollar, the Agility is an option.
I think the Agility line is a great idea from OCZ. I’m not sure about you but personally, as long as the flash is reliable, I don’t care who makes it. And I’m willing to give up a little in the way of performance in order to hit more competitive price points.
The OCZ Solid 2: More Flash Swappin
We established that the OCZ Agility is just a Vertex with cheaper (priced) flash. But what the heck is the Solid 2?
OCZ recently announced the Solid 2, a horrible name (the old Solid was based on a JMicron controller) but similar approach to the Agility.
The first Solid 2 drives are being built now and they use the same Indilinx controller as the Vertex and Agility. The difference? Once again, it’s the flash. These drives use Intel’s 34nm flash.
The initial Solid 2 specs were very low and I’ve received confirmation that they were simply conservative. Performance is changing on a daily basis now and OCZ simply made the announcement to get pre-orders started. Apparently there are issues getting the Indilinx controller working with Intel’s 34nm flash but OCZ is making progress.
The OCZ Vertex Turbo: Overclocked Indilinx
I’ll have to give it to OCZ’s CEO Ryan Petersen, he always tries. The SSD race is once again heating up and he’s determined to compete on more than just price. OCZ’s entire Indilinx line of drives are going to be cheaper (at least in cost per GB) than Intel’s, but OCZ is also adding new drives to the lineup.
The Vertex and Agility we’re both familiar with. The Vertex EX is the SLC version and now we have the Vertex Turbo. The Turbo is a Vertex but with a faster controller and DRAM cache: 180MHz vs. 166MHz for the stock Vertex. It's not a physically different controller, it's just one that has been binned to run at 180MHz. OCZ helps Indilinx validate its drives and in exchange for that, Indilinx gives OCZ the exclusivity on 180MHz controllers.
We’re talking about an 8% increase in controller and DRAM frequency. If we’re lucky, we might reduce the time some instructions take to complete by a few nanoseconds. The problem is that we’re fundamentally bottlenecked by the performance of the NAND flash itself, which operates on the order of microseconds. In other words: don’t expect a performance boost.
We've already seen that these Indilinx drives can vary in performance by a few percent from drive to drive, so in order to make the comparison as accurate as possible I did all of my tests on the Vertex Turbo. After I was done running my Turbo tests I simply threw on the standard Vertex firmware, which specifies a 166MHz controller/DRAM clock.
| New Performance | OCZ Vertex | OCZ Vertex Turbo | Turbo Advantage |
| 4KB Random Write | 13.2 MB/s | 13.6 MB/s | 3% |
| 2MB Sequential Write | 175.9 MB/s | 184.2 MB/s | 4.7% |
As expected, there’s very little performance difference here. You'd see the same sorts of differences between two different Indilinx MLC drives. My Torqx sample from Patriot was as fast as my Vertex Turbo sample. OCZ charges a huge premium for the Turbo drive though:
| Price for 128GB | |
| OCZ Vertex | $369.00 |
| OCZ Vertex Turbo | $439.00 |
| Turbo Premium | 19% |
It's up to the price of a 160GB Intel X25-M G2, absolutely not worth it. I talked with Ryan Petersen, OCZ's CEO about the Turbo and its lack of value. As usual, we argued a bit but eventually gave me his vision. He wants to bring 180MHz controllers to all Vertex drives, and not charge premiums for it. His intentions are to improve how competitive OCZ's drives are in a sea of equal-performing Indilinx drives.
While I wouldn't recommend spending more money on the Turbo, if OCZ brings 180MHz controllers to all of its drives I won't complain.
What's Wrong with Samsung?
The largest SSD maker in the world is Samsung. Samsung makes the drives offered by Apple in its entire MacBook/MacBook Pro lineup. Samsung makes the drives you get if you order a Lenovo X300. In fact, if you're buying any major OEM system with an SSD in it, Samsung makes that drive.
It's just too bad that those drives aren’t very good.
This is the 4KB random write performance of Samsung's latest SSD, based on the RBB controller:
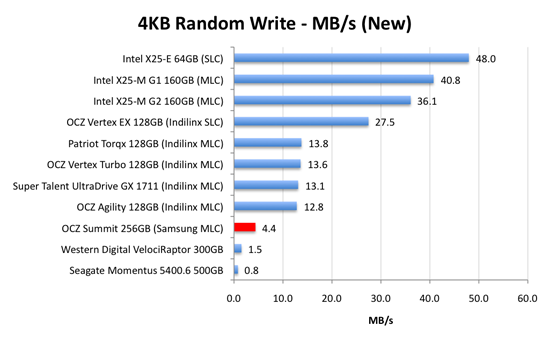
4.4MB/s. That's 3x the speed of a VelociRaptor, but 1/3 the speed of a cheaper Indilinx drive.
Speedy, but not earth shattering. Now let's look at performance once every LBA has been written to. This is the worst case scenario performance we've been testing for the past year:
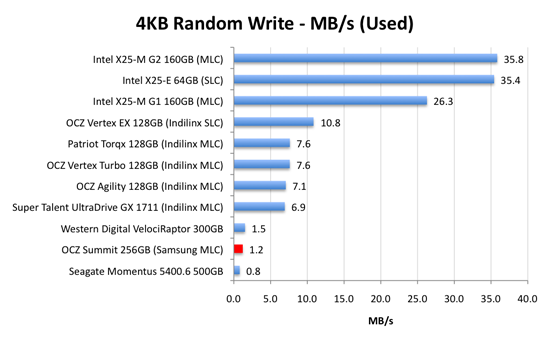
...and now we're down to mechanical hard drive speeds
Holycrapwtfbbq? Terrible.
Now to be fair to Samsung, this isn’t JMicron-terrible performance. It’s just not worth the money performance.
The Samsung RBB based SSDs are rebranded by at least two manufacturers: OCZ and Corsair.
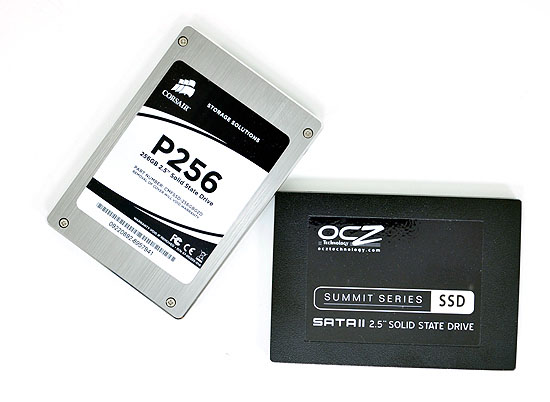
The OCZ Summit and the Corsair P256 both use the Samsung RBB platform.
The Corsair and OCZ Samsung RBB drives.
The drive most OEMs are now shipping is an even older, lower performing Samsung SSD based on an older controller.
I talked to some of the vendors who ship Samsung RBB based SSDs and got some sales data. They simply can’t give these drives away. The Indilinx based drives outsell those based on the Samsung RBB controller by over 40:1. If end users are smart enough to choose Indilinx and Intel, why aren't companies like Apple and Lenovo?
Don't ever opt for the SSD upgrade from any of these OEMs if you've got the option of buying your own Indilinx or Intel drive and swapping it in there. If you don't know how, post in our forums; someone will help you out.
Samsung realized it had an issue with its used-state performance and was actually the first to introduce background garbage collection; official TRIM support will be coming later. Great right? Not exactly.
There’s currently no way for an end user to flash the firmware on any of these Samsung drives. To make matters worse, there’s no way for companies like OCZ or Corsair to upgrade the firmware on these drives either. If you want a new firmware on the drive, it has to go back to Samsung. I can’t even begin to point out how ridiculous this is.
If you’re lucky enough to get one of the Samsung drives with background garbage collection, then the performance drop I talked about above doesn’t really matter. How can you tell? Open up Device Manager, go to your SSD properties, then details, then select Hardware Ids from the dropdown. Your firmware version will be listed at the end of your hardware id string:
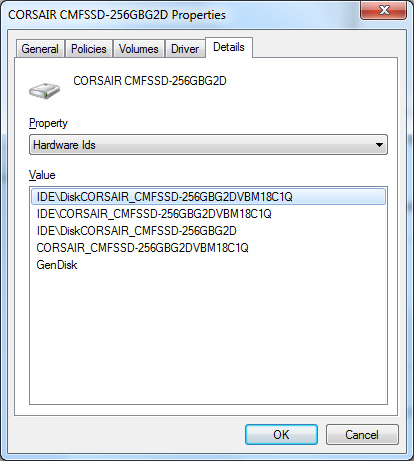
Version 1801Q doesn’t support BGC. Version 18C1Q (or later) does.
How can you ensure you get a model with the right firmware revision? Pick a religion and start praying, because that’s the best you can do.
Now the good news. When brand new, the Samsung drives actually boast competitive sequential write, sequential read and random write speeds.
These drives are also highly compatible and very well tested. For all of the major OEMs to use them they have to be. It’s their random write performance that’s most disappointing. TRIM support is coming later this year and it will help keep the drives performing fresh, but even then they are still slower than the Indilinx alternatives.
There’s no wiper tool and there’s currently no method to deploy end-user flashable firmware updates. Even with TRIM coming down the road, the Samsung drives just don’t make sense.
Why You Absolutely Need an SSD
Compared to mechanical hard drives, SSDs continue to be a disruptive technology. These days it’s difficult to convince folks to spend more money, but I can’t stress the difference in user experience between a mechanical HDD and a good SSD. In every major article I’ve written about SSDs I’ve provided at least one benchmark that sums up exactly why you’d want an SSD over even a RAID array of HDDs. Today’s article is no different.
The Fresh Test, as I like to call it, involves booting up your PC and timing how long it takes to run a handful of applications. I always mix up the applications and this time I’m actually going with a lighter lineup: World of Warcraft, Adobe Photoshop CS4 and Firefox 3.5.1.
Other than those three applications, the system was a clean install - I didn’t even have any anti-virus running. This is easily the best case scenario for a hard drive and on the world’s fastest desktop hard drive, a Western Digital VelociRaptor, the whole process took 31 seconds.
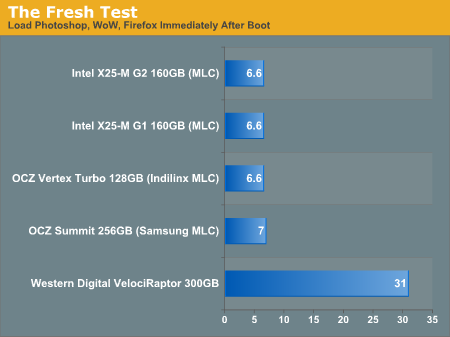
And on Intel’s X25-M SSD? Just 6.6 seconds.
A difference of 24 seconds hardly seems like much, until you actually think about it in terms of PC response time. We expect our computers to react immediately to input; even waiting 6.6 seconds is an eternity. Waiting 31 seconds is agony in the PC world. Worst of all? This is on a Core i7 system. To have the world’s fastest CPU and to have to wait half a minute for a couple of apps to launch is just wrong.
A Personal Anecdote on SSDs
I’m writing this page of the article on the 15-inch MacBook Pro I reviewed a couple of months ago. I’ve kept the machine stock but I’ve used it quite a bit since that review thanks to its awesome battery life. Of course, by “stock” I mean that I have yet to install an SSD.
Using the notebook is honestly disappointing. I always think something is wrong with the machine when I go to fire up Adium, Safari, Mail and Pages all at the same time to get to work. The applications take what feels like an eternity to start. While they are all launching the individual apps are generally unresponsive, even if they’ve loaded completely and I’m waiting on others. It’s just an overall miserable experience by comparison.
It’s shocking to think that until last year, this is how all of my computer usage transpired. Everything took ages to launch and become useful, particularly the first time you boot up your PC. It was that more than anything else that drove me to put my PCs to sleep rather than shut them down. It was also the pain of starting applications from scratch and OS X’s ability to get in/out of sleep quickly that made me happier using OS X than XP and later Vista.
It’s particularly interesting when you think of the ramifications of this. It’s the poor random read/write performance of the hard disk that makes some aspects of PC usage so painful. It’s the multi-minute boot times that make users more frustrated with their PCs. While the hard disk helped the PC succeed, it’s the very device that’s killing the PC in today’s instant-on, consumer electronics driven world. I challenge OEMs to stop viewing SSDs as a luxury item and to bite the bullet. Absorb the cost, work with Intel and Indilinx vendors to lower prices, offer bundles, do whatever it takes but get these drives into your systems.
I don’t know how else to say this: it’s an order of magnitude faster than a hard drive. It’s the difference between a hang glider and the space shuttle; both will fly, it’s just that one takes you to space. And I don’t care that you can buy a super fast or high flying hang glider either.
Sequential Read/Write Speed
Finally, to the roundup. We’ll start with the traditional tests. Using the latest build of Iometer I ran a 3 minute long 2MB sequential write test over the entire span of the drive. The results reported are in average MB/s over the entire test length:
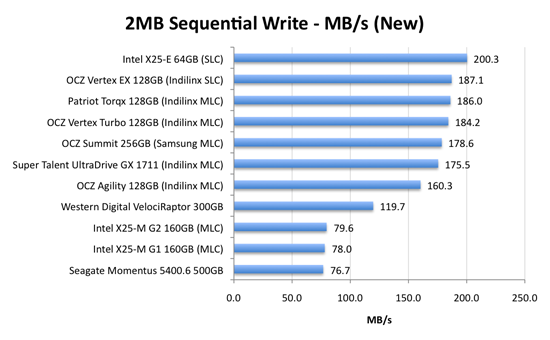
Sequential write speed was what all SSD makers focused on in the early days of consumer drives. The JMicron lesson taught us that there's much more to system performance than sequential write performance, and most have learned. Regardless, sequential write speed is still very important and as we can see here the majority of drives do very, very well. The high end Indilinx drives approach 190MB/s, while Intel's SLC X25-E actually breaks 200MB/s.
The same can't be said for Intel's mainstream MLC drives, both of which are limited to 80MB/s. While it doesn't make the drives feel slow in real world usage, it is a significant blemish on an otherwise (as you'll soon see) flawless track record.
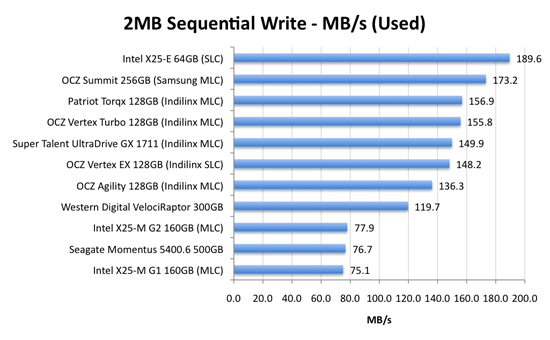
The standings don't really change with the drive in a used state. The Indilinx drives all fall around 15%, while the Intel drives stay the same.
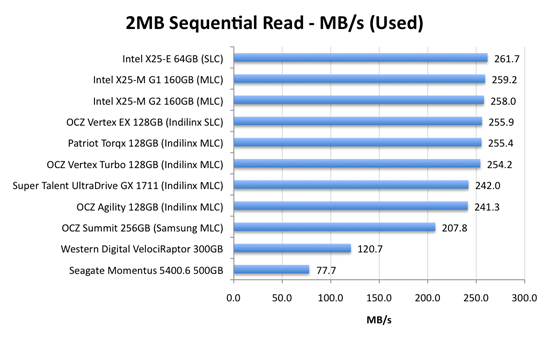
Ha! Read speed is ridiculous on these drives. See the wall at around 260MB/s? We're hitting the limit of what's possible over 3Gbps SATA. Expect read speeds to go up once we start seeing SATA 6Gbps drives and controllers to support them.
Random Read/Write Speed
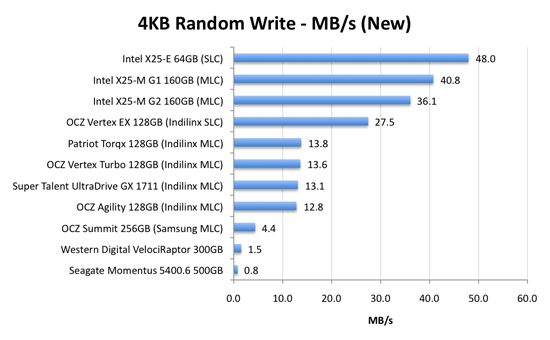
This test writes 4KB in a completely random pattern over an 8GB space of the drive to simulate the sort of random writes that you'd see on an OS drive (even this is more stressful than a normal desktop user would see). I perform three concurrent IOs and run the test for 3 minutes. The results reported are in average MB/s over the entire time:
As we established in previous articles, the disk operations that feel the slowest are the random small file reads and writes. Both of which are easily handled by an SSD. A good friend of mine and former AnandTech Editor, Matthew Witheiler, asked me if he'd notice the performance improvement. I showed him the chart above.
He asked again if he'd notice. I said, emphatically, yes.

Now this is super interesting. Intel's X25-M G1 drops from 40.8MB/s when new down to 26.3MB/s in a well used state. Unfortunately for the G1, it will never get TRIM and will spend more time in the lower performance state over the life of the drive. But look at what happens with the X25-M G2: it drops from 36.1MB/s to 35.8MB/s - virtually no performance is lost. In fact, the G2 is so fast here that it outperforms the super expensive X25-E. Granted you don't get the lifespan of the X25-E and the SLC drive should perform better on more strenuous random write tests, but this is a major improvement.
The explanation? It actually boils down to the amount of memory on the drive. The X25-M G1 had 16MB of 166MHz SDRAM on-board, the G2 upped it to 32MB of slower 133MHz DRAM. Remember that Intel doesn't keep any user data in DRAM, it's only used for the remapping, defragmenting and tracking of all of the data being written to the drive. More DRAM means that the drive can now track more data, which means that even in the heaviest of random-write workloads you could toss at it on a normal desktop you will not actually lose any performance with the drive in a used state. And this is the drive Intel has decided to grant TRIM to.
The G2 is good.
The Indilinx drives do lose performance here. They drop from roughly 13MB/s down to 7MB/s. We're still talking ~5x the speed of a VelociRaptor, so there's no cause for alarm. But it's clear that even Indilinx's SLC drive can't match Intel's random write performance. And from what I hear, Intel's performance is only going to get better.
This is what the X25-M price premium gets you.
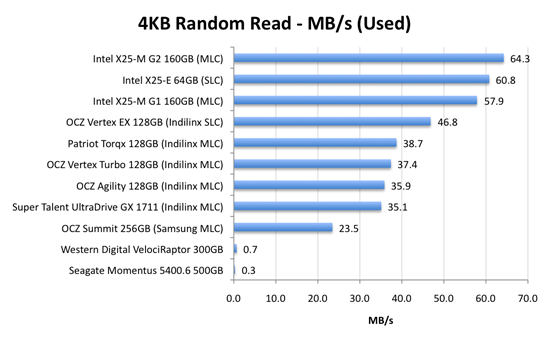
Bahahaha, look at the hard drive scores here: 0.7MB/s and 0.3MB/s? That's freakin' terrible! And that's why your system feels so slow when you start it up, there are a ton of concurrent random reads and writes happening all over the place which your hard drive crunches through at roughly 0.5MB/s. Even the Samsung based OCZ Summit manages a significant performance advantage here.
The Indilinx drives all cluster around the 30 - 40MB/s mark for random read performance, nothing to be ashamed of. The Intel drives kick it up a notch and give you roughly 60MB/s of random read performance. It's a noticeable improvement. As our application launch tests will show however, loading a single app on either an Indilinx or Intel drive will take about the same amount of time. It's only in the heavy multitasking and "seat of the pants" feel that you'll have a chance at feeling a difference.
Overall System Performance using PCMark Vantage
Next up is PCMark Vantage, another system-wide performance suite. For those of you who aren’t familiar with PCMark Vantage, it ends up being the most real-world-like hard drive test I can come up with. It runs things like application launches, file searches, web browsing, contacts searching, video playback, photo editing and other completely mundane but real-world tasks. I’ve described the benchmark in great detail before but if you’d like to read up on what it does in particular, take a look at Futuremark’s whitepaper on the benchmark; it’s not perfect, but it’s good enough to be a member of a comprehensive storage benchmark suite. Any performance impacts here would most likely be reflected in the real world.
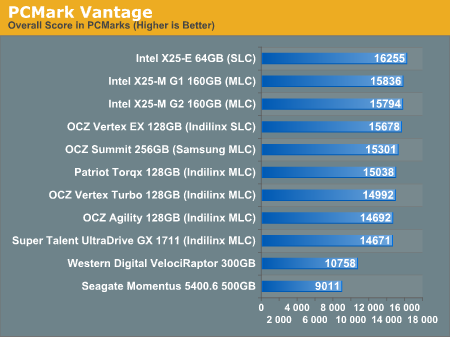
The overall PCMark Vantage score takes into account CPU and GPU performance and thus storage performance is only one aspect of determining your score. All of the SSDs do well here, the slowest configuration still around 36% faster than the WD VelociRaptor; something I'd say is more than reflected in real world performance.
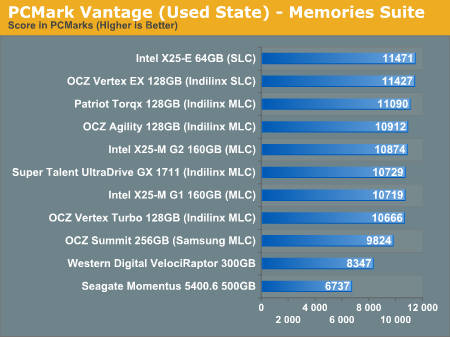
The memories suite includes a test involving importing pictures into Windows Photo Gallery and editing them, a fairly benign task that easily falls into the category of being very influenced by disk performance.
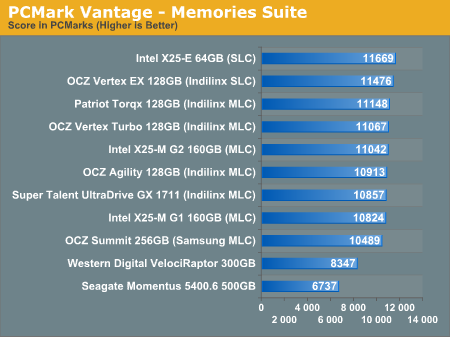
Once again the SSDs all perform very similarly here. The fastest of the group is Intel's X25-E, but the Indilinx drives actually hold the next three spots followed by the new G2. The performance range is very small between these drives though, you honestly can't go wrong with either an Indilinx MLC or X25-M.
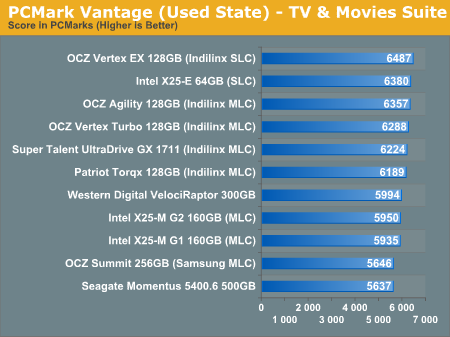
The TV and Movies tests focus on on video transcoding which is mostly CPU bound, but one of the tests involves Windows Media Center which tends to be disk bound.
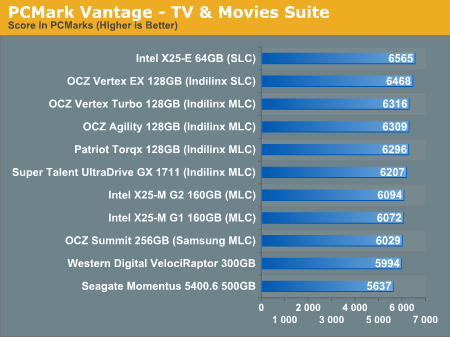
The standings continue to be roughly the same. We see just how much more competitive Indilinx is this time around than when the OCZ Vertex first hit the streets. We do have a real alternative to Intel.
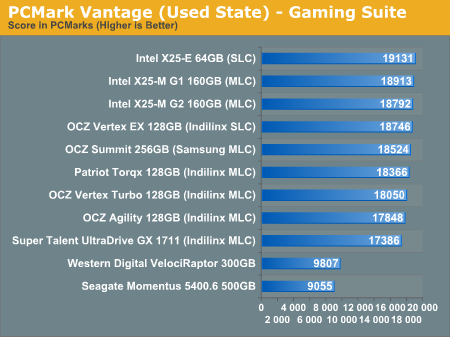
The gaming tests are very well suited to SSDs since they spend a good portion of their time focusing on reading textures and loading level data. All of the SSDs dominate here, but as you'll see later on in my gaming tests the benefits of an SSD really vary depending on the game. Take these results as a best case scenario of what can happen, not the norm.
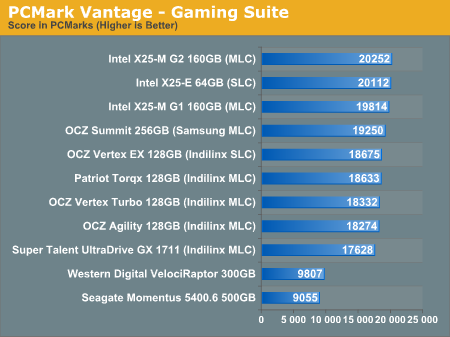
The Vantage Gaming Suite shows us our first example of the X25-M G2 pulling ahead of even the SLC X25-E. Even the Samsung based OCZ Summit does very well here.
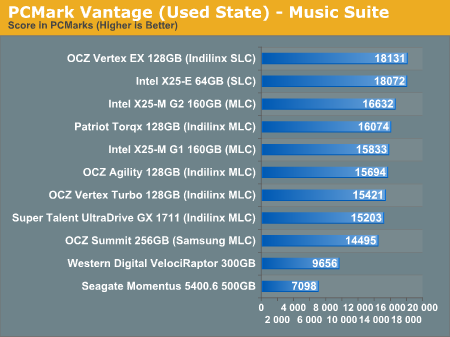
In the Music suite the main test is a multitasking scenario: the test simulates surfing the web in IE7, transcoding an audio file and adding music to Windows Media Player (the most disk intensive portion of the test).
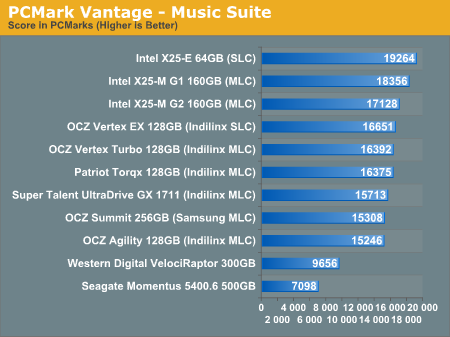
The Intel drives are at the top, the G1 faster than the G2, followed by the Indilinx drives, then the Samsung drive and the mechanical drives. New performance is important here because once TRIM shows up, this is closer to what you'll be seeing for a drive with a good amount of free space.
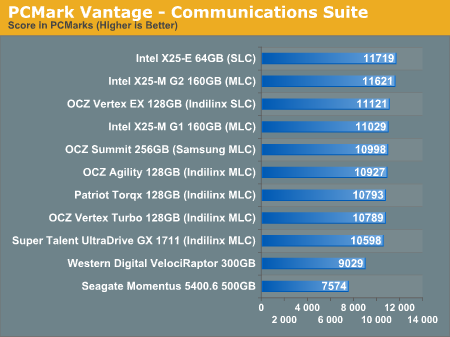
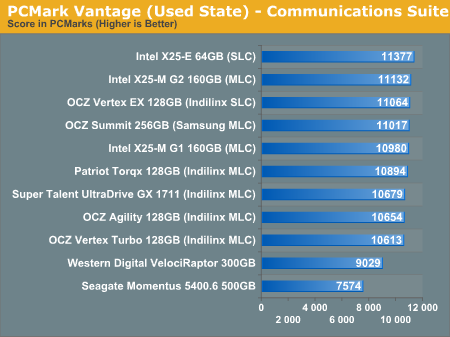
The Communications suite is made up of two tests, both involving light multitasking. The first test simulates data encryption/decryption while running message rules in Windows Mail. The second test simulates web surfing (including opening/closing tabs) in IE7, data decryption and running Windows Defender.
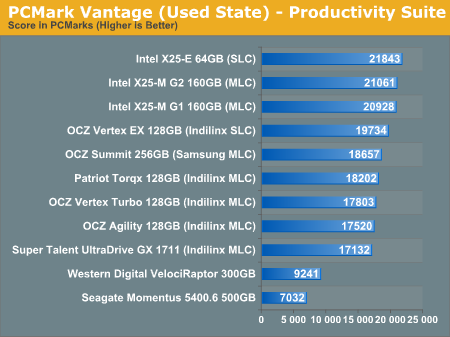
I love PCMark's Productivity test; in this test there are four tasks going on at once, searching through Windows contacts, searching through Windows Mail, browsing multiple webpages in IE7 and loading applications. This is as real world of a scenario as you get and it happens to be representative of one of the most frustrating HDD usage models - trying to do multiple things at once. There's nothing more annoying than trying to launch a simple application while you're doing other things in the background and have the load take seemingly forever.
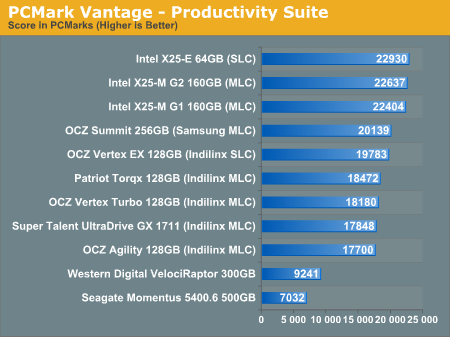
Here the Intel drives are at the top, by a noticeable margin. The G1, G2 and X25-E are all around the same level of performance. Samsung comes close with the OCZ Summit and the Indilinx drives pull up the rear. You can't go wrong with either the Intel or Indilinx drives but Intel is clearly faster here.
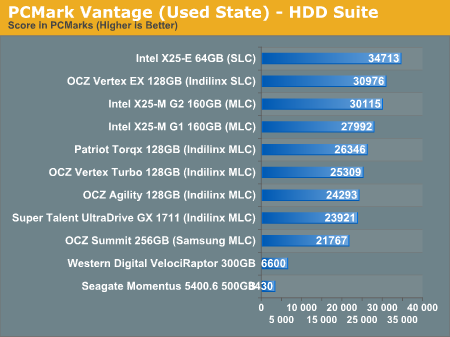
The final PCMark Vantage suite is HDD specific and this is where you'll see the biggest differences between the drives:
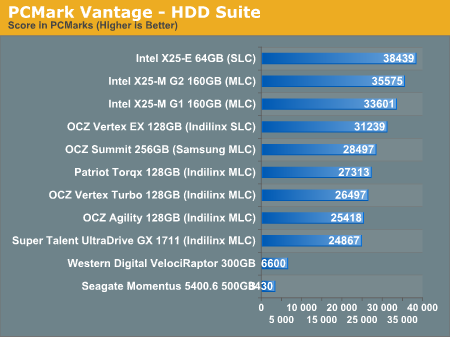
When it comes to pure drive performance, the breakdown doesn't get any simpler. Intel's X25-E holds the top spot, followed by the G2 and G1. While the G2 is only 5.6% faster than the G1, remember that we're looking at "new" performance here. Over time, with TRIM, the G2 will be closer to this performance, while the G1 will never get here again.
Despite poor random small file write performance, the OCZ Summit actually does very well here.
All of the drives perform incredibly compared to any mechanical hard drives.
PCMark Vantage: Used Drive Performance
Immediately after finishing my PCMark Vantage runs on the previous page, I wrote one large file sequentially to the rest of the drive. I then deleted the file, rebooted and re-ran PCMark Vantage. This gives us an idea of the worst case desktop performance of these drives as you create, delete and generally just use these drives.

The biggest difference here is that the Samsung based OCZ Summit drops from 5th to 9th place. All of the drives get slower but the Indilinx drives hardly show it. When it comes to dealing with write speed, SLC flash does have the advantage and we see the X25-E and Vertex EX rise to the top of the pack. The G2 is slightly faster than the G1 and the Indilinx drives follow in close pursuit.
The mechanical drives don't change in performance since they don't get slower with use, only as they get more full.
Again we see the two SLC drives at the top, this time followed by a mixture of Indilinx/Intel drives, and the Samsung based Summit is at the bottom of the pack before we get to the HDDs.
The spread in SSD performance here is only 10% between the slowest non-Samsung drive and the fastest. That tells me that we're mostly CPU bound, but the worst performers other than the Samsung drive are the two Intel X25-Ms. That part tells me that we're at least somewhat bound by sequential write speeds. Either way, the Indilinx drives have a good showing here.
Intel followed by Indilinx SLC with Samsung in league with the MLC Indilinx drives. This is an SSD's dream.
Despite the improvements, the G2 can't touch the much lower write latency of SLC flash here. The Indilinx and Intel G1 drives intermingle while the Samsung drive pulls up the rear. All are faster than a regular hard drive of course.
In the multitasking test we once again see Intel rise to the top. The Samsung drive does surprisingly well and the Indilinx drives continue to perform admirably.
The breakdown between SSDs here is almost linear. The X25-E leads the pack, followed by OCZ's SLC drive. The G2 and G1 are next, then a ton of Indilinx MLC drives. The slowest SSD? The Samsung based Summit of course.
Individual Application Performance
PCMark Vantage does a great job of summarizing system performance, but I thought I'd pick a couple of applications to showcase real world strengths/weaknesses of these drives.
The first test is our Photoshop CS4 benchmark by the Retouch Artists. I made one small change to the way this test is run however. Normally I set the number of history states in Photoshop to 1, this significantly reduces the impact of the HDD/SSD on the test and makes it a better measure of CPU/memory speed. Since this is an SSD article, I've left the setting at its default value of 20. The numbers are now a lot lower and the performance a lot more disk bound.
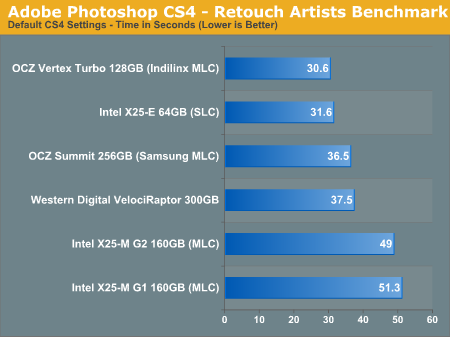
I didn't run all of the drives through this test, just one from each major controller. The results speak for themselves. The Indilinx drives are actually the fastest MLC drives here. Even the Samsung is faster than the Intel drives in this test. Why? Sequential write speed. Even the VelociRaptor has a higher sequential write speed than the X25-M. So while sequential write speed isn't the most important metric to look at when evaluating an SSD, there are real world situations where it does matter.
Intel's performance here is just embarassing. Sequential write speed is something Intel needs to take more seriously in the future. Throw in any amount of random read/write operations alongside your Photoshop usage and the Intel drives would redeem themselves, but this is a very realistic snapshot of their achilles' heel.
Many of you have been asking for compiler benchmarks so I did just that. I grabbed the latest source for Pidgin (a popular IM application) and followed the developer's instructions on building it in Windows:
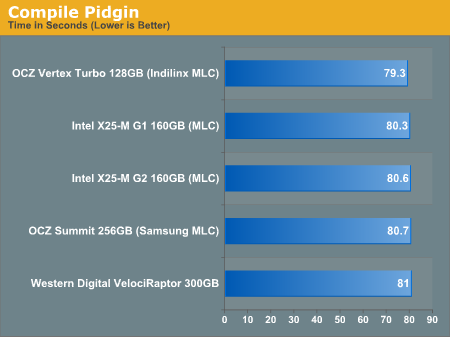
Nada. I thought perhaps it wasn't stressful enough so I tried building two instances in parallel:
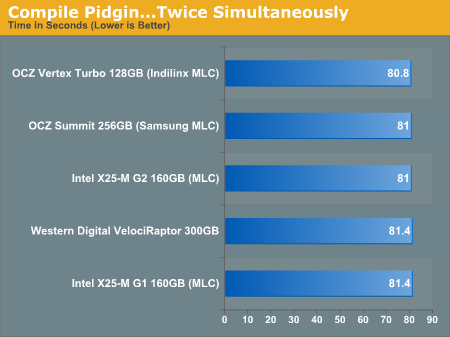
And...nothing. It seems that building Pidgin is more CPU than IO bound, or at least its IO access isn't random enough to really benefit from an SSD. I'll keep experimenting with other compiler tests but this one appears to be a bust for SSD/HDD performance testing.
Power Consumption
SSDs are at their highest power consumption when performing large file sequential writes. The majority of the power consumption comes from writing to the NAND flash and when you’re doing sequential writes you have more flash devices engaged at a time. Thus my peak power consumption test involves measuring power used over the 5V rail while the drives perform my 2MB sequential write benchmark in Iometer and at idle of course.
First, the idle numbers:
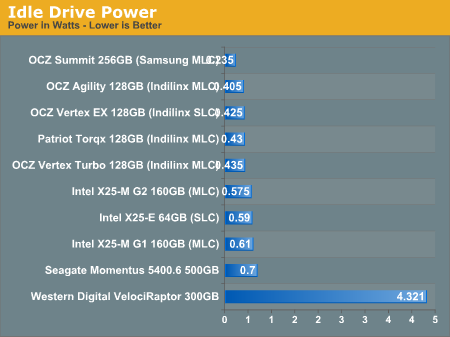
The Samsung and Indilinx drives use the least power, while the Intel drives use the most out of the SSDs. Intel honestly just needs to stick some power gate transistors in front of the controller and flash to curb power consumption at idle. They are all still lower than a mechanical drive, and much lower than a 3.5" HDD.
It's also worth noting that given the order of magnitude performance advantage these drives hold over traditional hard drives, they spend far more time at idle than their mechanical counterparts.
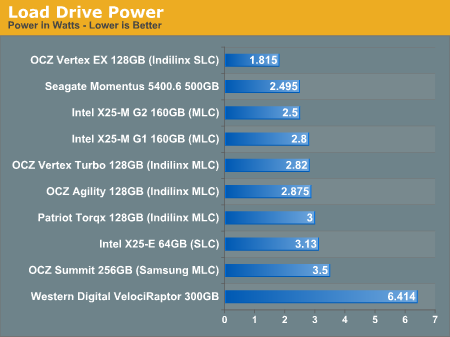
Under load the SSDs use anywhere from 2.5 - 3.5W, the exception being the Indilinx SLC drive which comes in at under 2W. Power consumption is roughly half if you switch to a random write workload, and the standings also switch places. While Intel's X25-M G2 draws less power than the OCZ Vertex Turbo in the sequential write test, it draws more power in a random write workload:
| Random Write Power Consumption | Min | Average | Max |
| Intel X25-M G2 160GB (MLC) | 1.55 W | 1.60 W | 1.7 W |
| OCZ Vertex Turbo 128GB (Indilinx MLC) | 1.13 W | 1.17 W | 1.21 W |
As I alluded to before, the much higher performance of these drives than a traditional hard drive means that they spend much more time at an idle power state. The Seagate Momentus 5400.6 has roughly the same power characteristics of these two drives, but they outperform the Seagate by a factor of at least 16x. In other words, a good SSD delivers an order of magnitude better performance per watt than even a very efficient hard drive.
Final Words
We’ve become complacent. In today’s world of netbooks and nettops where performance is cast aside, we’ve let far too much slide. The bar of acceptability is too low. A good SSD is the anti-netbook, it is the most believable proof that PCs aren’t fast enough today. We don’t need good enough, we need orders of magnitude of performance improvement. And that's exactly what a good SSD can deliver today.
The performance improvement isn't limited to high end machines. In fact, some of the most perceivable differences in performance are on lower end machines, netbooks and nettops. The combination of a slow CPU and a slow hard drive is horrendous; the SSD allows you to at least alleviate some of the bottleneck in these slower machines. And today we actually have affordable options that make sense to even put in a netbook.
A year ago the market was full of worthless SSDs being sold at a premium. Today, we have two real contenders for the throne: Intel and Indilinx. Let me start with Indilinx.
Indilinx is a company that no one knew a year ago, nor would anyone even begin to trust back then. I remember talking to OCZ about the problems with their JMicron drives and being told that their next-generation drive would have a controller by a new company. They told me the name and I was more than skeptical. JMicron couldn't do it, why would this strangely named new company be able to get it right? Even when I first tested an Indilinx drive I was hopeful but still cautious; it's something I used in my system for a short period, but nothing I would commit to. If you wanted an SSD, Intel was still the only way to go.
When I started writing this article I took a big step. I felt that Indilinx drives had reached the point that their performance was good enough to be considered an Intel alternative. I backed up my X25-M, pulled it out, and swapped in an OCZ Vertex drive - into my personal work system. I've been using it ever since and I must admit, I am happy. Indilinx has done it, these drives are fast, reliable (provided that you don't upgrade to the latest firmware without waiting a while) and are good enough. We'll see how the drive holds up over the coming months but I don't have any regrets at this point.
If you're trying to move to an SSD at the lowest possible cost, there's finally a real alternative to Intel. We also have Indilinx to thank for driving SSD prices as low as they have been. If these drives weren't actually competitive, Intel would have no real motivation to deliver a sub-$300 SSD so quickly.
All of this Indilinx praise brings us to the next heir to the throne: Intel. The X25-M G2 is an evolution of the SSD that started it all, we see some specific but significant performance gains and hints of Intel's strategy moving forward. The G2's real strength lies in the fact that it is the only Intel drive that will support TRIM later this year. While the G1, even in its used state, will outperform an Indilinx drive - the G2's TRIM support will ensure that it's even faster than the G1.
The only bad thing I have to say about the G2 is that it doesn't address Intel's only weakness: sequential write speed. While on average the G2 is a better performer than the Indilinx drives in real world use, there are distinct situations where it falls behind.
I should also take this time to chastise Intel for absolutely botching the launch of the drive. I'm not talking about the embarrassing stop-shipment caused by poor validation, I'm talking about the fact that X25-M G2s are still out of stock even as I publish this article. The SSD group at Intel clearly needs to take lessons from the CPU teams: you don't launch product without availability.
Many readers have been emailing me asking what SSD they should get for their new Windows 7 builds, honestly the decision mostly comes down to capacity. Look at this table of prices:
| Price | Cost per GB | |
| OCZ Vertex 64GB | $219.99 | $3.437 |
| Intel X25-M 80GB | $279.99 | $3.500 |
| OCZ Vertex 128GB | $369.00 | $2.883 |
| Intel X25-M 160GB | $499.99 | $3.125 |
| OCZ Vertex 256GB | $725.00 | $2.832 |
You should buy the largest drive you need/can afford. If you only have 30GB of data on your system, buy the 64GB Indilinx drive. If you have 50GB? Opt for the 80GB Intel drive. Indilinx and Intel seem to complement one another more than compete thanks to differing numbers of flash channels on their controllers resulting in different capacities.
Is Intel still my overall recommendation? Of course. The random write performance is simply too good to give up and it's only in very specific cases that the 80MB/s sequential write speed hurts you. Is Indilinx a close runner up? Absolutely. It's truly a lower cost alternative. Am I relieved to be done with this article? You betcha.


