Launching the #CPUOverload Project: Testing Every x86 Desktop Processor since 2010
by Dr. Ian Cutress on July 20, 2020 1:30 PM ESTGaming Tests: Final Fantasy XV
Upon arriving to PC, Final Fantasy XV: Windows Edition was given a graphical overhaul as it was ported over from console. As a fantasy RPG with a long history, the fruits of Square-Enix’s successful partnership with NVIDIA are on display. The game uses the internal Luminous Engine, and as with other Final Fantasy games, pushes the imagination of what we can do with the hardware underneath us. To that end, FFXV was one of the first games to promote the use of ‘video game landscape photography’, due in part to the extensive detail even at long range but also with the integration of NVIDIA’s Ansel software, that allowed for super-resolution imagery and post-processing effects to be applied.
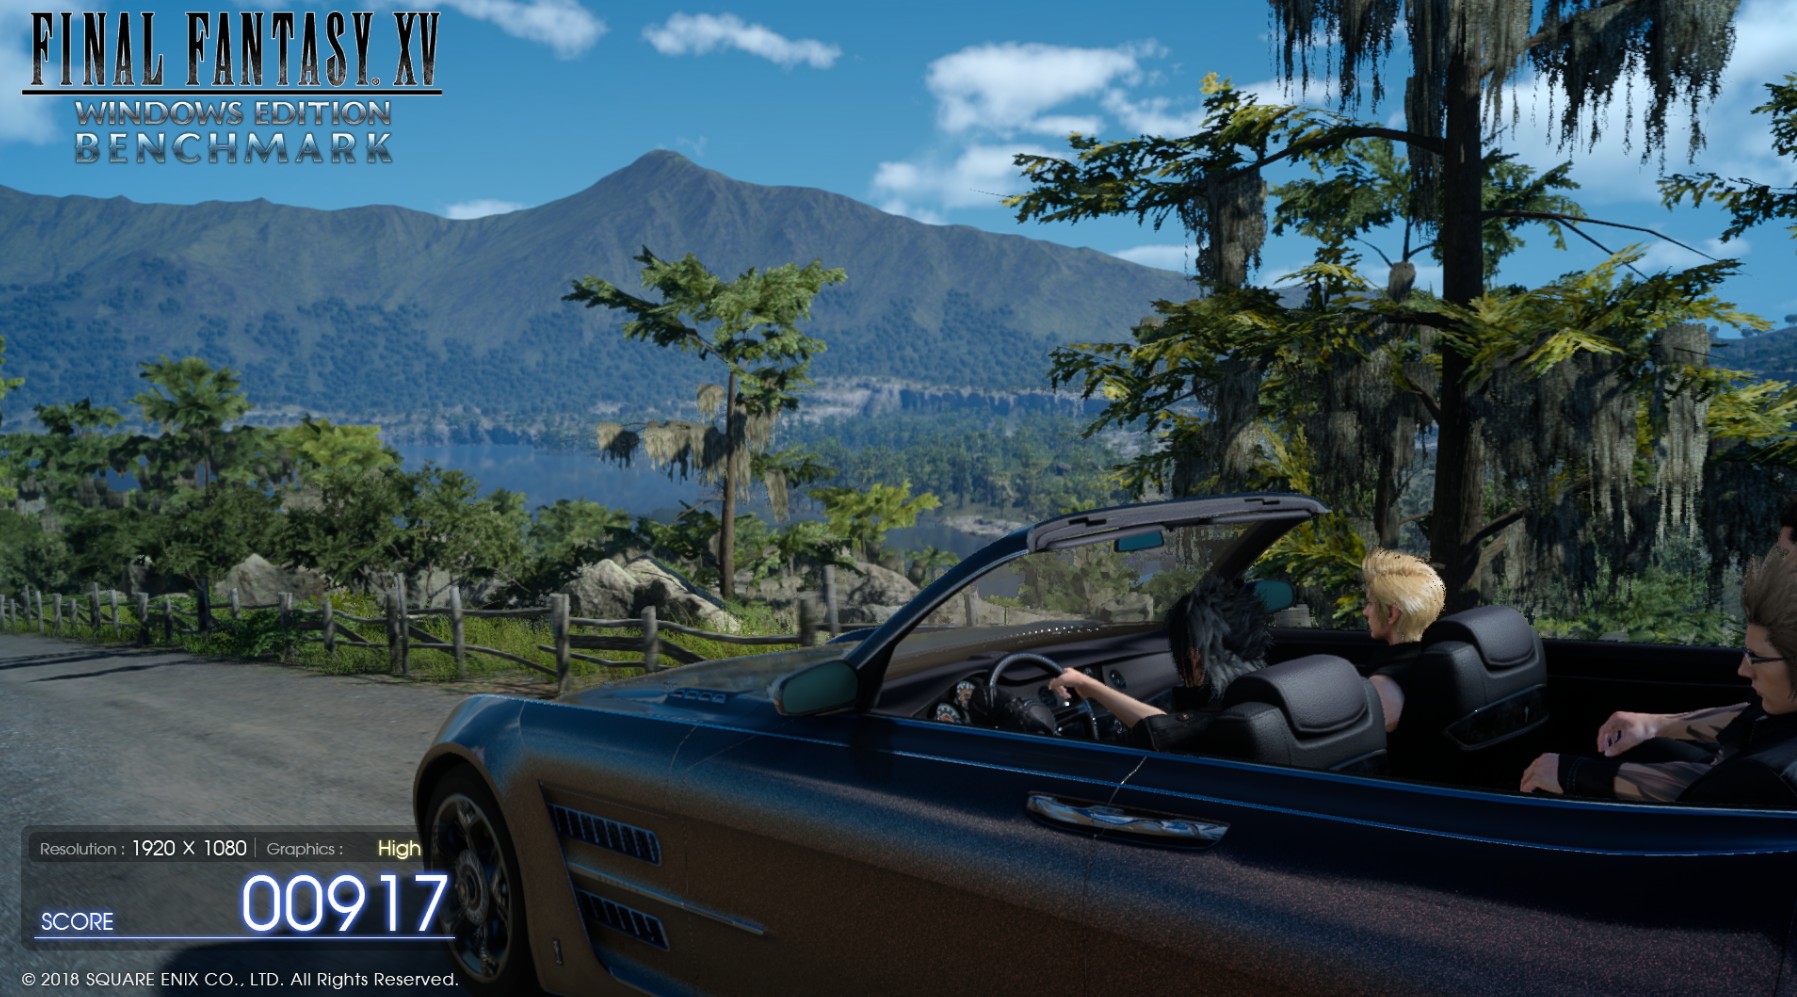
In preparation for the launch of the game, Square Enix opted to release a standalone benchmark. Using the Final Fantasy XV standalone benchmark gives us a lengthy standardized sequence to record, although it should be noted that its heavy use of NVIDIA technology means that the Maximum setting has problems - it renders items off screen. To get around this, we use the standard preset which does not have these issues. We use the following settings:
- 720p Standard
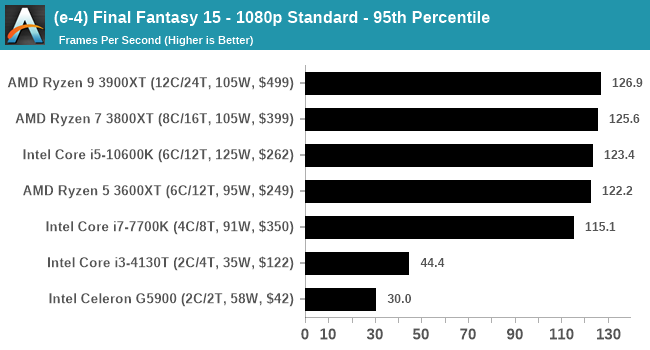
- 1080p Standard
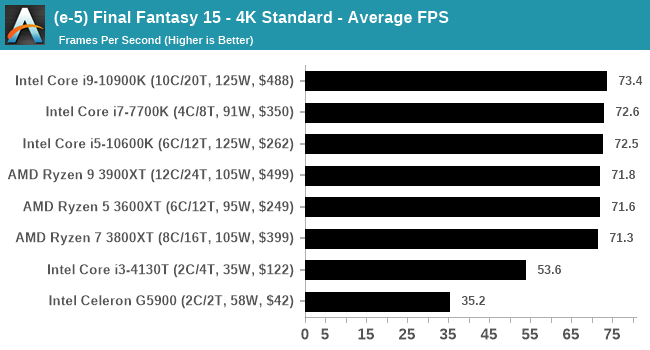
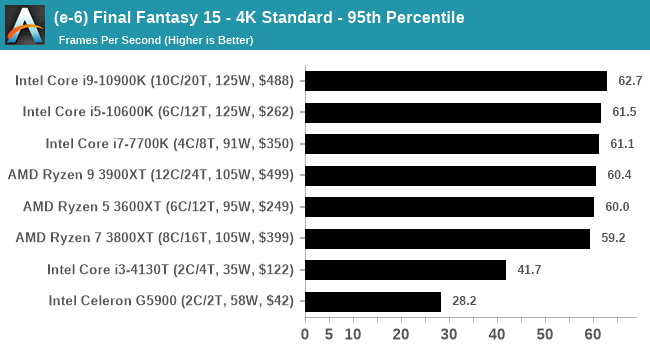
- 4K Standard
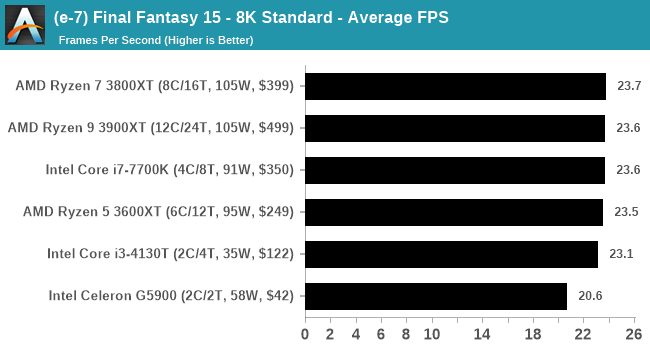
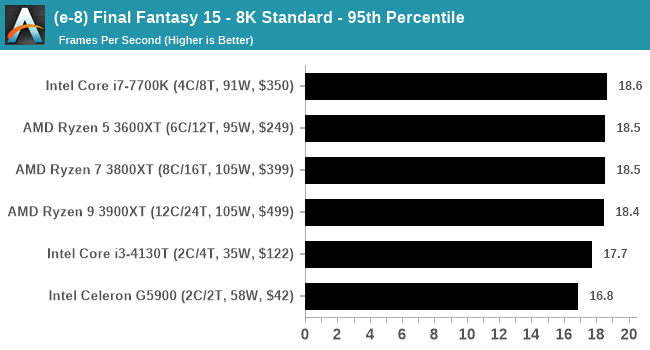
- 8K Standard
For automation, the title accepts command line inputs for both resolution and settings, and then auto-quits when finished. This is what I consider the best type of benchmark! The output file however only deals with average frame rates, and when we started first using the benchmark, I created a FRAPs wrapper to record the six minute benchmark. As with the other benchmarks, we do as many runs until 10 minutes per resolution/setting combination has passed, and then take averages. Realistically, because of the length of this test, this equates to two runs per setting.

| AnandTech | IGP | Low | Medium | High |
| Average FPS |  |
 |
 |
 |
| 95th Percentile | 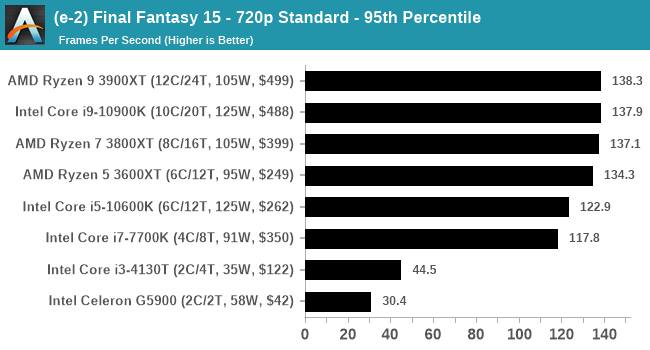 |
 |
 |
 |
All of our benchmark results can also be found in our benchmark engine, Bench.


110 Comments
View All Comments
DiHydro - Monday, July 20, 2020 - link
This is epic. Thank you for doing this.DiHydro - Monday, July 20, 2020 - link
To add a note: I think the ~$300 CPU year-over-year performance would be an interesting metric to see. That price point seems to be pretty popular for enthusiasts, and seeing back 5-6 years how that performance has increased per dollar would be neat.bldr - Monday, July 20, 2020 - link
Agree!close - Monday, July 20, 2020 - link
It will be especially interesting to see those CPUs (the popular mainstream ones) tested now and compared to the numbers they got originally to see how much they lost with all the recent mitigations.close - Tuesday, July 21, 2020 - link
Oh, because I forgot previously, congratulations and good luck with the endeavor! I got exhausted only by reading about the work you're going to have to doFozzie - Monday, July 20, 2020 - link
Except keep in mind that adjusted for inflation $200 in the year 2000 is worth over $300 now.You'd either be making a chart of the increased value over time just due to inflation or in fact the every increasing value at the $300 price point due to the reduced value of the Dollar on top of whatever performance gains occurred.
biosstar - Friday, July 24, 2020 - link
You could also use the value of a dollar in a certain year (let's say 2020) and compare the processors in the inflation adjusted equal categories.PeterCollier - Monday, July 20, 2020 - link
What's the point of this Geekbench/Userbenchmark knockoff? I've never used AT's Bench tool. Especially not for smartphones, since the Bench tool is about 5 years out of date.BushLin - Monday, July 20, 2020 - link
A controlled environment across all tests is reason enough. Even if I don't agree with AT policy on what speed they allow RAM to operate, it is a fair comparison.Byte - Monday, July 20, 2020 - link
RAM is a really important topic. I think at this point in time, we can reasonable put almost maxed out ram for every platform. Like DDR3 can run at 2133, DDR4 we can run it at 3200 as prices are so close.It is like rating sports cars but all have Goodride tires on them.
A dodge viper was a widowmaker when it came out. Today with a good set of summers like PS4S or PZero, you will have a hard time slipping even if you tried.