The AMD Ryzen 9 9950X and Ryzen 9 9900X Review: Flagship Zen 5 Soars - and Stalls
by Gavin Bonshor on August 14, 2024 9:00 AM EST- Posted in
- CPUs
- AMD
- Desktop
- Zen 5
- AM5
- Ryzen 9000
- Ryzen 9 9950X
- Ryzen 9 9900X
SPEC CPU 2017 Performance
SPEC CPU 2017 is a series of standardized tests used to probe the overall performance between different systems, different architectures, different microarchitectures, and setups. The code has to be compiled, and then the results can be submitted to an online database for comparison. It covers a range of integer and floating point workloads, and can be very optimized for each CPU, so it is important to check how the benchmarks are being compiled and run.
We run the tests in a harness built through Windows Subsystem for Linux 1, developed by Andrei Frumusanu. WSL1 has some odd quirks, with one test not running due to a fixed stack size, but for like-for-like testing it is good enough. Because our scores aren’t official submissions, as per SPEC guidelines we have to declare them as internal estimates on our part.
For the launch of the Ryzen 9000 desktop chips, we've built a fresh set of binaries to better take advantage of the Zen 5 architecture. Specifically, as these are the first consumer chips since 2021's Rocket Lake (11th Gen Core) to offer AVX-512 support with a full, 512-bit wide SIMD backing it, we've built a new set of binaries to make use of the feature.
For compilers, we use LLVM/Clang for the C/C++ tests, and for Fortran tests we’re using GCC's GFortran. Ont he whole, LLVM offers better cross-platform comparisons, especially to platforms that only have LLVM support. However LLVM's modern Fortran compiler, LLVM Flang (aka Flang-new), is not production ready, whereas GFortran is. As always, we’re not considering closed-source compilers such as MSVC or ICC.
clang version 18.1.8

gfortran version 14.2.0
-Ofast -fomit-frame-pointer

-march=[x86-64-3 or x86-64-4, depending on chip's supported ISA]
Our compiler flags are straightforward, with basic –Ofast and relevant ISA switches. Because it's not possible to build a single set of binaries that offer AVX-512 support while still gracefully falling back to AVX2 on platforms that lack the feature, we're technically running two sets of binaries on x86 platforms. AVX-512 processors get binaries compbiled with the -march=x86-64-4 flag, while all other x86 platforms get -march=x86-64-3. And note that while scores are similar overall, the results from these new binaries are not comparable to our previous binaries, due to the significant compiler changes in the last few years.
To note, the requirements for the SPEC license state that any benchmark results from SPEC have to be labeled ‘estimated’ until they are verified on the SPEC website as a meaningful representation of the expected performance. This is most often done by the big companies and OEMs to showcase performance to customers, however is quite over the top for what we do as reviewers.
Single-Threaded (Rate-1) Results
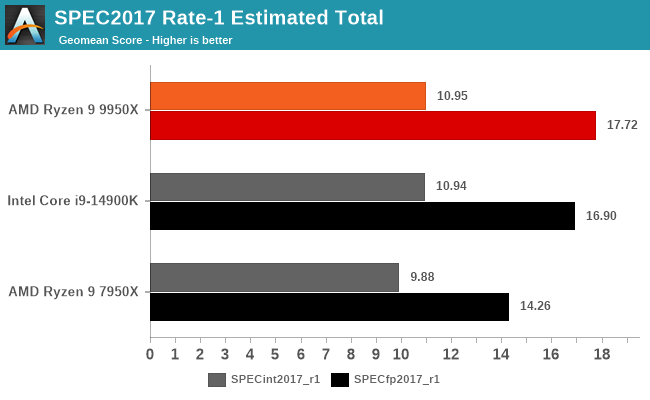
Starting, as always, with our single-threaded (rate-1) scores, we find a very similar picture as to last week’s Ryzen 7 9700X review. The Ryzen 9 9950X offers peak turbo clockspeeds 200MHz (~4%) higher than the 9700X, but as these benchmarks otherwise don’t push its additional cores (or cache), the 9950X lives up to being a version of Granite Ridge with more CPU cores.
Compared to AMD’s 16 core Zen 4 monster, the 9950X sees solid single-threaded performance gains here, picking up 11% in integer performance, and that hefty 24% bump in floating point performance. The 9950X has the same peak clockspeed as its last-generation counterpart, so this is being driven purely by chip IPC and memory bandwidth here.
Though high clockspeeds also mean that the 9950X only edges out Intel’s Core i9-14900K in the integer tests by the smallest margin – 0.01 points – a statistical dead heat, given our margin for error. The higher IPC of Zen 5 has lifted AMD a lot here, but running at 6GHz (and consuming every joule in sight while doing so) comes with its own performance perks. On the other hand, AMD scores a 5% advantage in floating point performance, keeping the 9950X ahead of Intel’s aging flagship chip.
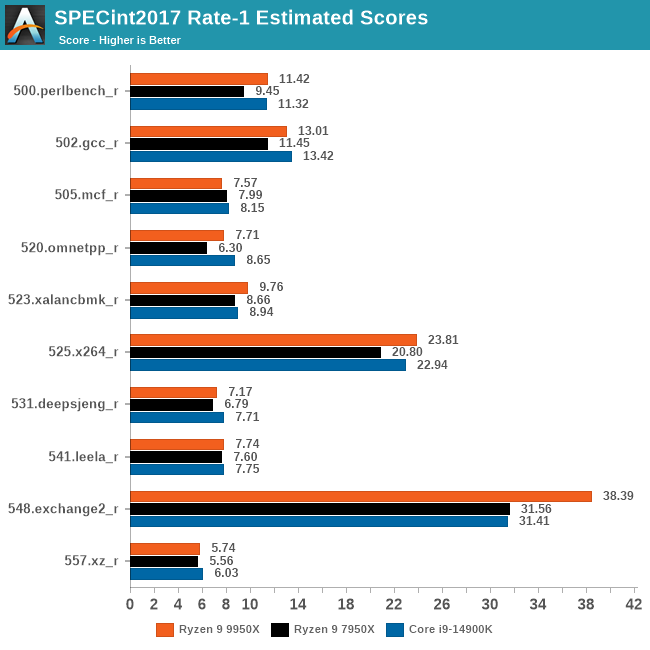
And breaking things down to the individual scores, things once again look similar to what we saw with the 9700X last week. To quote: we find a near-consistent performance improvement for the 9700X. With the exception of stubborn 505.mcf, the Zen 5 chip is always improving on its predecessor. The biggest gains coming in 500.perlbench, 525.x264, and the Forfran-focused 548.exchange2. Overall, the sub-tests tend to cluster in to two groups: about half the tests show minimal performance uplift, and the other half show extensive performance uplifts. This reflects the wide variety of workloads used by the sub-tests, and how not every workload is going to extensively benefit from AMD's architectural advances.
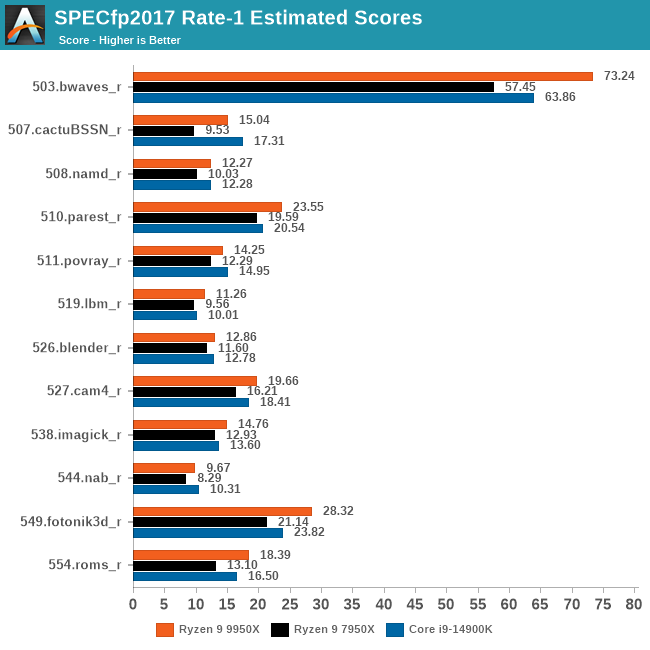
Coming from our geomean averages, where we saw that the 9950X beat the 7950X by 24%, looking at our individual scores we can see that AMD has significantly improved their floating point performance across virtually the entire board. Not only does the 9950X cleanly beat the 7950X in every last test here, but no sub-test score improves by less than 10%.
Multi-Threaded (Rate-N) Results
Shifting gears to multi-threaded performance, we have the SPEC CPU 2017 rate-N tests, where we run (nearly) as many copies of SPEC CPU 2017 as there are threads. Rate-N testing doesn't test core-to-core communication much, but it does push throughput hard, as upwards of 24 threads are vying for cache, memory, and other resources.
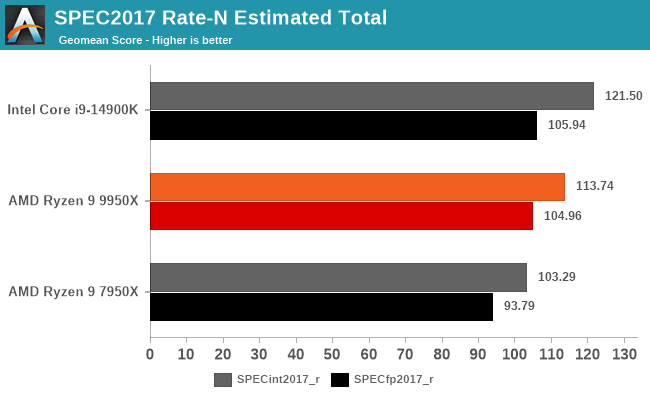
Broadly speaking, the Ryzen 9 9950X sees a similar uplift over the 7950X here in multi-threaded results as it does single-threaded results. Scaling up SPEC to fill all of the Zen 5 cores doesn’t expose any immediate weaknesses that hamper Zen 5 exclusively. So the 9950X picks up 10% in integer performance, and 19% in floating point performance over the past generation of Ryzen.
Despite that, AMD doesn’t win the multi-threaded performance race here. The Core i9-14900K, with its ridiculous 24 CPU cores, still holds the top spot, fending off even the faster 9950X. Ultimately, this is the kind of scenario Intel’s P+E core configuration is optimized for, so the outcome isn’t surprising. But at the same time, keep in mind that the 14900K is drawing over 250 Watts here, significantly more power than the Ryzen 9 9950X. Winning comes at a cost.
And while we’re looking at multi-threaded performance, I also thought it would be interesting to throw up a chart showcasing the multi-threaded to single-threaded performance ratios for all three chips. Just how much of a total throughput uplift are we getting by filling up all of the cores on these CPUs?
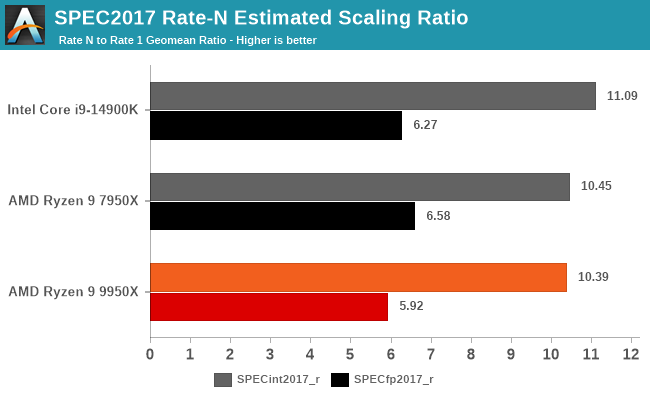
The answer is a bit surprising. While all three chips and all three architectures show a similar degree of scaling – 10-11x in integer workloads and 6-6.5x in floating point workloads – there is enough of a difference between the chips to draw some meaningful results. And it’s the newest Ryzen 9 9950X that actually sees the lowest scaling ratio among the chips here.
There are a multitude of reasons that SPEC benchmarks don’t naively scale with the number of CPU cores. Chief among these is memory and cache contention – it’s one thing when 1 copy gets all the resources to itself, and another thing when there are 15 more copies vying for those resources – as well as general saturation of interconnects and other buses. This is especially true in floating point workloads, where all of these chips are running out of gas to further improve throughput at around 6 copies.
But the Zen 5-based 9950X is just a bit worse for the wear. On a relative basis, it’s only getting around 90% of the ST-to-MT uplift as the 7950X was in floating point workloads, while it’s effectively tied in performance scaling for integer workloads.
Based on what we know about the Zen 5 architecture, as well as the Granite Ridge chip overall, the reasonable guess here is that we’re seeing AMD’s uncore – the memory controllers and attached Infinity Fabric – stretched to its limit. Since AMD reused the original Ryzen 7000 IOD for Ryzen 9000, the only additional resources available to feed the CPU cores is the slightly higher bandwidth of DDR5-5600 memory. All other cache and interconnect bottlenecks remain.
Consequently, when floating point performance in a single thread improves by a hefty 24%, that’s 24% more traffic through the caches and uncore/IOD to keep those CPU cores fed. And those resources aren’t quite there. To be sure, 9950X doesn’t hit a scaling wall here, as multi-threaded floating point performance is still ahead of the 7950X by 19% overall. But it’s just a bit worse – and enough so that we can measure it. I can only surmise that Zen 5 would have gladly taken more memory bandwidth and IF bandwidth if those were available. Thankfully for AMD, Rate results don’t rely on inter-thread communication, so there aren’t any hazards from threads from different CCDs talking to each other over the IF links.
As for the performance impact of more L3 cache, we’ll get to see what happens there once AMD releases the obligatory X3D chips.
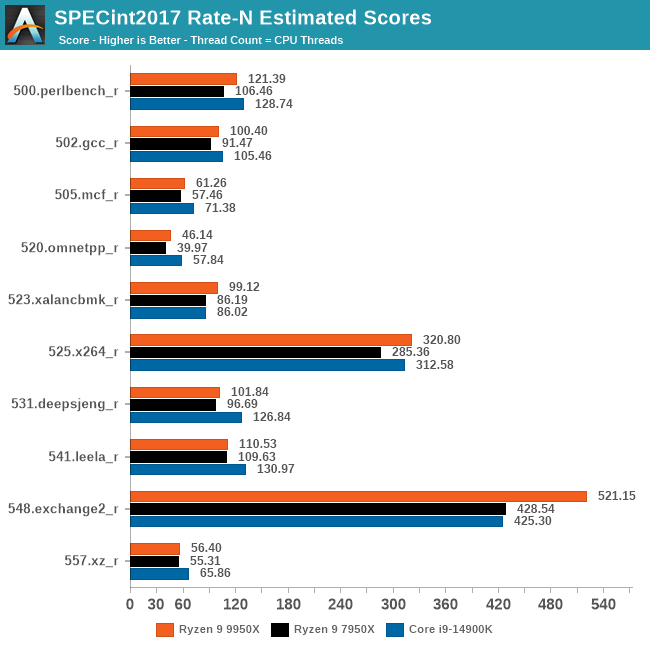
Finally, breaking down our multi-threaded results to the individual benchmarks, Rate-N integer results look a lot like Rate-1, just with higher scores overall. The same tests that showed minimal uplift with a single thread show minimal uplift with 16 threads. Meanwhile tests like 548.exchange2 are showing sizable gen-on-gen performance uplifts.
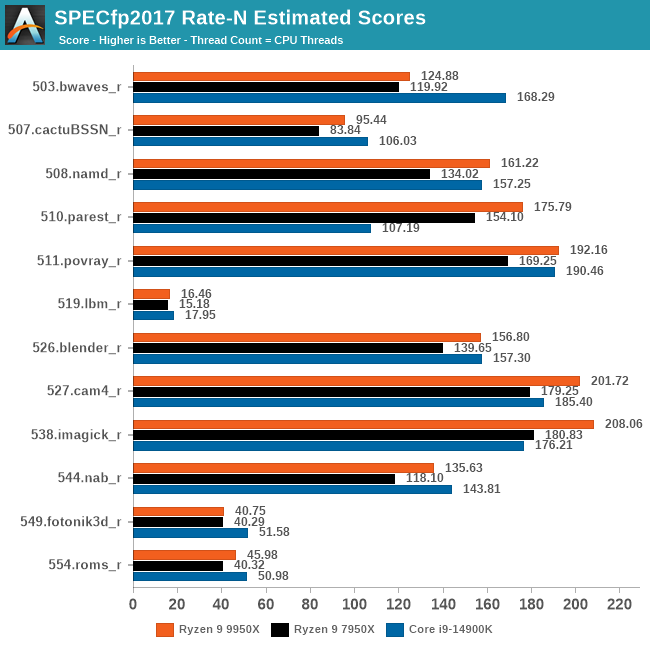
And with Rate-N floating point, we also get a similar stack. The 9950X always improves upon the 7950X, but in a handful of benchmarks not by a lot, presumably due to overall resource contention within the chip. Compared to the 14900K, the 9950X fares relatively well here overall, but there are a couple of tests where AMD still can’t catch Intel’s flagship, particularly in 503.bwaves, which is notoriously sensitive to memory subsystem performance.


123 Comments
View All Comments
Khanan - Wednesday, August 14, 2024 - link
“AMD has doubled the amount of L2 cache per core on Zen 5 to 1 MB, which is up from 512KB per Zen 4 core.”This isn’t right. L2 cache was already doubled from Zen 3 to Zen 4 to 1 MB, you already did this mistake a few times now.
Ryan Smith - Wednesday, August 14, 2024 - link
You are correct! That has been fixed. Thank you.eva02langley - Wednesday, August 14, 2024 - link
I saw Steve and Steve still going strong with their nonsense. They were complaining again so I came here to have a REAL CPU review.Good old Anandtech is still setting the bar for what I should expect in a CPU review.
Khanan - Wednesday, August 14, 2024 - link
I mean the chief reason for these architectures, as AMD uses Zen 5 chiplets also in the server, is the server or data center not desktops - that’s where the big money is. And after that laptops. So AMD doesn’t worry too much about those gaming YouTubers that hype everything as YouTubers always do despite it not making too much sense or having low relevance. What those want is the X3D processors anyway, those are for the gamers specifically, these aren’t as much, these are general architectures reused for the desktop (just not 1:1 in the laptop anymore).eva02langley - Wednesday, August 14, 2024 - link
You don't teach me anything, I know that already.My point is that they are complaining because they are focusing on games while a CPU IPC is NOT limited to gaming, on the contrary, it is a really small portion of it.
Phoronix came out with a 17.5% geomean over the 7950x, well inline or even better than AMD's 16% IPC uplift.
thestryker - Wednesday, August 14, 2024 - link
Keep in mind the only reason Phoronix saw that much uplift is the AVX512 change not because they're actually that much improved. They mentioned at the end of the review that they'll be doing further testing without AVX512 for comparisons.Oxford Guy - Friday, August 16, 2024 - link
Greatly improved AVX-512 is more of an improvement than we've seen from some CPU releases.coburn_c - Wednesday, August 14, 2024 - link
Not true at all, GN repeatedly said don't buy these chips for gaming. YOU are complaining without focusing, and you look like a clown.Gothmoth - Saturday, August 24, 2024 - link
indeed he looks like a very dumb clown.....Lonyo - Thursday, August 15, 2024 - link
GAMERS Nexus is focusing on GAME performance?