The Samsung Galaxy S7 & S7 Edge Review, Part 1
by Joshua Ho on March 8, 2016 9:00 AM ESTSoC Performance
While we’re ready to move on to newer benchmarks for 2016, our system performance benchmarks from 2015 are still going to provide a pretty good idea for what to expect from the Galaxy S7 and Snapdragon 820 by extension. For those that are unfamiliar with what the Snapdragon 820 is, I’d reference our previous articles on the Snapdragon 820.
In essence, we’re looking at a 2x2 CPU configuration with 2.15 GHz Kryo cores for the performance cluster, and 1.6 GHz Kryo cores for the efficiency cluster. Binding the two clusters together are some power aware scheduling at the kernel level and a custom interconnect to handle coherency between the two clusters. Memory is also improved relative to the Snapdragon 810, with a bump to LPDDR4-1866 over the former's LPDDR4-1600. Of course, there's a lot more to talk about here, but for now we can simply look at how the Snapdragon 820 compares in our benchmarks.
Update: As we've had a few questions on the subject, I just want to clarify browser testing. Samsung's stock browser was not included with our Verizon-branded sample phone, nor is it possible to install it at this time. As a result we are unable to test the performance of Samsung's browser. The Verge reports that this is a Verizon decision and that all Verizon phones will be shipping like this; so for these phones Chrome is the de-facto stock browser.
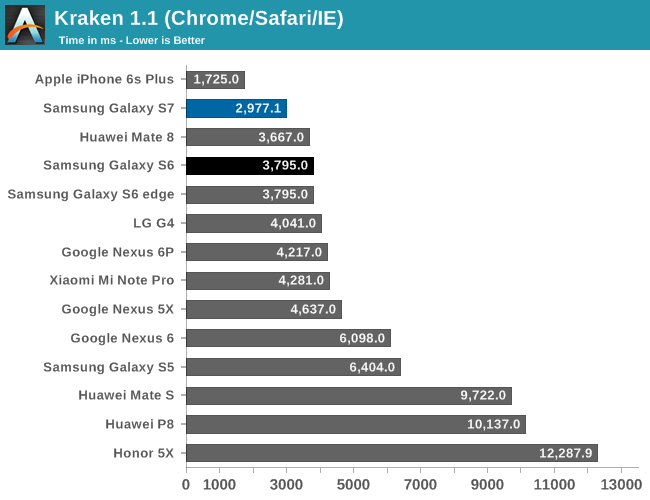
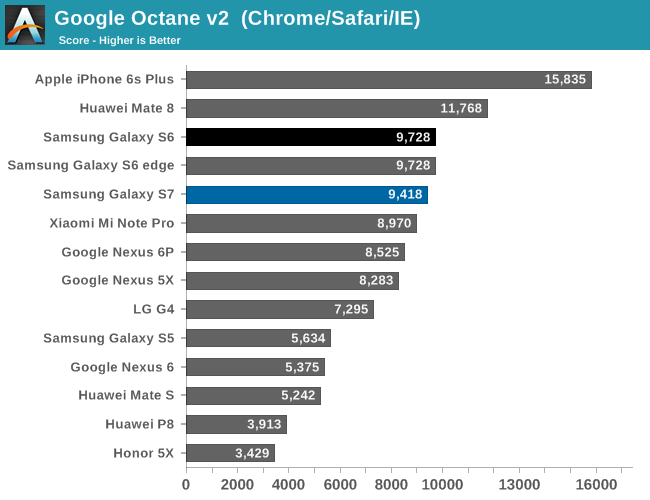
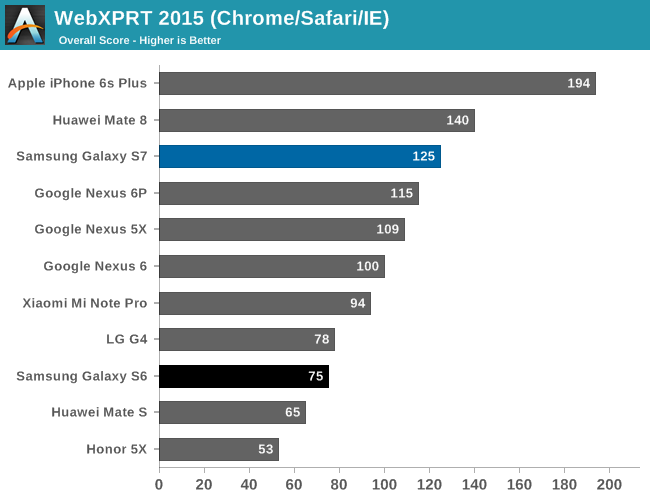
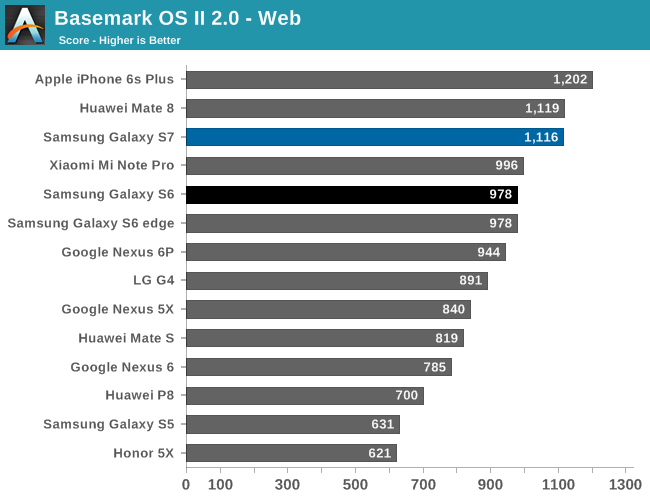
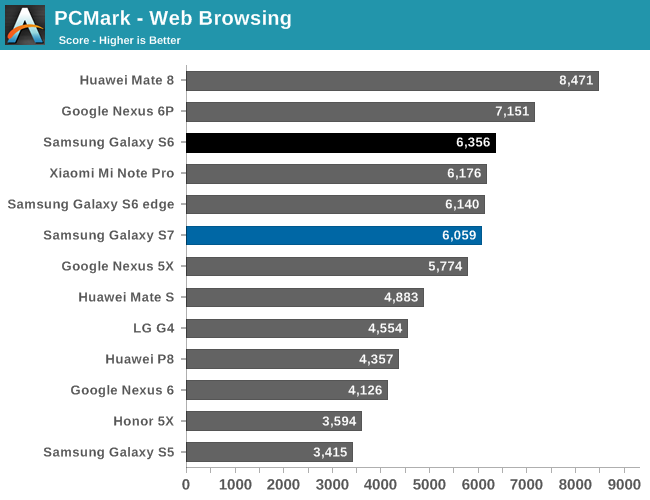
Starting off with our web benchmarks, we can see that in the time since our initial testing of the Snapdragon 820 MDP there have been some major improvements to how well Chrome is optimized for Kryo. As a result we're seeing results that are almost comparable to Snapdragon Browser in Chrome.
Overall then the Galaxy S7 and its Snapdragon 820 SoC won't top the charts on web benchmarks - Apple still holds an edge here - however the Galaxy S7 puts up a solid fight. The one drawback here is that the Mate 8 and its Cortex A72 CPU seems to have the edge over the Galaxy S7.
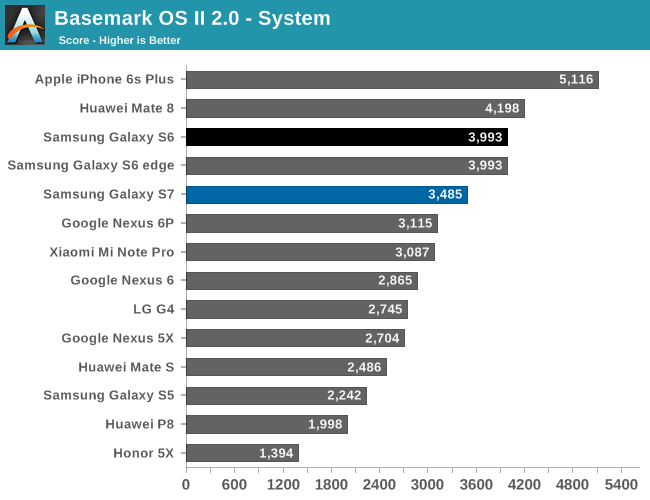
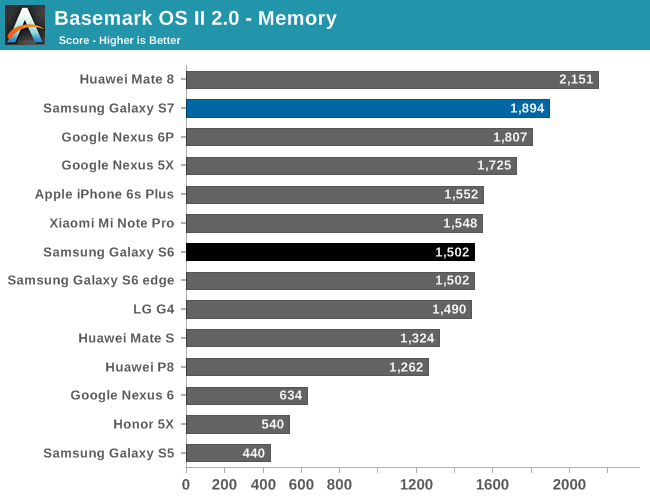
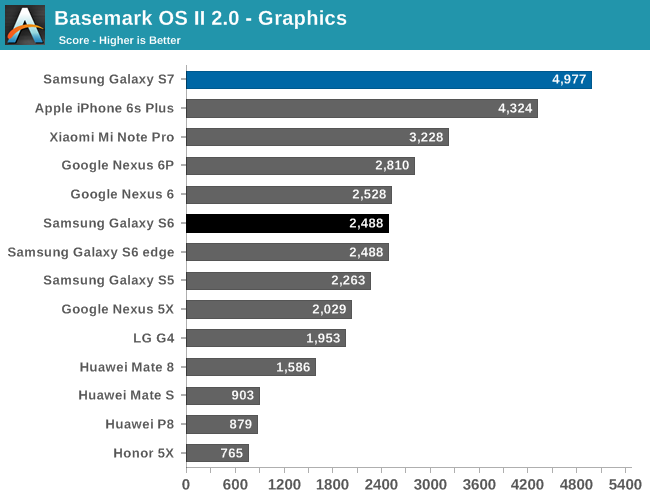
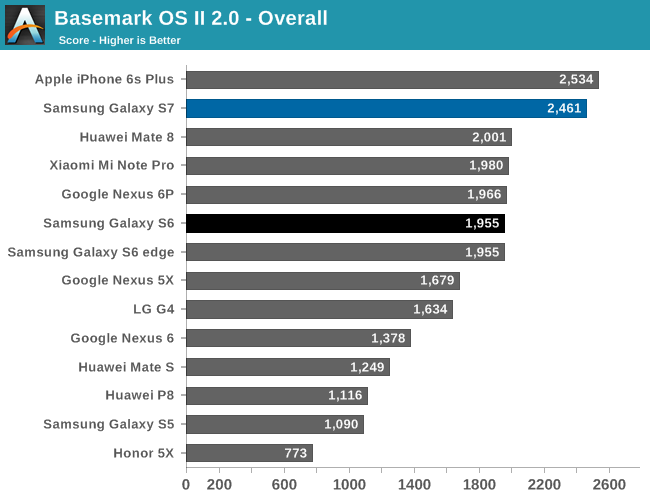
In Basemark OS II the combination of a better GPU, better NAND, and better single thread CPU performance seems to be enough for the Galaxy S7 to approach the iPhone 6s Plus in overall performance. While the system benchmark shows that Kryo isn't quite going toe to toe with Twister, the Adreno 530 helps to narrow the gap in the graphics test.
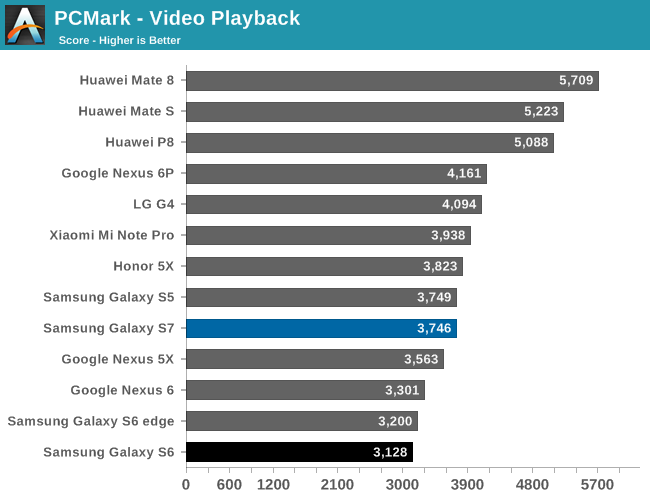
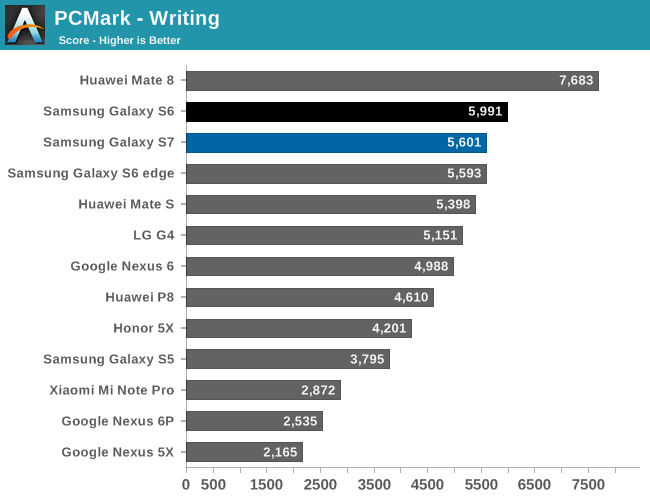
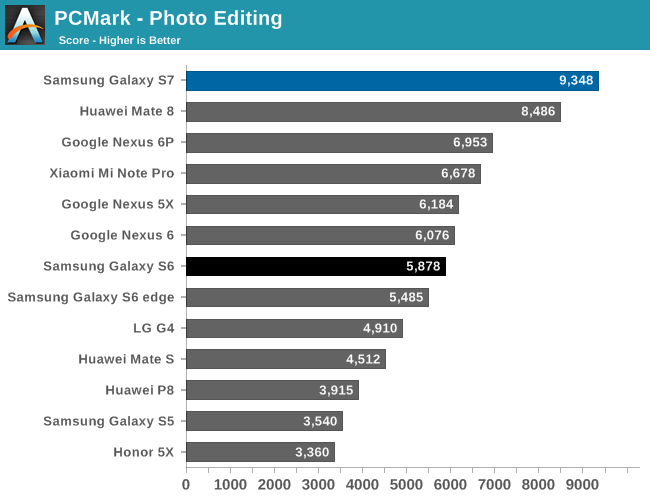
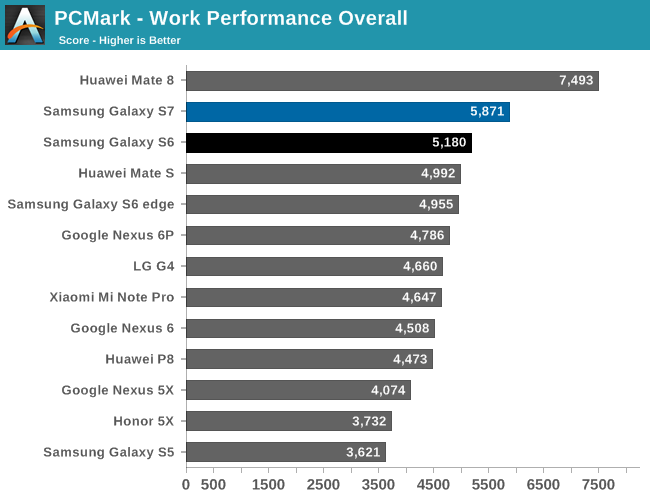
In PCMark, we can see that the Galaxy S7 is mostly comparable to the Galaxy S6. However major improvements in areas like GPU performance help to give it an overall advantage relative to the Galaxy S6 in the photo editing test. Given that this is basically a test of API-level performance, it's likely that Samsung's frameworks and governor settings lead to mostly similar performance in these tests.
Overall, the Snapdragon 820 appears to provide a pretty healthy bump in performance over almost every SoC seen in 2015, although it's hard to declare a clear winner when comparing it to Apple's A9 or Huawei's Kirin 950. If you glanced at the battery life graphs and the performance graphs above it's pretty obvious that Qualcomm has made some enormous strides here. While not quite going from zero to hero, Qualcomm has come close, and that definitely deserves some credit.
NAND Performance
If you think about the memory hierarchy, while RAM and cache are important, at the end of the day the most important aspect is the base storage. Even if you have infinite RAM and cache, if your storage is sufficiently slow the user experience is going to be painful for at least the first time you have to load something.
In order to test this, we use our standard test of AndroBench with 4 KB and 256 KB reads and writes for random and sequential tests. I went ahead and did some digging around to figure out exactly what it is we’re testing in the Galaxy S7, and it turns out that while the Galaxy S7 storage solution is similar to what’s in the Galaxy S6 and S6 edge, it isn’t quite the same. The Galaxy S7 UFS storage identifies itself as the KLUBG4G1CE-B0B1, which looks to be in the same family and appears to have been released at pretty much the same time as the Galaxy S6 storage solution, but the model number isn’t quite the same.
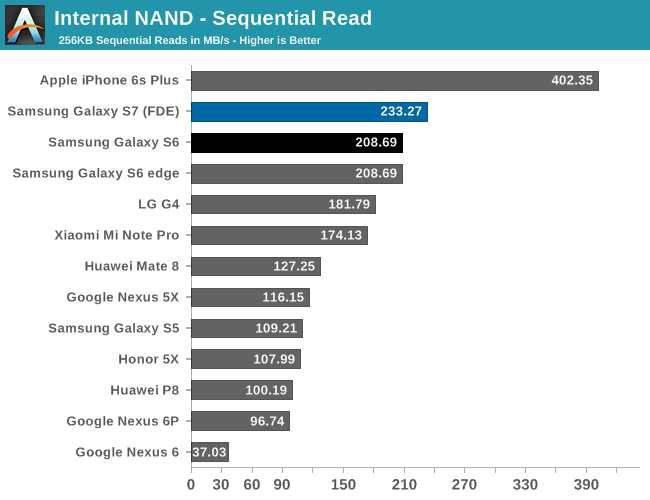
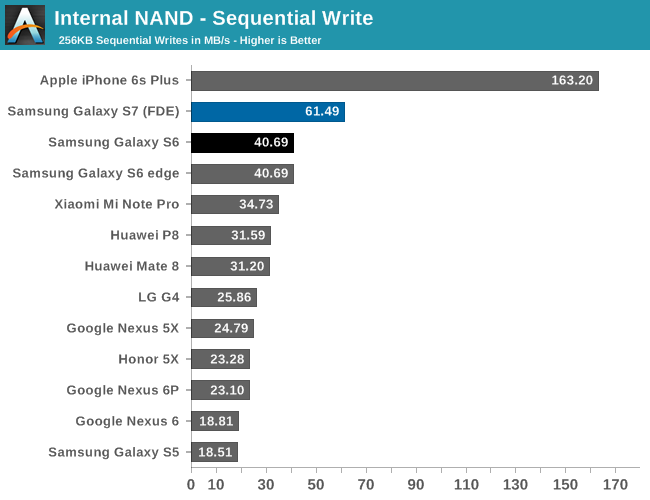
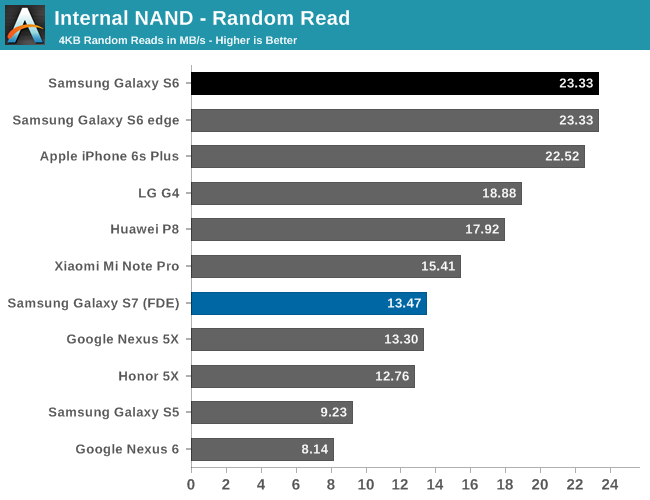
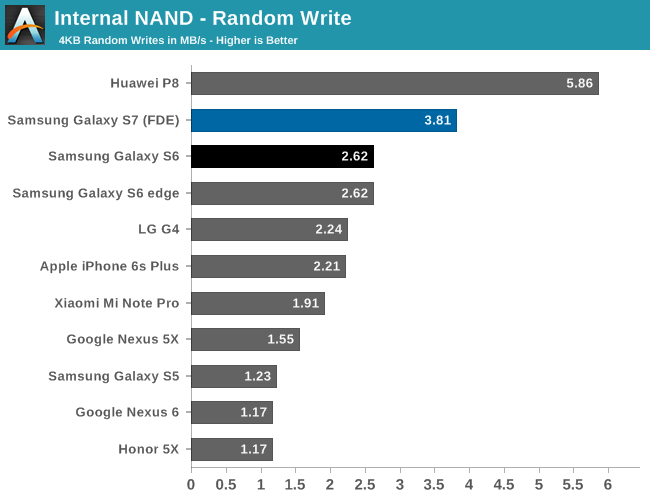
Looking at the performance results, we can also see that the Galaxy S7 is pretty similar to the Galaxy S6 in storage performance at a high level. Interestingly enough despite using full disk encryption on the Galaxy S7, we don’t really see a noticeable degradation in performance relative to the Galaxy S6 which is good to see considering the number of Android devices that do have noticeable performance effects when enabling FDE.


202 Comments
View All Comments
jjj - Tuesday, March 8, 2016 - link
As for battery tests, as long as you don't simulate a bunch of social, IM, news apps in the backgroud, you can't get close to good results when you got so many diff core configs.retrospooty - Tuesday, March 8, 2016 - link
"s long as you don't simulate a bunch of social, IM, news apps in the backgroud, you can't get close to good results when you got so many diff core configs"You have to have consistent methodology to test against other phones. The point is not to show what you might get with your particular social/newsfeed apps running, the point is to test against other phones to see how it compares under the same set of circumstances so you know which one gets better life.
jjj - Tuesday, March 8, 2016 - link
Sorry but you failed to understand my points.It would be consistent ,if it is simulated.
The point is to have relatively relevant data and only by including at least that you can get such data. These apps have major impact on battery life- and it's not just FB even if they were the only ones that got a lot of bad press recently.
The different core configs - 2 big cores, 4 big cores in 2+2, then 4+4, 2+4+4, or just 8 will result in very different power usage for these background apps, as a % of total battery life, sometimes changing the rankings. Here for example, chances are the Exynos would get a significant boost vs the SD820 if such tasks were factored in.
How many such simulated tasks should be included in the test is debatable and also depends on the audience, chances are that the AT reader has a few on average.
retrospooty - Tuesday, March 8, 2016 - link
And you are missing mine as well... If you have a million users, you will have 10,000 different sets of apps. You cant just randomly pick and call it a benchmark. The methodology and the point it to measure a simple test against other phones without adding too many variables. I get what you want, but its a bit like saying "i wish your test suite tested my exact configuration" and that just isnt logical from a test perspective.jjj - Tuesday, March 8, 2016 - link
What i want is results with some relevance.The results have no relevance as they are, as actual usage is significantly different. In actual usage the rankings change because the core configs are so different. The difference is like what VW had in testing vs road conditions, huge difference.
To obtain relevant results you need somewhat realistic scenarios with a methodology that doesn't ignore big things that can turn the rankings upside down. Remember that the entire point of bigLITTLE is power and these background tasks are just the right thing for the little cores.
retrospooty - Tuesday, March 8, 2016 - link
relevant to who? I use zero social media apps and have no news feeds running at all until I launch feedly. Relevant to you is not relevant to everyone or even to most people. This site is a fairly high traffic site (for tech anyhow) and they have to test for the many, not the few. The methodology is sound. I see what you want and why you want it, but it doesn't work for "the many"jjj - Tuesday, March 8, 2016 - link
Relevant to the average user. I don't use social at all but that has no relevance as the tests should be relevant to the bulk of the users. And the bulk of the users do use those (that's a verifiable fact) and more. This methodology just favors fewer cores and penalizes bigLITTLE.retrospooty - Tuesday, March 8, 2016 - link
Its still too unpredictable. One persons Facebook feed may go nuts all day while anothers is relatively calm. This is also why specific battery ratings are never given by manufacturers... Because usage varies too much. This is why sites test a (mostly) controllable methodology against other phones to see which fares the best. I find it highly useful and when you get into the nuts and bolts, it's necessary. If you had a bunch of phones and actually started trying to test as you mentioned you would find a can of worms and inconsistent results at the end of your work...jjj - Wednesday, March 9, 2016 - link
"Its still too unpredictable" - that's the case with browsing usage too, even more so there but you can try to select a load that is representative. You might have forgotten that i said simulate such apps, there wouldn't be any difference between runs.Yes testing battery life is complex and there are a bunch of other things that could be done for better results but these apps are pretty universal and a rather big drain on resources.They could be ignored if we didn't had so many core configs but we do and that matters. Complexity for the sake of it is not a good idea but complexity that results in much better results is not something we should be afraid of.
10 years later smartphone benchmarking is just terrible. All synthetic and many of those apps are not even half decent. Even worse, after last year's mess 99% of reviews made no attempt to look at throttling. That wouldn't have happened in PC even 10 years ago.
retrospooty - Wednesday, March 9, 2016 - link
I think you are a little too hung up on benchmarks. It is just a sampling, an attempt at measuring with the goal to compare to others to help people decide, but what really matters is what it does and how well it does it. I find it highly useful even if not exact to my own usage. If unit A lasts 20 hours and unit B lasts 16 hours in the standard tests, but I know my own usage gets 80% of what standard is I can estimate my usage will be 16 hours on unit A and 12.8 hours on unit B (give or take). It really doesn't need to be more complicated than that since testing batteries is not an exact science, not even on PC/laptops as usage varies there just hte same. That is why there are no exact guarantees. "Up to X hours" is a standard explanation. It is what it is.