AMD Athlon 64 FX-60: A Dual-Core farewell to Socket-939
by Anand Lal Shimpi on January 9, 2006 11:59 PM EST- Posted in
- CPUs
Media Encoding Performance using DVD Shrink, WME9, Quicktime and iTunes
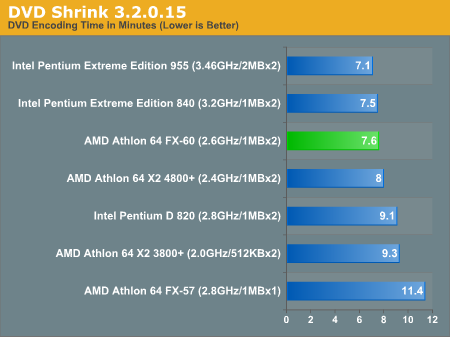
First up is DVD Shrink 3.2.0.15. Our test was simple - we took a copy of Star Wars Episode VI and ripped the full DVD to the hard drive without compression, effectively giving us an exact copy of the disc on the hard drive. Then, using the copy of the DVD on the hard drive (to eliminate any DVD drive bottlenecks), we performed a DVD shrink operation to shrink the movie to fit on a single 4.5GB DVD disc. All of the options were left on their defaults, so the test ends up being pretty easy to run and reproduce. The scores reported are DVD encoding times in minutes, with lower numbers meaning better performance.
The DVD Shrink test is quite important as DVD Shrink is quite possibly one of the easiest tools to rip a DVD. The easier a tool is to use, the more likely it's going to be used, and arguably the more important performance using it happens to be.
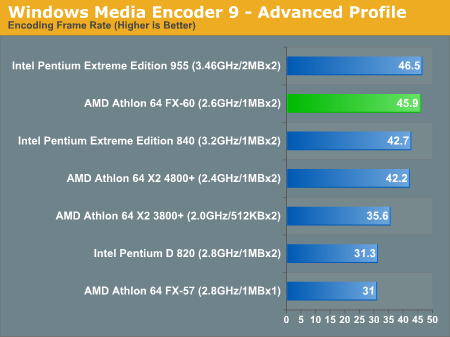
Moving on, we have our Windows Media Encoder 9 test, which uses the advanced profile settings for video encoding. We left all settings at their defaults and just proceeded with a MPEG-2 to WMV-HD conversion. The values reported are in frames per second, with higher numbers being better.
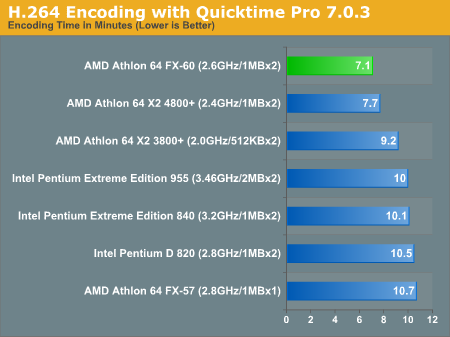
Next up, we have Quicktime Pro 7.0.3 and we perform a MPEG-2 to H.264 encoding task. All of the settings are left at their defaults, with the exception that we optimize the output file for download with a 256kbps data rate while leaving the resolution untouched. We also adjust the video options to optimize for the best quality. We report the transcoding time in minutes, with lower values being better.
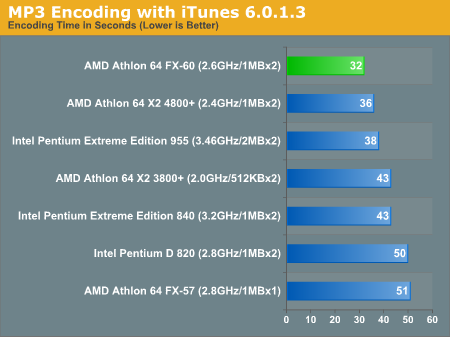
Finally, we have a MP3 encoding test using iTunes 6.0.1.3. For this test, we simply took a 304MB wav file and converted it to a 192kbps MP3 file, measuring the encode time in seconds. The only iTunes option that we changed was to prevent the playback of the song while encoding.
First up is DVD Shrink 3.2.0.15. Our test was simple - we took a copy of Star Wars Episode VI and ripped the full DVD to the hard drive without compression, effectively giving us an exact copy of the disc on the hard drive. Then, using the copy of the DVD on the hard drive (to eliminate any DVD drive bottlenecks), we performed a DVD shrink operation to shrink the movie to fit on a single 4.5GB DVD disc. All of the options were left on their defaults, so the test ends up being pretty easy to run and reproduce. The scores reported are DVD encoding times in minutes, with lower numbers meaning better performance.
The DVD Shrink test is quite important as DVD Shrink is quite possibly one of the easiest tools to rip a DVD. The easier a tool is to use, the more likely it's going to be used, and arguably the more important performance using it happens to be.
Moving on, we have our Windows Media Encoder 9 test, which uses the advanced profile settings for video encoding. We left all settings at their defaults and just proceeded with a MPEG-2 to WMV-HD conversion. The values reported are in frames per second, with higher numbers being better.
Next up, we have Quicktime Pro 7.0.3 and we perform a MPEG-2 to H.264 encoding task. All of the settings are left at their defaults, with the exception that we optimize the output file for download with a 256kbps data rate while leaving the resolution untouched. We also adjust the video options to optimize for the best quality. We report the transcoding time in minutes, with lower values being better.
Finally, we have a MP3 encoding test using iTunes 6.0.1.3. For this test, we simply took a 304MB wav file and converted it to a 192kbps MP3 file, measuring the encode time in seconds. The only iTunes option that we changed was to prevent the playback of the song while encoding.
3D Rendering Performance using 3dsmax 7
Gaming Performance using Battlefield 2, Call of Duty 2 and Quake 4


94 Comments
View All Comments
Betwon - Tuesday, January 10, 2006 - link
Yes, It is well known that P4 need more power than X2, but P4 is still able to overclock.While X2 need less power than P4, but both of them(anand & xbitlabs) find that they can't OC X2 any more (15X).
Betwon - Tuesday, January 10, 2006 - link
In fact, those tests show that:X2 is overclocked in those benchmarks still slower then P4.
We find the truth.
Without OC:
955 is 3.46GHz, FX-60 is 2.6GHz --> the ratio is 1.33 (3.46/2.6). -->In most tests, X2 is better than P4.
OC:
955 is 4.26GHz, FX-60 is 2.9GHz -->Now, the ratio is 1.46 (4.26/2.9). -->P4 starts to be better than X2.
It is very simple:
The ratio
flyck - Tuesday, January 10, 2006 - link
p4 wins one test the others it is way behind. you reversed it. p4 overclocked is still slower in those benchmarks.
overclocked
FX 2.8/ FX 2.6/ XE 4.266
UT 2004 : 95.8 / 90.5 / 82.4
Cinebench : 963 / 891 / 928
only tests they did overclocked. p4 wins none of them. it is just edges above or around the normal FX 60.
ow yeah your ratio... you have found a way for perfect scaling ? great, there will be people intrested....
not even talking about the fact that your primary ratio is wrong because @ those frequencys p4 wins nonthing, so is not even equal. and oced is comes close it will probably win some and lose some (like in those 2 test) so then they are about equal.
so the more accurate ratio will be 1.40-1.50. for equal performance. in which case p 4 should run above 4.5GHz before it has a noticeable gap over the FX60 overall.....
Betwon - Tuesday, January 10, 2006 - link
P4 better than X2.Ratio is the key.
The ratio below 1.33 -- P4 is behide.
ratio above 1.4x -- P4 is competitive. Intel 4.26GHz VS AMD 2.9GHz
For the ratio of intel 820 VS AMD 3800+ 165 170? see the benchmark of spec cpu2000 rates for 2 core 1 chip:
The float point performance(under windows OS/32-bit):
PD 820 SPECfp_rate_base2000 29.9 SPECfp_rate2000 30.0
http://www.spec.org/osg/cpu2000/results/res2005q4/...">http://www.spec.org/osg/cpu2000/results/res2005q4/...
170(939-pin 2GHz 1MX2) SPECfp_rate_base2000 25.2 SPECfp_rate2000 26.3
http://www.spec.org/osg/cpu2000/results/res2005q4/...">http://www.spec.org/osg/cpu2000/results/res2005q4/...
We don't find the benchmark of 165 and 3800+, but we find the benchmark of 175.
170(939-pin 2.2GHz 1MX2) SPECfp_rate_base2000 26.2 SPECfp_rate2000 27.3
http://www.spec.org/osg/cpu2000/results/res2005q3/...">http://www.spec.org/osg/cpu2000/results/res2005q3/...
We don't find the benchmark of both PD and X2/opteron dc under windows OS/64bit, so we can not compare the dual-core float point performance 64-bit directly.
The test--SPECfp_rate is the most important test for CPU float performance. AMD approbate SPECfp_rate for testing dual-core's FP performance.AMD think it is a fair test.
Betwon - Tuesday, January 10, 2006 - link
Edit:175(939-pin 2.2GHz 1MX2) SPECfp_rate_base2000 26.2 SPECfp_rate2000 27.3
http://www.spec.org/osg/cpu2000/results/res2005q3/...">http://www.spec.org/osg/cpu2000/results/res2005q3/...
It is not 170.
flyck - Tuesday, January 10, 2006 - link
ProLiant DL145 G2 (AMD Opteron (TM) 275) 2 cores, 1 chip, 2 cores/chip 30.3 32.4Betwon - Tuesday, January 10, 2006 - link
We find the 270(2GHz) FP benchmark of 32-bit under windows OS.http://www.spec.org/osg/cpu2000/results/res2005q2/...">http://www.spec.org/osg/cpu2000/results/res2005q2/...
270(not 939-pin ) SPECfp_rate_base2000 27.1 SPECfp_rate2000 28.3
But PD820 SPECfp_rate_base2000 29.x SPECfp_rate2000 30.x
better
Now, ratio is 2.8/2=1.4.
Questar - Tuesday, January 10, 2006 - link
You know, I pretty much favor Intel chips, but I still wish you stop your ranting.Betwon - Tuesday, January 10, 2006 - link
You know, I do not favor Intel chips, and I wish you stop your favor of Intel.Because we know the spec is not favor of Intel, and AMD knew it.
Betwon - Tuesday, January 10, 2006 - link
rates275
It is FP benchmark under 64-bit and Linux, but not the FP benchmark under 32-bit and windows.
And 275 is 2.2GHz
PD820 is 2.8GHz
ratio: 2.8/2.2 = 1.22(only).