Intel NUC5i7RYH Broadwell-U Iris NUC Review
by Ganesh T S on April 20, 2015 8:00 AM EST- Posted in
- Systems
- Intel
- HTPC
- NUC
- Broadwell-U
Performance Metrics - II
In this section, we mainly look at benchmark modes in programs used on a day-to-day basis, i.e, application performance and not synthetic workloads.
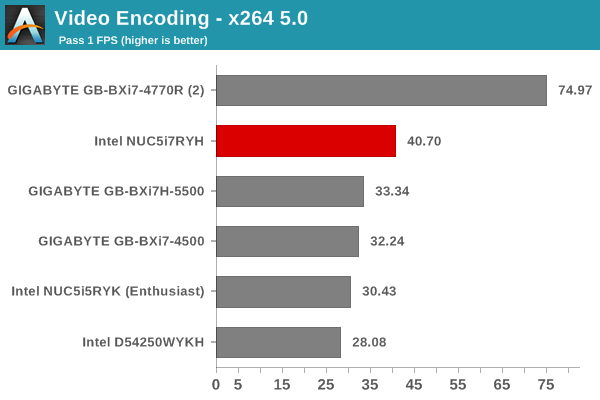
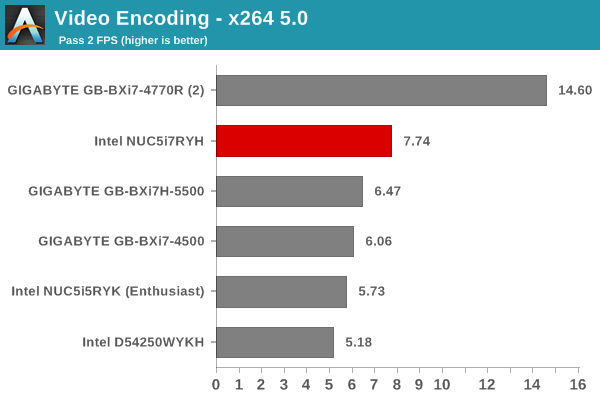
x264 Benchmark
First off, we have some video encoding benchmarks courtesy of x264 HD Benchmark v5.0. This is simply a test of CPU performance. As expected, the Core i7-5557U performs much better than any other U-series CPU that we have tested so far. Thanks to its high TDP, it can sustain higher clock rates. Obviously, it is no match for the 65W TDP Core i7-4770R in the BRIX Pro.
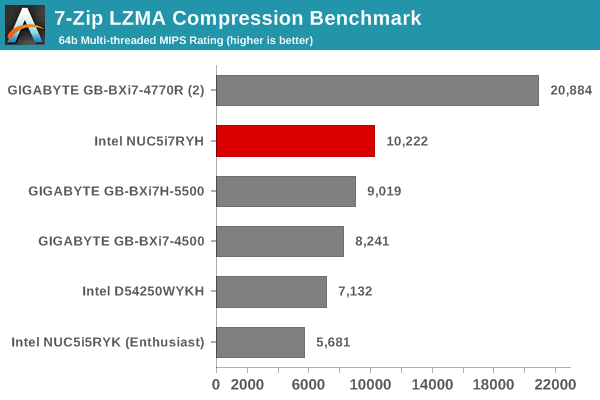
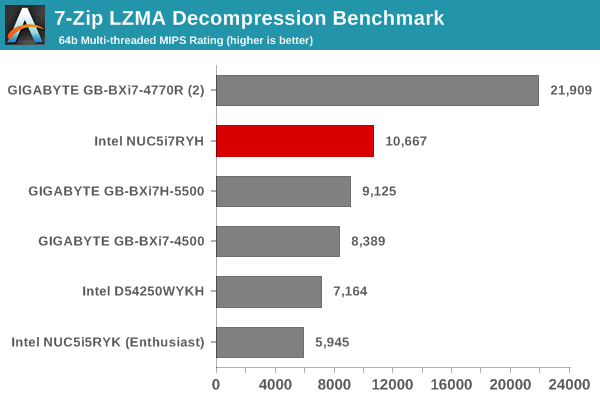
7-Zip
7-Zip is a very effective and efficient compression program, often beating out OpenCL accelerated commercial programs in benchmarks even while using just the CPU power. 7-Zip has a benchmarking program that provides tons of details regarding the underlying CPU's efficiency. In this subsection, we are interested in the compression and decompression MIPS ratings when utilizing all the available threads.
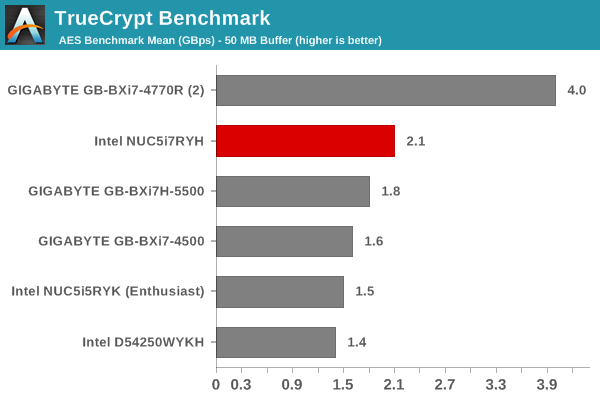
TrueCrypt
As businesses (and even home consumers) become more security conscious, the importance of encryption can't be overstated. CPUs supporting the AES-NI instruction for accelerating the encryption and decryption processes have, till now, been the higher end SKUs. However, with Bay Trail, even the lowly Atom series has gained support for AES-NI. The Core i7-5557U in the NUC5i7RYH does have AES-NI support. TrueCrypt, a popular open-source disk encryption program can take advantage of the AES-NI capabilities. The TrueCrypt internal benchmark provides some interesting cryptography-related numbers to ponder. In the graph below, we can get an idea of how fast a TrueCrypt volume would behave in the Intel NUC5i7RYH and how it would compare with other select PCs. This is a purely CPU feature / clock speed based test.
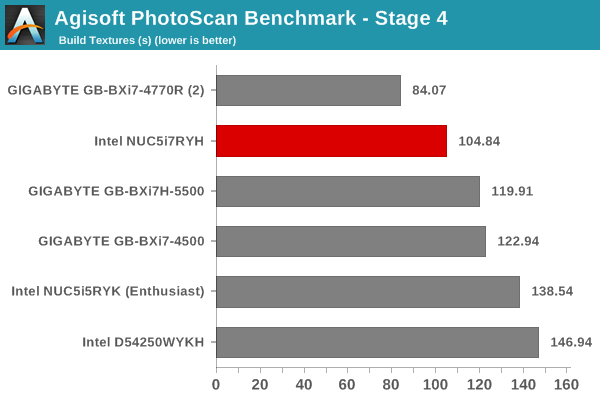
Agisoft Photoscan
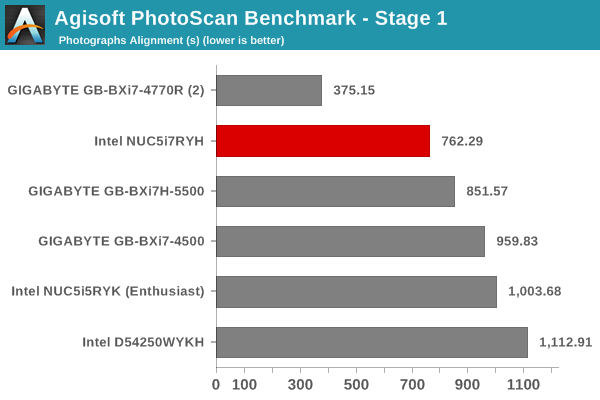
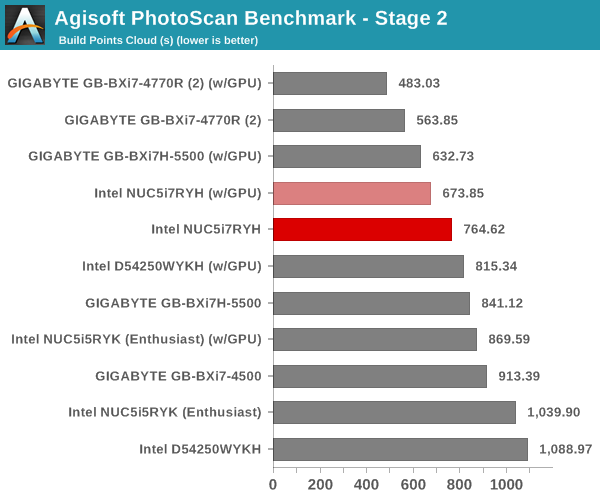
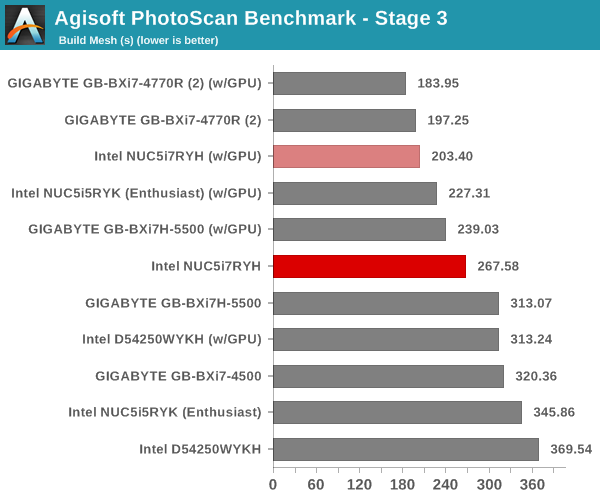
Agisoft PhotoScan is a commercial program that converts 2D images into 3D point maps, meshes and textures. The program designers sent us a command line version in order to evaluate the efficiency of various systems that go under our review scanner. The command line version has two benchmark modes, one using the CPU and the other using both the CPU and GPU (via OpenCL). The benchmark takes around 50 photographs and does four stages of computation:
- Stage 1: Align Photographs
- Stage 2: Build Point Cloud (capable of OpenCL acceleration)
- Stage 3: Build Mesh
- Stage 4: Build Textures
We record the time taken for each stage. Since various elements of the software are single threaded, others multithreaded, and some use GPUs, it is interesting to record the effects of CPU generations, speeds, number of cores, DRAM parameters and the GPU using this software.
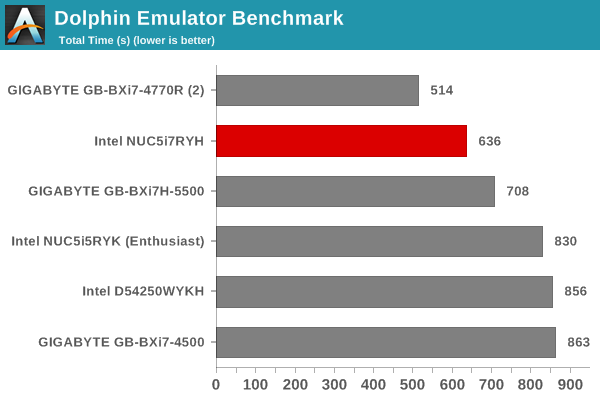
Dolphin Emulator
Wrapping up our application benchmark numbers is the Dolphin Emulator benchmark mode results. This is again a test of the CPU capabilities, and the trend observed in the previous benchmarks in this section get repeated here. The Core i7-5557U is simply the highest-performing U-series CPU that we have evaluated so far.


66 Comments
View All Comments
ganeshts - Monday, April 20, 2015 - link
I can understand the issue for people who are following each and every review that is published here. On the other hand, many of our readers come from search results - say, someone searching on Google for 'Iris NUC review' - So, it is necessary for each review to be a 'standalone' piece ; I have published 10+ UCFF PC reviews in the last year or so. I would rather spend time writing about the actual benchmark results rather than thinking about 10 different ways to convey the same information.If you are a regular reader, the only item of interest in the introductory section would be the table listing the specs of the unit on a comparative basis. Feel free to skim over the introductory section and dive into the actual benchmark results if you are a regular reader.
keg504 - Monday, April 20, 2015 - link
The title for the DiRT Showdown benchmarks is "Tomb Raider" for some reason...ganeshts - Monday, April 20, 2015 - link
Thanks! Fixed ithlovatt - Monday, April 20, 2015 - link
@ganeshts Any chance of a Mac Mini review to see how it stacks up in the HTPC stakes? After all the Mac Mini is one of the founders of this form factor.milkod2001 - Monday, April 20, 2015 - link
i'll second that, please do review and comparison NUC vs Mac Mini if possible.zodiacfml - Monday, April 20, 2015 - link
After all the Core M review these days, 28 watts appeared a performance monster at first glance.Yet, this is no Quad Core compared to previous similarly priced NUC. Not impressed.
meacupla - Monday, April 20, 2015 - link
If you're talking about that Brix Pro, that thing was a beast and it consumes about 2x the power that this NUC does.zodiacfml - Tuesday, April 21, 2015 - link
True, but these devices are plugged in. For a notebook, I might reconsider.Pork@III - Monday, April 20, 2015 - link
Weak is weak, if you will, and it names NUClear.meacupla - Monday, April 20, 2015 - link
If it said "NUClear" on the package, I would totally expect it to contain an R9 290X and subsequently melt down to a smouldering pile of plastic, silicon and PCB the moment it is subjected to ground breaking benchmarks.