Original Link: https://www.anandtech.com/show/1896
Intel’s Dual-Core Xeon First Look
by Jason Clark & Ross Whitehead on December 16, 2005 12:05 AM EST- Posted in
- IT Computing
More processing power has long been the focus of the processor giants, but times are changing. Performance per Watt is the focus for both AMD & Intel for the foreseeable future.
In October of this year, Intel invited AnandTech to its Jones Farm Campus in Portland Oregon. The purpose of the visit was to get a detailed overview of their roadmap for the next year, and to take a close look at the Bensley platform. Bensley is the code name for Intel's new Xeon platform, which will support both Dempsey and Woodcrest processors and a new chipset, code-named Blackford. Demspey is going to take us well into Q2 of next year, and Woodcrest will appear sometime in the second half of next year. Woodcrest will be a lower wattage part that is focused on performance per Watt.
Dempsey is the processor that we're going to take a look at in this article. What we'll be showing benchmarks on is a pre-production Bensley platform. Performance may differ once the platform reaches production status. The key features of Dempsey are: dual-core support, 65nm fabrication and an Independent L2 2MB Cache (2x2MB). Intel will release three variations of the Dempsey processor: a 1066 MHz FSB (130W) version that is the "Performance" version, a 1066 MHz FSB (95W) version that is a rack-optimized part (perf/power for rack density) and a 667 MHz FSB (95W) value version.
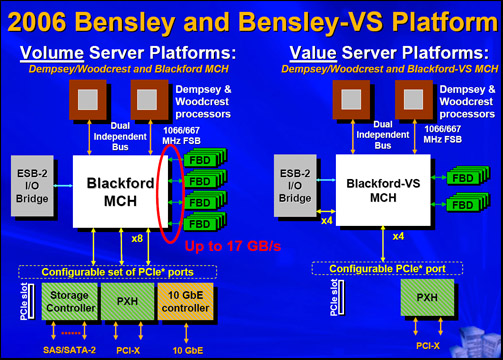
The Blackford chipset is all new for Xeon, and addresses one of the main bottlenecks that we've seen in previous Xeon chipsets, front side-bus. Blackford uses a dual independent bus architecture operating at 1066MHz. Memory is now FBD-DDR2 (Fully Buffered DIMM) running at 533MHz, which offers up to 17GB/s of memory bandwidth.
Bensley Platform Diagram
The future is performance per watt.
Given the way that the energy markets have gone during the past year, it was fairly obvious that there was going to be a focus on power, and performance per watt. Some may say that power is irrelevant and performance is key. While performance is important, performance per Watt is more important. Both Intel and AMD are focusing on ways of delivering more performance with less power - it is the future. We're facing rising energy prices everyday, and those numbers trickle down to everyone, whether you are drying your clothes, or running a few racks of servers at a datacenter.
Recently, we spoke to a bandwidth provider in one of the largest datacenters on the US east coast. The datacenter that this provider uses for its services is out of power. They can't add any more racks because the datacenter doesn't have enough power. We're not talking about a small datacenter either; this is a very large datacenter that serves some of the world's largest websites. They can't get anymore power because government regulations won't allow it; so, now what? They have to find ways to reduce power consumption.
Space is also a concern at most datacenters, so blade systems are becoming very popular at the datacenter. IDC recently forecasted that blade systems would reach 8% of the server market this year, from 2% a year ago. Blade systems may solve the space problem, but add to the power problem, as you end up with a more power-dense environment.
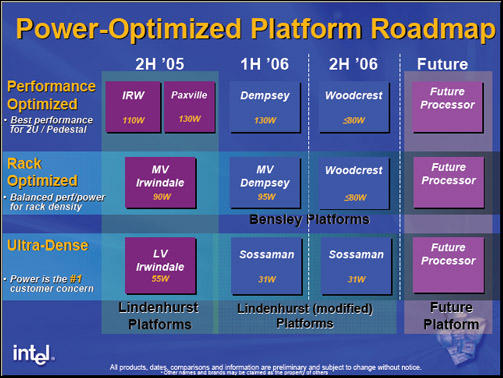
Intel's performance per watt play won't come into full effect until next year, with Woodcrest. Rough numbers for Woodcrest put it at somewhere in the 80Watt range or less. If you think back over the past few years at how the focus has been all about performance, people seem to have overlooked where AMD is in terms of performance per Watt. The Opteron has been competitive with Intel since its inception not only on performance, but delivering that performance in a lower power envelope. The Opteron 280 processor is a 95 Watt part already, and has been very competitive with Intel's Xeon.
Intel Power/Performance Roadmap
Test Configuration
Software Configuration
Windows 2003 was configured with /3GB and /PAE switches in the boot.ini to support the 8GB of memory used for our tests. SQL Server Enterprise was set to use AWE extensions, and a maximum memory limit was set at 6144MB.
Intel Bensley 3.46 Pre-Production System
Dual 3.46GHz Dual-Core Dempsey Processors
Pre-production Blackford based Intel Motherboard
8GB FBDIMM DDR-2 533Mhz
Windows 2003 Enterprise Server (32 Bit) SP1
8 x 36GB 15,000RPM Ultra320 SCSI drives in RAID-0
LSI Logic 320-2 SCSI Raid Controller
Opteron 280 System
Tyan S2882 K8S Motherboard
Dual Opteron 280 (Dual-Core) Processors
8GB Corsair PC3200 DDR
Windows 2003 Enterprise Server (32 Bit) SP1
8 x 36GB 15,000RPM Ultra320 SCSI drives in RAID-0
LSI Logic 320-2 SCSI Raid Controller
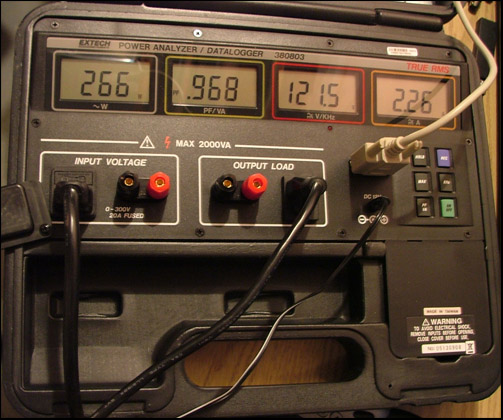
Measuring Power
To measure power consumption of each system, we used an EXTECH Instruments Power Analyzer Model 380803. This power analyzer allows us to view current power consumption, and log the consumption at various intervals during a test to a text file. For this test, we used the same Power Supply for both systems, although we recorded the difference between a 750W power supply and a 550W power supply, and it was less than 3 Watts. We should note that the Raid Array was powered by a separate power supply that was not plugged into our analyzer, so we were measuring strictly bare system power consumption. If you’re curious, the Raid Array used about 98 Watts spun up, and averaged 110 Watts during the database tests.
Idle – To measure a system at idle, we booted each system into Windows and let it stabilize by watching the task manager in Windows and the Wattage readings. Once we were at a stable reading, we began recording for 100 iterations of our data logger (which logs every 2 seconds). We then took those numbers and averaged them to get the idle power reading.
50% – We used our database benchmark to measure a loaded system, by adjusting the thread count for the test to a level that produced a half loaded system. Then, we would run our database test for its duration while recording to the data logger. Finally, we averaged those results.
100% – To produce a fully loaded system, we used the same technique as above, except increasing the number of threads until we achieved a fully loaded system.
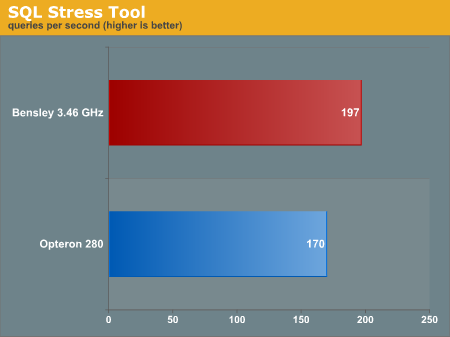
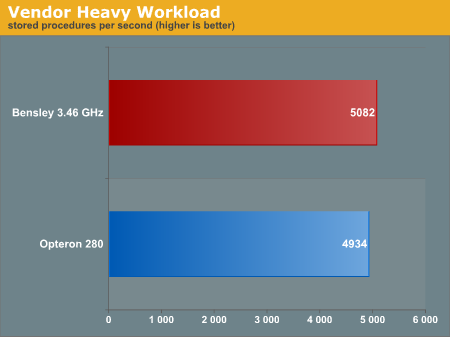
SQL Stress Tool Results(test description)
Intel’s pre-production Bensley system came out on top in this test, with a 14% lead over the Opteron 280 system. The 1066MHz front-side bus, no doubt, was required to achieve this result, along with the 2MB of L2 cache. Intel has always been competitive with AMD in this test, but was able to pick up an additional 4% this time around over their usual 10% lead.
This enterprise test has been of great interest to a lot of people, including Intel. Opteron has constantly dominated this test, but times have changed. Bensley essentially tied with the Opteron 280 in this test, as the difference was about 3% (which is standard deviation). The new Blackford chipset architecture, increased front-side bus and memory bandwidth all played a part in Bensley showing this kind of improvement. Where Opteron used to show, on average, a 15% gain over Intel, they are now neck and neck.
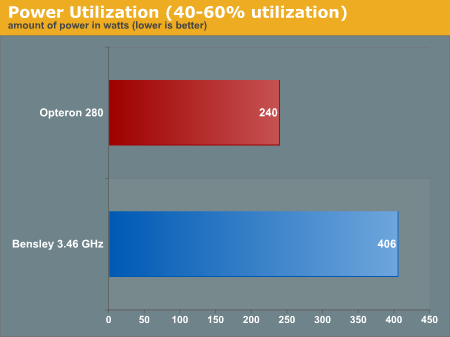
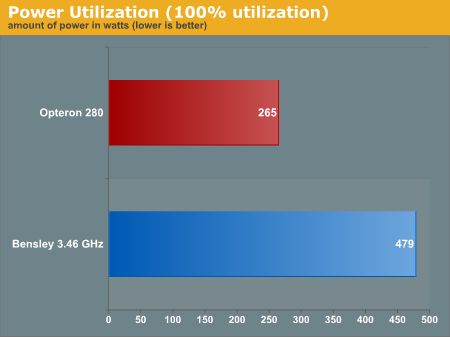
Power Consumption Results
As we’ve been alluding to throughout this article, power consumption is on the forefront of processor technology now, and into the future. So, starting with this article, we will be including Power Consumption results in future IT articles. It should be no surprise that Opteron dominated these tests, but it probably will be to those who concentrated on performance, and power was of no concern. The Bensley system used approximately 1.5x the amount of power in the idle load test over the Opteron system. Given that a Dempsey (130 W) processor uses approximately 1.4x the amount of power as an Opteron (95 W), the results are inline with the specifications for the two processors.
As the load on the system grew, the Bensley system used 1.7x and 1.8x more power (respective to the 50% and 100% load levels). It’s obvious that the Opteron system is more efficient at higher load levels than the Bensley, thus using less power. The Opteron’s on-die memory controller is one of the factors that would allow the Opteron to be more efficient at higher load levels.

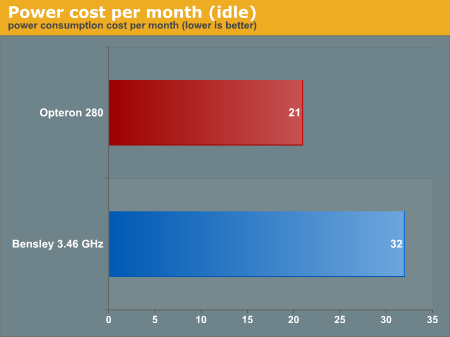
How does power consumption affect the bottom line?
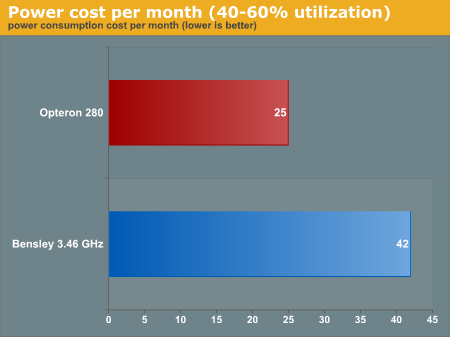
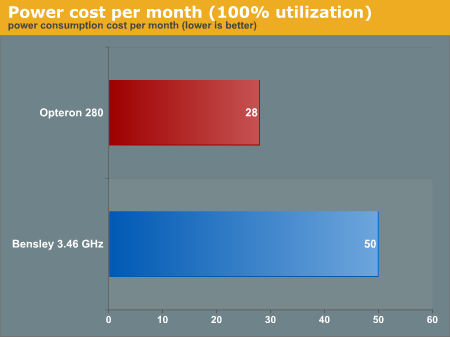
We've illustrated each system's power consumption levels at different load levels. For the technical folks, those numbers are important. But, for the platform decision maker, the CTO, Director of Technology and any person in a role that looks at the bigger picture, it's important to illustrate how it affects the bottom line. Obviously, if you use more power, it costs you more money. To illustrate this, we used a current rate of 14 cents per kWh, which was taken from a power bill of a resident in Connecticut, New York. We then used the data to extrapolate the cost of each platform at the various load levels.
At 40-60% load, it costs $42 a month to run a Bensley system while an Opteron system would cost $25. Factor that over a year, and a Bensley system would cost $504 to run and an Opteron would cost $300. Now, if that doesn't pique your interest, let's say that you have 40 servers at a datacenter, with the same power characteristics. Over a year, it would cost you $8,160 more to run the Bensley system.
So, you've read through the article and are waiting for us to tell you what platform is better. That entirely depends on what matters to you: performance, power, or both. If all you care about is performance, then Bensley is that platform. If you care about how much power you consume, then Opteron is that platform. Now, if you want the best performance per Watt, then Opteron is that platform. At least that is what the database test results that we've shown here dictate. Obviously, given Intel's roadmap, they are developing platforms to address performance per Watt. Woodcrest will be the first product that is focused on performance per Watt, which we will see in the second half of 2006. Until then, the choice is yours.


