Original Link: https://www.anandtech.com/show/2010
Seagate Barracuda 7200.10 750GB: Size Does Matter
by Gary Key on May 18, 2006 9:00 AM EST- Posted in
- Storage
This statement by the famous Greek critic, philosopher, physicist, and zoologist Aristotle expresses our beliefs about the technological capabilities of Seagate. Seagate has been at the forefront of storage design, manufacturing, and service capabilities while attaining the status of the world's largest supplier of hard disk drives with their acquisition of Maxtor a few months ago.
Seagate recently announced the Barracuda 7200.10 as the successor to their Barracuda 7200.9 series with much surprise as the 7200.9 product line has only been available for a short period of time. Although the Barracuda 7200.10 series will become the flagship product for personal desktop solutions, the 7200.9 series will continue to be offered in capacities under 200GB as a "value performance" product once the 7200.10 drives are shipping in volume later this spring. As with previous Barracuda product group updates, the naming succession follows the standard point upgrade path but this change is anything but a simple number revision. The new Barracuda 7200.10 product will be the first desktop centric hard drive to feature perpendicular recording.
For nearly fifty years, the storage industry has been on a path where the longitudinal technology currently utilized would eventually become a limiting factor in drive capacities. Over the last decade the drive manufacturers have been doubling and at times quadrupling storage capacity at a dizzying rate in order to meet continuing demands from users. The standard method of increasing the amount of capacity in a drive is to either add more platters or increase the density of the data on each platter. Increasing the density of data that can be stored on a platter is the preferred manner, as it will allow for an overall increase in drive storage along with resulting performance and cost advantages by reducing the number of components. However, this solution requires significantly more effort from a research and development viewpoint that can lead to additional complexity and cost. While the storage manufacturers have been able to develop and implement some incredible technologies to achieve the capacities, cost, and drive performance we currently experience there is a limit to what can be achieved with today's technology.
The next evolutionary step in the storage industry for solving today's current issues is the utilization of perpendicular recording technology. This technology has been researched and discussed for a number of years by the various drive manufacturers. It has its roots in the late 19th century work of Danish scientist Valdemar Poulsen, who is generally considered the first person to magnetically record sound using perpendicular recording.
What is Perpendicular Recording Technology? Simply put, during perpendicular recording the magnetization of the disc stands on end, perpendicular to the plane of the disc, instead of lying in the disc's plane as it does in current longitudinal recording. The data bits are then represented as regions of upward or downward directed magnetization points. The data is written to a soft magnetic under-layer that functions as part of the write field return path and basically generates an image of the recording head that doubles the available recording field, resulting in a higher recording density compared to longitudinal recording.
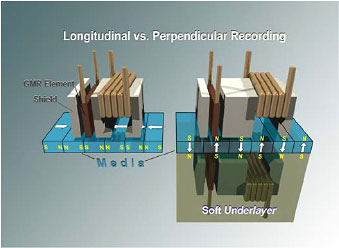
In longitudinal recording, the data bit magnetization lies in the plane of the disc and switches between pointing in the same and then opposite directions of the disk movement. In order to increase areal densities and provide greater storage capacity in longitudinal recording, the data bits must be arranged and shrunk in a very tight pattern on the disc media. However, if the data bit becomes too small, the magnetic energy holding the bit in place can become so small that thermal energy can cause it to demagnetize, resulting in a condition known as superparamagnetism.
To avoid superparamagnetism, engineers have been increasing the coercivity - the field size required to write a bit - of the disc media. These fields are limited by the magnetic materials making up the write head and will soon effectively limit drive sizes utilizing longitudinal recording. Although additional capacities are still achievable, the drive industry will be moving to perpendicular recording technology shortly as longitudinal recording has basically hit the proverbial brick wall after being utilized for nearly 50 years.
Perpendicular recording will eventually enable areal densities of up to 500 Gbpsi (Gigabits per square inch) with current technology as compared to the 110 Gbpsi rates in today's longitudinal recording designs. This results in an almost five fold increase in storage capacities with a typical 3.5-inch desktop drive being able to store two terabytes of information. Current perpendicular technology has allowed Seagate to demonstrate 245 Gbpsi capabilities with a data transfer rate exceeding 480Mb/s (7200.10 already does).
While the launch of the Barracuda 7200.10 series is certainly impressive for Seagate, it is not the first use of perpendicular recording technology in their product lines. Seagate is currently shipping their Momentus 5400.3 mobile hard drive with this technology, and it has allowed the mobile sector to finally break the 100GB mark with drives featuring capacities up to 160GB. Seagate has also introduced perpendicular technology into their Enterprise product line with the release of the Cheetah 15K.5 product series; it has effectively doubled the storage capacity of 15K enterprise level drives overnight.
Let's see how the newest Barracuda performs against other large capacity SATA drives.
Feature Set and Options
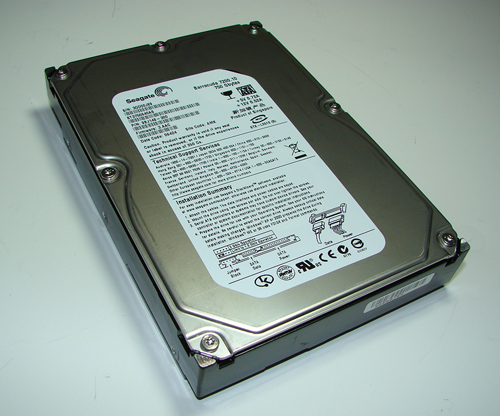
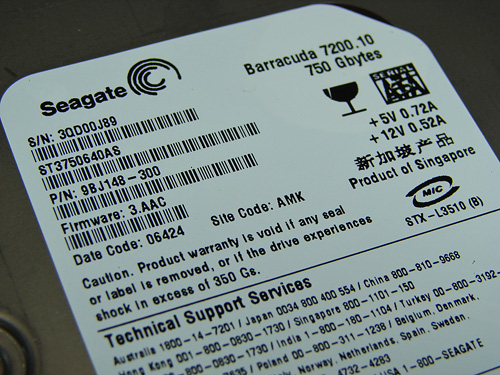
The external casing design of the Seagate Barracuda 7200.10 series is basically unchanged from the previous generation 7200.9 series. The drive is based on the industry standard 3.5" form factor platform with pertinent part number and warranty information embossed on a white sticker on the top of the casing. However boring the exterior design maybe, lurking under the plain casing is an impressive 750 GB storage capacity that did not require a new form factor or additional platters. Based upon the potential of perpendicular technology, this same casing could be holding two terabytes of capacity in a relatively short time.
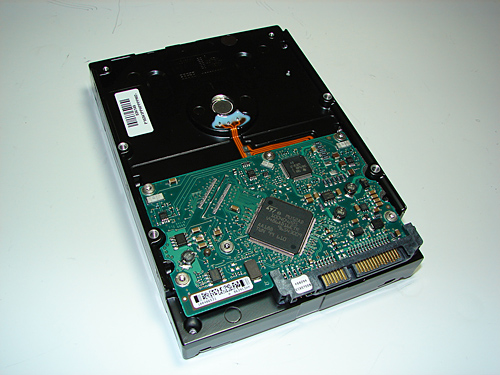
The 7200.10 SATA family ships with the Serial ATA data and power connectors only. There is no longer support for the 4-pin Molex power connector designed for use with older ATX power supplies. To the left of the data and power connectors is a four pin jumper block. This jumper block will determine whether the drive operates in Serial ATA/150 or Serial ATAII/300 mode. Two pins are enabled by default, meaning the Seagate Barracuda 7200.10 ships and will operate in SATA/150 mode. In order for the drive to operate in Serial ATAII/300 mode, the jumper must be removed. Enabling SATAII/300 is recommended if you have a compatible motherboard that fully supports SATA II/300 operations. While this feature was advantageous for burst transfer rates in our synthetic benchmarks, overall we did not see any real improvement in our real world benchmarks.
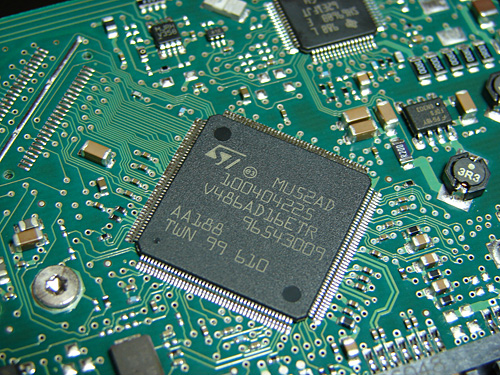
The PCB is openly visible on the bottom of the drive as in previous series and now contains an ST Micro controller chip. The ST Micro Serial ATA controller chipset is a departure for Seagate as they have previously used an Agere chipset. Our recently delivered Seagate 7200.9 500GB test unit is also employing the ST Micro chipset, so it appears this is a change for both drive series at this time. The 16 MB of cache memory is located on the opposite side of the PCB.
 |
| Click to enlarge |
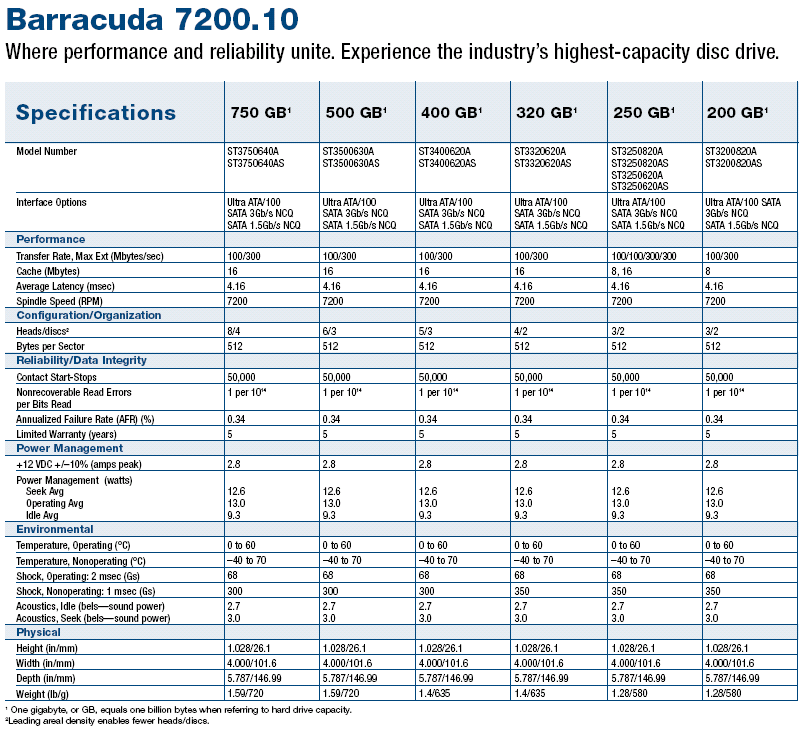
Seagate currently has 14 variations of the 7200.10 product series planned for release over the next few weeks, with select drives also being offered in the external Pushbutton Back-up Hard Drive line in late May or early June. The entire lineup features perpendicular recording technology with our review unit being the new high capacity model at 750GB. This is the industry's highest offered capacity in a single disk drive and is made possible by four 188GB platters spinning at 7200 RPM with a 16-megabyte buffer size.
Seagate is also introducing two new technologies in the 7200.10 products. The first is Adaptive Fly Height, and it maximizes the consistency of read/write performance across the entire disc by adjusting the fly height (distance between the disc head and platter) according to changes in environmental operating conditions. The second is Clean Sweep that assists in maintaining media integrity and drive reliability by passing the drive head over the entire platter during power-on to smooth out any irregularities in the disc surface.
Capacities for the 7200.10 series range from 200GB to 750GB with PATA, SATA 1.5Gb/s, and SATA 3.0Gb/s interfaces being offered. The 200GB and base 250GB models feature an 8MB buffer while the 250GB, 320GB, 400GB, 500GB, and 750GB models will have 16MB buffers. Seagate has dropped the MTBF (mean time between failures) measurement and switched to a percentage based Annualized Failure Rate (AFR) measurement which is estimated to be 0.34%.
A complete price list has not been published; however, Seagate says the 200GB model will retail at US $105 with the 750GB model currently offered for around US $500. Product launch has already occurred with the 750GB being widely available at online retailers, and the balance of the product line is expected within the next couple of weeks and at the brick and mortar outlets in late June.
Test Setup - Software
With the variety of disk drive benchmarks available, we needed a means of comparing the true performance of the hard drives in real world applications. We will continue to utilize HD Tach, PCMark05, Disk Bench, IOMeter (enterprise drive comparisons), and our internal timing program for comparative benchmarks; however, we will be also be adding some new tests. Our logical choice for application benchmarking is the Intel IPEAK Storage Performance Toolkit version 3. We originally started using this storage benchmark application in our Q2 2004 Desktop Hard Drive Comparison: WD Raptor vs. the World. The IPEAK test can be used to measure "pure" hard disk performance, and in this case, we kept the host adaptor as consistent as possible while varying the hard drive models. The idea is to measure the performance of a hard drive with a consistent platform.We utilize the IPEAK WinTrace32 program to record precise I/O operations when running real world benchmarks. WinTrace32 will only record the accesses it makes to the operating system host adapter driver. We then utilize the IPEAK AnalyzeTrace program to review the disk trace file for integrity and ensure our trace files have properly captured the disk activities we are reporting in our benchmarks. Intel's RankDisk utility is then used to play back the workload of all I/O operations that took place during the recording. RankDisk plays back every request exactly as generated in the WinTrace32 capture file.
RankDisk then generates results in a mean service time in milliseconds format; in other words, the average time that each drive took to fulfill each I/O operation. In order to make the data more understandable, we report the scores as an average number of I/O operations per second so that higher scores translate into better performance in all of our IPEAK results. While these measurements will provide a score representing "pure" hard drive performance, the actual impact of a drive's performance in real world applications can and will be different based upon other system level components. However, the Intel IPEAK tool set does generate an extremely accurate capture and playback of any given workload in an application. Based on this testing methodology our results are an actual representation of the drive's performance within the application.
Our IPEAK tests represent a fairly extensive cross section of applications and usage patterns for both the general and enthusiast user. We will continually tailor these benchmarks with an eye towards the drive's intended usage and feature set when compared to similar drives. In essence, although we will report results from our test suite for all drives, it is important to realize a drive designed for PVR duty will generate significantly different scores in our gaming benchmarks than a drive designed with this purpose in mind such as the WD Raptor. This does not necessarily make the PVR drive a bad choice for those who capture and manipulate video while also gaming. Hopefully our comments in the results sections will offer proper guidance for making a purchasing decision in these situations.
The drive is formatted before each test run and 3 tests are completed on each drive in order to ensure consistency in the benchmark results. The high and low scores are removed with the remaining score representing our reported result. We utilize the NVIDIA nF4 SATA ports along with the NVIDIA IDE-SW driver to ensure consistency in our playback results when utilizing NCQ, TCQ, or RAID settings.
Our IPEAK Test Suite consists of the following benchmarks:
VeriTest Business Winstone 2004: Trace file of the entire test suite that includes applications such as Microsoft Office XP, WinZip 8.1, and Norton Antivirus 2003.
VeriTest Multimedia Content Creation 2004: Trace file of the entire test suite that includes applications such as Adobe Photoshop 7.01, Macromedia Director MX 9.0, Microsoft Windows Media Encoder 9.0, Newtek Lightwave 3D 7.5b, and others.
AVG Antivirus 7.1.392: Trace file of a complete antivirus scan on our test bed hard drive.
Microsoft Disk Defragmenter: Trace file of the complete defragmentation process after the operating system and all applications were installed on our test bed hard drive.
WinRAR 3.51: Trace file of creating a single compressed folder consisting of 444 files in 10 different folders totaling 602MB. The test is split into the time it takes to compress the files and the time it takes to decompress the files.
File Transfer: Individual trace files of transferring the Office Space DVD files to our source drive and transferring the files back to our test drive. The content being transferred consists of 29 files with a data content of 7.55GB.
AnyDVD 5.9.6: Trace file of the time it takes to "rip" the Office Space DVD. We first copy the entire DVD over to our Seagate 7200.10 750GB source drive, defragment this drive, and then measure the time it takes for AnyDVD to "rip" the contents to our test drive. While this is not ideal, it does remove the optical drive as a potential bottleneck during the extraction process and allows us to track the write performance of the drive.
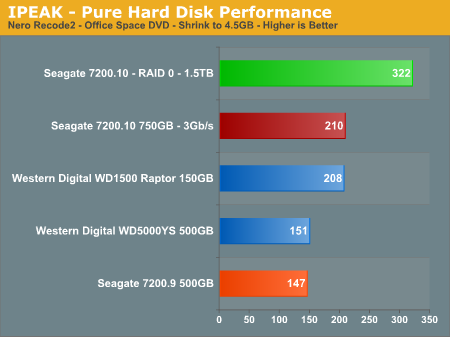
Nero Recode 2: Trace file of the time it takes to shrink the entire Office Space DVD that was extracted in the AnyDVD process into a single 4.5GB DVD image.
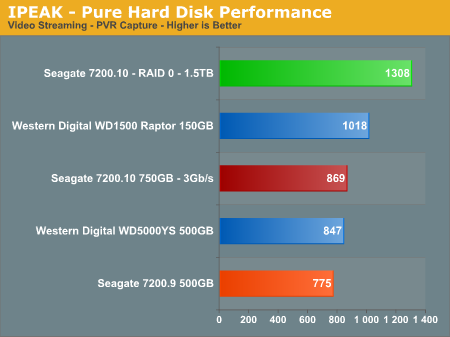
Video Streaming: Trace file of the time it takes to capture and record Chapter 11 of Office Space with our NVIDIA DualTV MCE tuner card while viewing Chapter 10 utilizing PowerDVD 6. Chapter 10 has already been recorded and is playing from our source drive while Chapter 11 is being streamed from our Media Server.
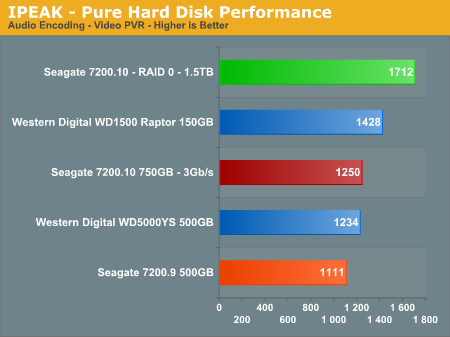
Audio Encoding/Video Capture: Trace file of the time it takes Nero Digital Audio to extract all 16 tracks from INXS Greatest Hits CD and convert them into an mp4 format while capturing and recording Chapter 11 of Office Space with our NVIDIA tuner card. We changed the Nero default quality settings to transcoder-ultra, variable bit rate, encoder quality to high, and the AAC profile to LC.
Game Installation: Individual trace files of the time it takes to install Oblivion, Sims 2, and Battlefield 2. We copy each DVD to our secondary Seagate 750GB drive, defragment the drive, and then install each game to our source drive.
Game Play: Individual trace files that capture the startup and about 15 minutes of game play in each game. Our Oblivion trace file consists of visiting 16 different areas within the game, interacting with individual characters, and passing through three different Oblivion gates. The Sims 2 trace file consists of the time it takes to select a pre-configured character; setup a university, downtown, and shopping district from each expansion pack (pre-loaded); and then visit each section before returning home. Our final trace file utilizes Battlefield 2 and we play the Daqing Oilfield map in both single and multiplayer mode.
Test Setup - Hardware
We have changed our test beds to reflect changes in the current marketplace. While we wanted to change to the AMD AM2 platform, the continual product delays forced us into staying with a socket 939 based system. Based upon the continuing proliferation of dual core processors along with future roadmaps from AMD and Intel signifying the end of the single core processor on the desktop in the near future, we have upgraded from our AMD Athlon64 3500+ to an AMD Opteron 170. This change will also allow us to expand our real world multitasking benchmarks in the near future. We will review our test bed requirements once we have an opportunity to thoroughly test the AM2 and Intel Core 2 Duo platforms.We debated on the memory size for our IPEAK trace file creations and decided to move to 2GB of system memory. A system with a 1GB memory configuration is the predominant standard at this time in the enthusiast community, but 2GB memory setups are fast becoming the future standard. Although a 1GB memory installation allows us to capture and report a higher amount of disk activity in certain applications; we decided to make the switch at this time as the performance difference is minimal when compared to the 1GB trace files.
| Standard Test Bed Playback of iPEAK Trace Files and Test Application Results |
|
| Processor: | AMD Opteron 170 utilized for all tests. |
| RAM: | 2 x 1GB Corsair 3500LL PRO Settings: DDR400 at (2.5-3-3-7*c* 1T) |
| OS Hard Drive: | 1 x Maxtor MaXLine III 7L300S0 300GB 7200 RPM SATA (16MB Buffer) |
| System Platform Drivers: | NVIDIA Platform Driver - 6.85 |
| Video Card: | 1 x Asus 7600GS (PCI Express) for all tests. |
| Video Drivers: | NVIDIA nForce 84.21 WHQL |
| Optical Drive: | BenQ DW1640 |
| Cooling: | Zalman CNPS9500 |
| Power Supply: | OCZ GamexStream 700W |
| Case: | Gigabyte 3D Aurora |
| Operating System(s): | Windows XP Professional SP2 |
| Motherboards: | MSI K8N Diamond Plus |
| Standard Test Bed Creation of iPEAK Trace Files |
|
| Processor: | AMD Opteron 170 utilized for all tests. |
| RAM: | 2 x 1GB Corsair 3500LL PRO Settings: DDR400 at (2.5-3-3-7*c* 1T) |
| OS Hard Drive: | 1 x Maxtor MaXLine III 7L300S0 300GB 7200 RPM SATA (16MB Buffer) |
| System Platform Drivers: | ATI Platform Driver - 1.1.0.0 |
| Video Card: | 1 x Asus 7600GS (PCI Express) for all tests. |
| Video Drivers: | NVIDIA nForce 84.21 WHQL |
| Optical Drive: | BenQ DW1640 |
| Cooling: | Zalman CNPS9500 |
| Power Supply: | OCZ GamexStream 700W |
| Case: | Gigabyte 3D Aurora |
| Operating System(s): | Windows XP Professional SP2 |
| Motherboards: | ECS KA1 MVP Extreme |
We chose the ECS KA1-MVP as the platform for creating our IPEAK trace files. This affords us an updated system with the capability of correctly creating and storing our trace files on a SATA based drive. It also allows us to utilize a modern video card for the game play trace results which are captured with the graphic settings at a typical 1280x1024 resolution.
You may have noticed we did not use the MSI K8N Diamond Plus for both purposes, though the balance of the component choices are essentially the same. We experienced inconsistencies with our trace files on this platform, our ULi M1575 or M1697 boards, and those of any Intel based systems featuring the ICH6 or ICH7 chipsets. The ATI SB450 proved to be the only currently available chipset that produced repeatable results on all platforms when utilizing the IPEAK WinTrace32 program. Note that this is a common issue with IPEAK: once you create trace files that perform consistently, they will work fine on any platform, but creating the trace files requires the use of specific platforms/drives with prior trace files being developed on an Intel board with the ICH5 Southbridge.
Features and HD Tach Test
| Drive Specifications | ||||
| Seagate Barracuda 7200.10 ST3750640AS |
Western Digital Raptor WD1500ADFD |
Western Digital RE2 WD5000YS |
Seagate Barracuda 7200.9 ST3500641AS |
|
| Manufacturer's Reported Capacity | 750GB | 150GB | 500GB | 500GB |
| Operating System Reported Capacity | 698.6GB | 139.7GB | 465.8GB | 465.8GB |
| Interface | SATA 300MB/s | SATA 150MB/s | SATA 300MB/s | SATA 300MB/s |
| Rotational Speed | 7200 RPM | 10000 RPM | 7200 RPM | 7200 RPM |
| Cache Size | 16 MB | 16 MB | 16 MB | 16 MB |
| Average Latency | 4.16 ms (nominal) | 2.99 ms (nominal) | 4.20 ms (nominal) | 4.16 ms (nominal) |
| Read Seek Time | 11 ms | 4.5 ms | 8.7 ms | 11 ms |
| Number of Heads | 8 | 4 | 8 | 8 |
| Number of Platters | 4 | 2 | 4 | 4 |
| Power Draw Idle / Load | 9.3W /12.6W | 9.2W / 10.0W | 8.9W / 10.8W | 7.4W / 13W |
| Command Queuing | Native Command Queuing | Native Command Queuing | Native Command Queuing | Native Command Queuing |
| Warranty | 5 Years | 5 Years | 5 Years | 5 Years |
The Seagate 7200.10 750GB drive we are reviewing today will be compared against two of the leading 500GB drives from Seagate and Western Digital along with the drive that has redefined performance in the Serial ATA market, the Western Digital WD1500 Raptor. While our Seagate 750GB drive is not in the same market sector as the Raptor, we thought it would be interesting to see how the two drives at the top of their respective classes perform against each other in our testing.
We are providing RAID 0 results for the Seagate 7200.10 for comparative results to the single drive. Seagate has recently released updated firmware for the 500GB 7200.9 that improves RAID performance; unfortunately we were unable to complete our testing with the new firmware before publication. Our RAID results for the WD1500 series will be published in our next storage article. The Western Digital 500GB drive is actually from the RE2 family and its design aspects are based upon the Raptor family. We will be having a 500GB roundup in the near future and will include the updated Hitachi Deskstar, Maxtor DiamondMax 11, Western Digital WD5000KS, and Seagate's own 7200.10 unit in our test results.
All of our drives are tested with Native Command Queuing (NCQ) enabled if the drive supports this technology. The reason for this is that a majority of users will not take the time to toggle NCQ on or off in the drivers so our test results will reflect this pattern. Native Command Queuing performance in single user applications has generally extracted a minor performance penalty when left enabled, with scores generally being 2%~4% lower in the current generation of drives. We noticed a 1% to 3% performance drop with the Seagate 7200.10 in our IPEAK benchmarks but nothing that would be noticed in actual application usage. Our recommendation at this time is to disable NCQ in single user environments to maximize the performance of the drive.
In the case of SATA 1.5Gbps/3Gbps operation we will remove the drive jumpers to enable this function if the drive supports it. Unless your core logic chipset and drivers support SATA 3Gbps operation, do not remove the drive jumper as this will generally result in a non-boot situation. The WD1500 Raptor does not support SATA 3Gbps operation and will operate at SATA 1.5Gbps. We did not notice a performance delta in the 7200rpm drives when enabling 3Gbps operation except in our synthetic benchmarks that measure and report burst speeds.
HD Tach
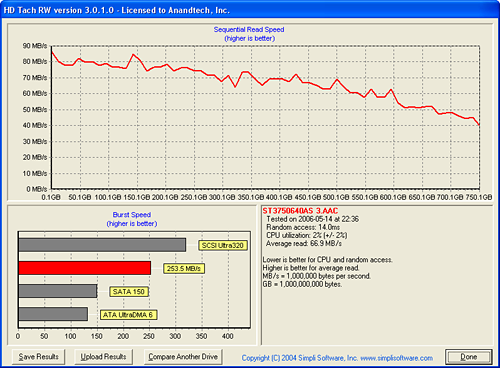
We find HD Tach to be useful for generating random access and average transfer rate results in a very consistent manner. Although the burst rates and CPU utilization rate numbers are somewhat interesting, they tend to be useless in actual application performance comparisons. In real world terms, CPU utilization rates in any DMA based storage system will typically be under 1% in all instances.
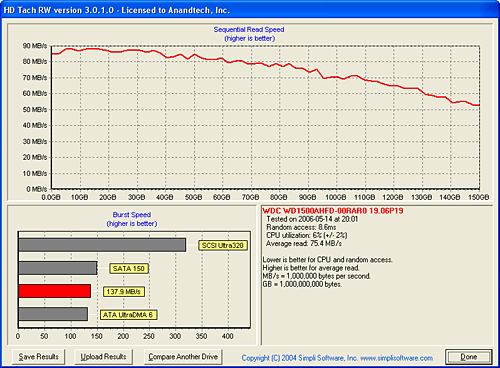
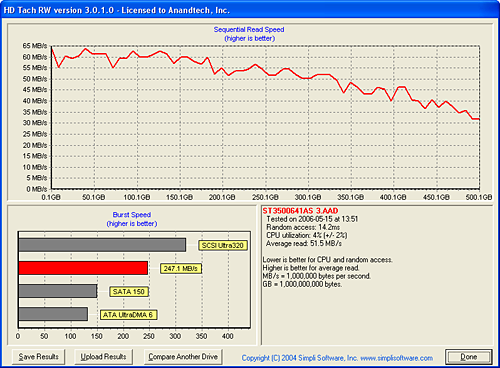
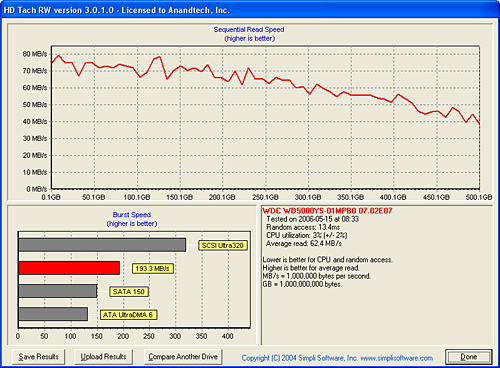
The Raptor has the highest average read rate of 75.4 MB/s with the Seagate 750GB drive following fairly closely with 66.9 MB/s, the Western Digital 500GB drive at 62.4 MB/s, and falling way behind at 51.5 MB/s is the Seagate 500GB drive. The 7200.10 has improved upon the 7200.9 series in this test by 29%.
The sequential read speed at the 500GB level for the 7200.10 is averaging 70 MB/s while the 7200.9 finishes at 31 MB/s. The Seagate 7200.10 and WD 500GB drives score about 40 MB/s at the end of the disk. In contrast, the WD Raptor finishes with a 52 MB/s result that is about 30% greater than the 7200 RPM drives. However, if you look at the read performance for the first 150GB on the 7200 RPM drives, all three manage higher minimum transfer rates than the Raptor.
The random access time benchmark favors the 10,000 RPM spindle speed of the Raptor, which generates a result of 8.6ms. The 7200 RPM drives results are all close together with the nod going to the WD 500GB drive at 13.4ms and the Seagate 750GB/500GB drives finish at 14.0ms and 14.2ms respectively. The average rotational latency at 10,000 RPM is 3ms while the average rotational latency at 7200 RPM is 4.17ms; what this means is that the head seek speed on the Raptor is significantly faster (~5.6ms) than the other drives (9.2-10.0ms). Although the two Seagate drives have excellent burst rates, we will soon see these results do not directly translate into class leading performance.
PCMark05
We are utilizing the HDD test suite within PCMark05 for further comparative hard disk scores as it provides a mixture of actual application results and specific read/write percentages utilized within these programs. The program utilizes the RankDisk application within the Intel IPEAK SPT suite of tools to record a trace of disk activity during usage of real world applications. These traces are then replayed to generate performance measurements based upon the actual disk operations within each application. The HDD test suite contains 53% read and 47% write operations with each trace section utilizing varied amounts of read or write operations. Additional information about the test suite can be found in PDF format in the PCMark05 whitepaper.Our test results are based upon the following trace runs:
Windows XP Startup: This test consists of 90% reading and 10% writes that tracks XP activities at startup.
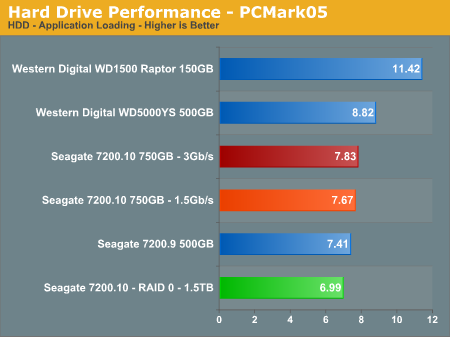
Application Loading: This test consists of 83% reading and 17% writes that tracks the opening and closing of the following programs.
Microsoft Word
Adobe Acrobat Reader
Windows Media Player
3Dmark 2001SE
Leadtek Winfast DVD
Mozilla Internet Browser.
General Hard Disk Drive Usage: This test consists of 60% reading and 40% writes that tracks application usage utilizing the following settings.
Opening a Microsoft Word document, performing grammar check, saving and closing.
Compression and decompression using WinZip
Encrypting and decrypting a file using PowerCrypt
Scanning files for viruses using F-Secure Antivirus
Playing an MP3 file with Winamp
Playing a WAV file with Winamp
Playing a DivX video using DivX codec and Windows Media Player
Playing a WMV video file using Windows Media Player
Viewing pictures using Windows Picture Viewer
Browsing the Internet using Microsoft Internet Explorer
Loading, playing and exiting a game with Tom Clancy's Ghost Recon
Virus Scanning: This test consists of 99.5% read operations as the test tracks the scanning activities of 600MB of files for viruses.
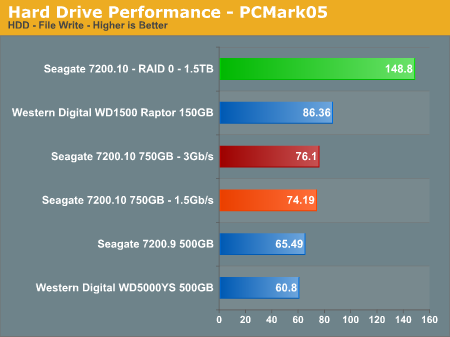
File Write: This test consists of 100% write activities by writing 680MB of files onto the hard disk.
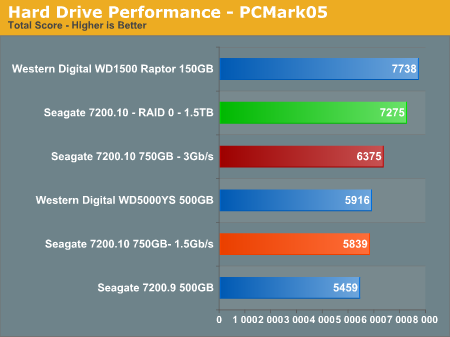
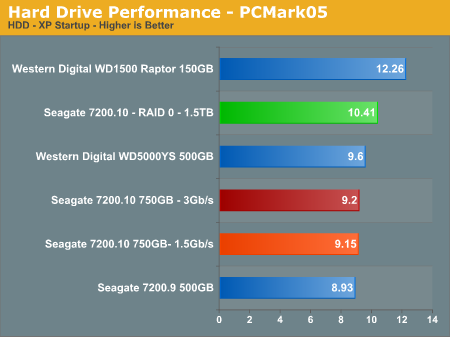
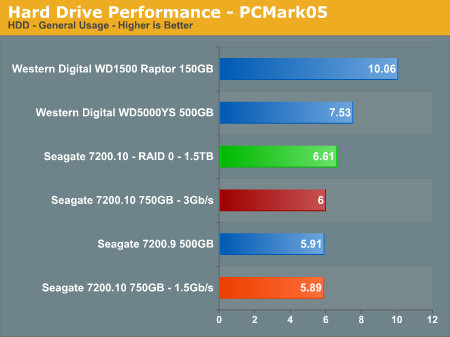
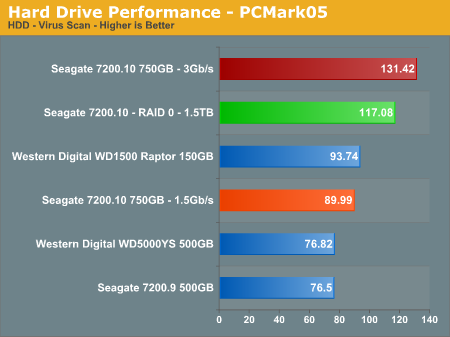
Our PCMark05 numbers follow the same trend with the WD Raptor having a 21% advantage over the Seagate 7200.10 750GB drive in the total score results. The performance delta of implementing SATA II/3Gb/s operation on the Seagate 750GB drive results in an impressive 9% gain over the SATA 1.5Gb/s results. However, after further examination of the numbers the only real improvement comes from the Virus scanning test which shows a 45% increase in the score. The other individual scores are well within the margin of error between benchmark sessions. In our IPEAK virus scan we did not witness the same results and believe the rather short sequential scan of 600MB in data favors the Seagate drive in this test.
The general usage and application benchmarks that represent the majority of daily operations on a typical PC configuration heavily favor the Western Digital drives. The Western Digital 500GB drive makes for an impressive showing in the first three benchmarks and then falls flat on its platter in the File Write test. The Raptor basically eats the competition in all of the benchmarks except the Virus Scan where we obviously have an aberration in the scores.
We have included the RAID 0 results for the Seagate 7200.10 drive array featuring 1.5TB of storage capability. We see a 13% increase in the XP startup benchmark, a 12% decrease in the application loading benchmark, a 1% increase in the general usage score, an 11% decrease in the Virus Scan score, and a 94% increase in the File Write results. As we have stated in previous articles the performance of RAID 0 will improve specific benchmarks but the overall performance in the general application benchmarks did not improve beyond the margin of error in these test results. Although PCMark05 is a very good benchmark, we still have to wonder exactly how the Virus Scan and File Write scores are generated based upon our test results.
IPEAK Business Application Tests
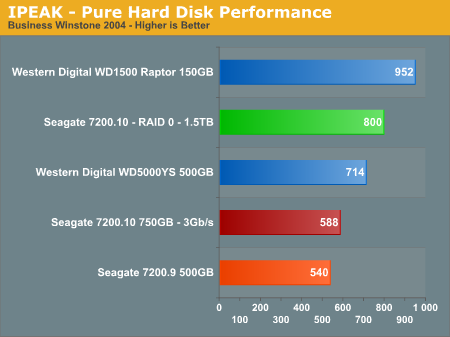
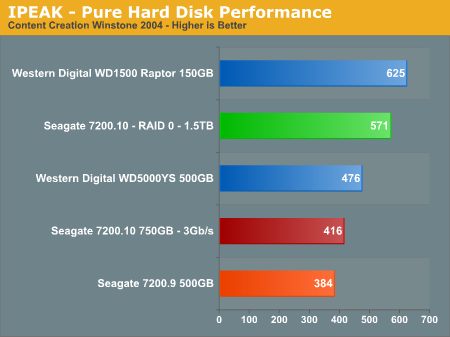
Our IPEAK Winstones benchmarks offer a glimpse into how well our hard disk drives will handle general office applications, media encoding, and graphics manipulation. While the business applications that are being tested tend to be more CPU bound at times, the performance of the hard drive can and will make a difference in the more disk intensive video and graphics applications where large media files are typically being edited.
As expected, the WD Raptor places first as its 10k RPM spindle speed and optimized cache play an important role in its ability to sustain high transfer rates, especially in the Content Creation benchmark where transfer block sizes are significantly larger than in the Business application benchmark.
The Seagate 7200.10 outperforms the 7200.9 by 9% in the Business test and 8% in the Media Content test. These scores are consistent with Seagate's claims that the 7200.10 should outperform the 7200.9 by 10% on average. The WD RE2 500GB drive makes a very strong showing in these benchmarks; obviously it continues the performance trend set by the WD RE2 400GB product. The RAID 0 performance of the Seagate 7200.10 is very good with drive performance increases of 36% in the Business test and 37% in the Content Creation test but still not enough to match the WD Raptor.
IPEAK General Task Tests
The IPEAK based General Task benchmarks are designed to replicate utility based application tasks that typically are disk intensive and represent common programs utilized on the majority of personal computers. While the WinRAR program is very CPU intensive it will typically stress the storage system in short bursts. Our antivirus benchmark will stress the storage system with continual reads and sporadic write requests while the defragmentation process is split between continual read and write requests.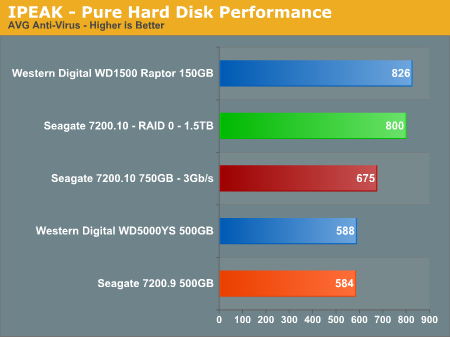
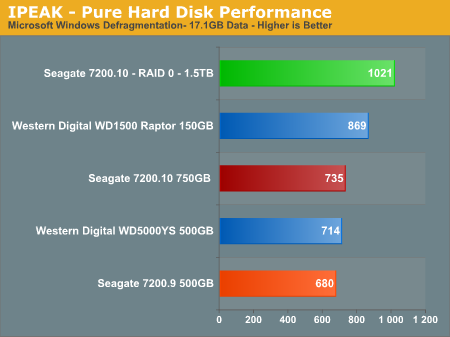
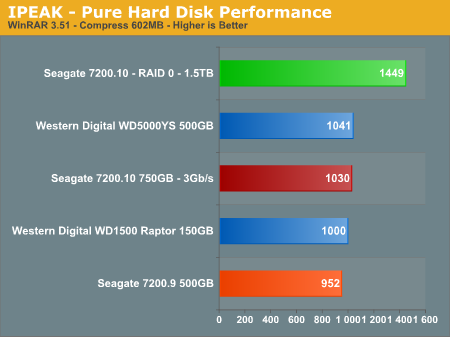
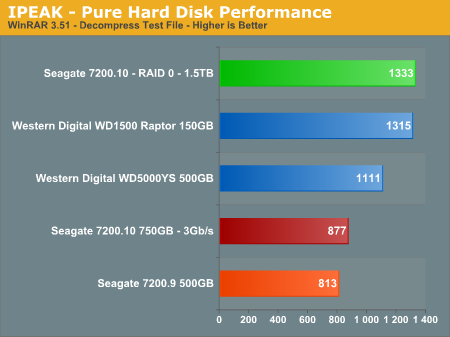
The Seagate 7200.10 RAID 0 combination scores first in three of the four tests with the WD Raptor close behind while the Raptor takes three of four tests in the single drive category. The Barracuda 7200.10 finally surpasses the WD RE2 and posts excellent scores in the very drive intensive antivirus and disk defragmentation benchmarks but falls up to 26% behind in the file decompression test. The Seagate 7200.10 outperforms the 7200.9 by 8% in the WinRAR tests, 8% in the defragmentation test, and 15% in the AVG antivirus benchmark that continues a steady pattern of improved performance for this series.
IPEAK File Transfer Tests
Our IPEAK based File Transfer benchmarks indicate how well a drive performs in a strictly read or write operation with a limited number of files (29) but a large amount of data (7.55GB). The test is designed to ensure continual write or read operations across a large section of the drive that requires constant track to track seek requests, actuator movements, and caching large amounts of data.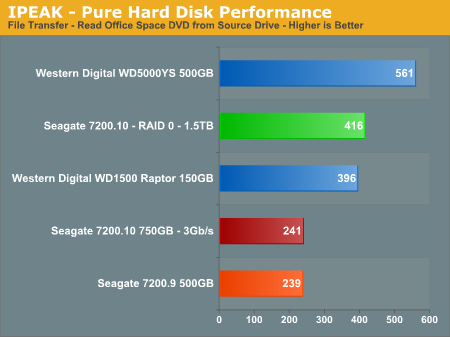
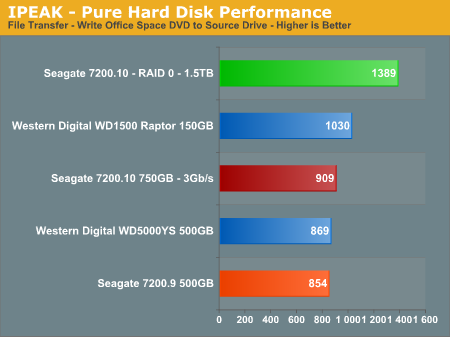
The write performance, and to some degree the read performance, of the 7200.10 RAID 0 combination is impressive in these benchmarks. While we are measuring the actual performance of the hard drive, this is one instance where the RAID 0 setup would show benefits in applications by reducing the time to transfer files.
The Seagate 7200.10 and 7200.9 read performance is dismal compared to the other drives while their write performance is very good. This is very interesting as their read performance in the antivirus test was very good. After further examination of the trace files we noticed the read requests in the antivirus test consisted of mostly small block sizes in irregular patterns compared to very large block sizes in a continual pattern in the file transfer test. It appears in our first couple of benchmarks that the read performance of the 7200.10 drive will be something of interest to look for in the balance of our tests.
Only the RAID 0 result saves the 7200.10 from a very embarrassing performance in this read benchmark and even then it fails to exceed the WD RE2 500GB drive. Speaking of the WD drive, we ran our test repeatedly, created a new trace file, changed drives, and then broke out the stop watch to verify the performance of this drive in our read test. The performance of this drive was fantastic in the read section and quietly fell in behind the Raptor and 7200.10 in the write performance benchmark.
IPEAK Video/Audio Tests
The IPEAK based Video/Audio benchmarks are designed around media encoding and simulating HTPC activities. These are basic benchmarks at this time as this section will be expanded greatly with some new tools that we have developed along with our business partners. Our change to a dual core processor will assist us in maintaining a balance between the CPU and Storage systems during the trace file creation and benchmarking processes. These benchmarks are CPU intensive in nature but also require a balanced storage system with the ability to handle read and write requests simultaneously in a very efficient manner.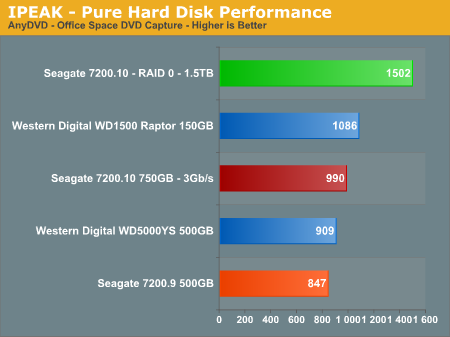
The AnyDVD benchmark is heavily weighted to write requests with the results showing the continued performance advantages of the WD Raptor at the expense of storage capacity, something our Seagate 7200.10 750GB drive has in excess. The performance of the 7200.10 is excellent with a 9% advantage over the WD RE2 and 16% over the 7200.9 drive.
The RAID 0 performance shows the continued strength of this combination in the more intensive I/O benchmarks. Any enthusiasm about the RAID 0 scores should be tempered by the fact that we are measuring hard disk I/O performance and not overall platform performance as several factors within your system can greatly mitigate any advantages we might see in these results. RAID 0 is generally useful in applications where data files are very large and/or data requests are highly sequential in nature, in this case our particular encoding and streaming benchmarks are fit for RAID 0 as it reduces our file transfer times within the actual application.
The NeroRecode 2 benchmark is weighted to streaming read requests but is balanced by continuous write operations. This benchmark is one of the most demanding ones in our test suite with the disk being active the entire trace file with several 100% utilization peaks. The Seagate 7200.10 posts the best scores here with a victory over the Raptor and finishing ahead of the other two 7200 RPM drives by 39%. The inconsistent read results we witnessed earlier were not evident in this benchmark.
Our video and audio encoding benchmarks while streaming a video feed continues to show the strength of the Seagate 7200.10 in the media application benchmarks. While falling behind the Raptor in these two benchmarks, this drive has no trouble finishing ahead of its main competition. The Seagate 7200.10 outperforms the 7200.9 by 12% in both of the media multitasking benchmarks. The drive has very balanced performance and would easily be at home in a HTPC configuration. In fact, this drive should have "PVR Recommended" stamped all over it provided the acoustic levels are acceptable.
IPEAK Game Installation Tests
Our IPEAK based Game Installation benchmarks simply show the ability of the hard drive to write data as quickly as possible to the disk based upon the installation software instructions. As detailed in our IPEAK setup description, we installed the games from our source drive in order to eliminate the optical drive bottleneck. In separate application timing we witnessed basically the same percentage spread when installing the games via our DVD drive so these results are representative of actual installation performance.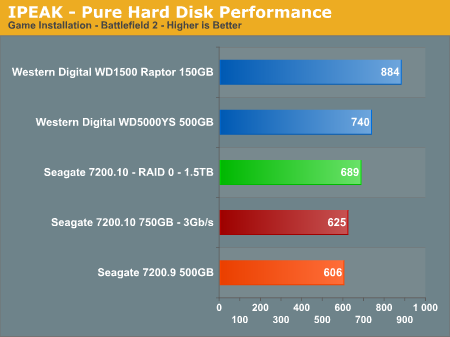
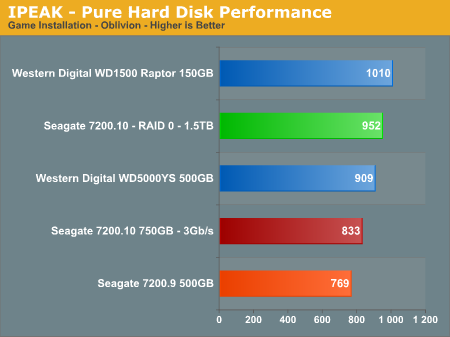
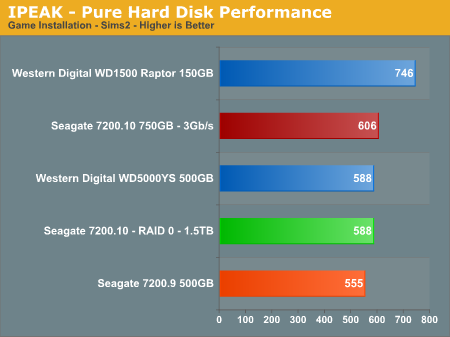
We see both WD drives performing very well in these benchmarks, with the speed of the WD Raptor along with its impressive and sustainable transfer rates simply dominating the other drives in these tests. The write performance of the Seagate 7200.10 is very good in the Sims 2 benchmark as the disk utilization numbers are very consistent along with a close grouping of block sizes. The drive seems to thrive on consistent read/write requests for medium to large size blocks of information with seek distances that are close to zero.
The performance of the Seagate 7200.10 trails off in the Oblivion and Battlefield 2 benchmarks as the disk utilization numbers begin to vary along with seek distances that are no longer clustered together. Considering the platter density used in this drive, if the requests do not involve data residing on the same track, then the cache buffer will probably not be able to satisfy the request resulting in a bottleneck effect due to track-to-track seeks or poor rotational latencies. The effects of RAID 0 in these tests are minimal with performance actually suffering during our Sims 2 load test, which is a more representative result with RAID 0 in actual application usage.
IPEAK Game Play Tests
The IPEAK based Game Play tests are centered on the benefits of having a hard disk that can load non-linear and/or sequential data files quickly without interrupting the flow of the game. While the benchmark numbers indicate the performance ability of the drives within the game, these numbers will not correlate into an increase in frame rates, only an improvement in level load times, game initiation, and general responsiveness of the storage system.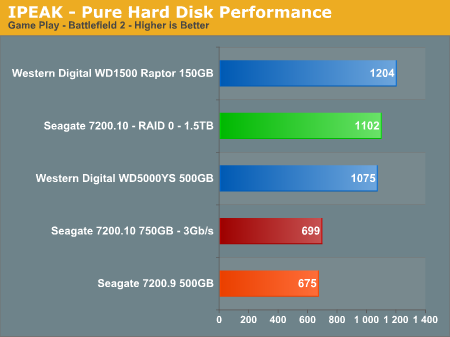

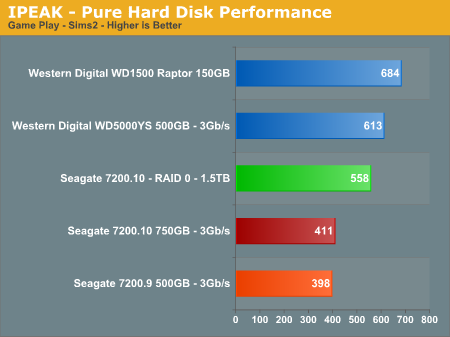
The Seagate drives struggle in these benchmarks compared to the Western Digital offerings. However, we did not notice any slowdowns or stuttering during actual game play or playback of our trace recordings to analyze the drive's performance. The Seagate 7200.10 outperforms the 7200.9 by 3% in Sims 2, 5% in Oblivion, and 4% in Battlefield 2. The RAID 0 performance in Battlefield 2 was impressive from an I/O perspective while during actual game testing the load time was improved by 7%. The RAID 0 performance in our other two games showed the typical increase in I/O performance but in actual game play it was not noticeable. The WD Raptor continues it dominance against other drives in the gaming benchmarks but the WD RE2 500GB makes a strong case as high capacity gaming drive.
After an analysis of our trace files we recognized a familiar pattern with the Seagate 7200.10 as the seek distances were not clustered together resulting in the inability of the drive to keep the requests cached resulting in a bottleneck effect during track to track seeks and the resulting rotational latency. This issue compounds itself on drives with multiple high density platters. Until we are able to review the smaller capacity drives in the 7200.10 series it will be difficult to determine if the drive requires additional firmware tuning for increasingly complex localized data access patterns, improved caching algorithms, or an increase in cache size to compensate for the 41% increase in platter density.
Actual Application Times
Our application time tests are designed to show application performance results with times being reported in minutes / seconds or seconds only with lower scores being better. While these tests will show some differences between the drives it is important to understand we are no longer measuring the pure performance of the hard drive but how well our platform performs with each individual drive. The performance of a hard drive is an integral part of the computer platform but other factors such as memory, CPU, core logic, and even driver choice can play a major role in determining how well the hard drive performs in any given task.Game Load Tests
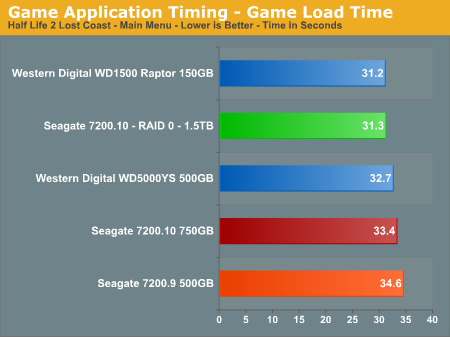
In our Half Life 2 - Lost Coast test we measure the time it takes to load the game with the application timer starting when the play game icon is initiated in the Steam menu until the Main game menu appears. The results follow our overall IPEAK game results with the Western Digital drives performing up to 10% better in this benchmark. The Seagate RAID 0 setup almost surpasses the WD Raptor in this test and performs slightly better than the single 750GB drive. We are still trying to develop a repeatable trace file for this game to include in our IPEAK test suite as the game has one of the longer loading sequences in our test library.
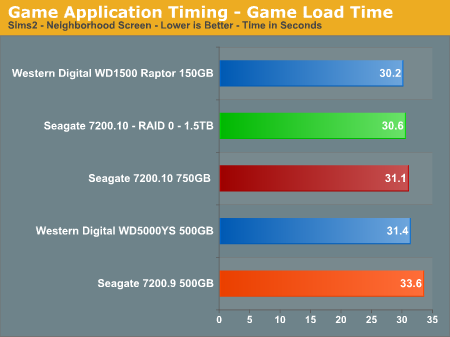
Our Sims 2 - Open for Business test measures the time it takes to load the initial portion of the game. Our application timer starts when the game icon is initiated until the neighborhood menu appears. The results are slightly different than our IPEAK results with the Seagate 7200.10 finishing ahead of the WD RE2 500GB drive. The RAID 0 setup offers a 1% improvement in this benchmark. The WD Raptor continues to lead all drives but the actual differences are so minor that any drive in our test roundup will be more than acceptable for general game play.
Game Level Load Tests
Our tests center around the actual loading of a playable level within our game selections.
- The Half Life 2 - Lost Coast test measures the time it takes to load a new game. Our application timer starts when the start new game icon is initiated and ends when the character is on screen with the 357 magnum visible.
- The Sims 2 - Open for Business test measures the time it takes to load the Downtown sector of the game from Veronaville. Our application timer starts when the Downtown game icon is initiated and ends when the downtown graphics are visible.
- The Battlefield 2 test measures the time it takes to load the Daqing Oilfields level. Our application timer begins when the start singleplayer icon is initiated and ends when the join game icon is visible.
- The Oblivion test measures the time it takes to load the Weye level in our saved game files. Our application timer begines when the load saved game icon is initiated and ends when the character is visible on screen.
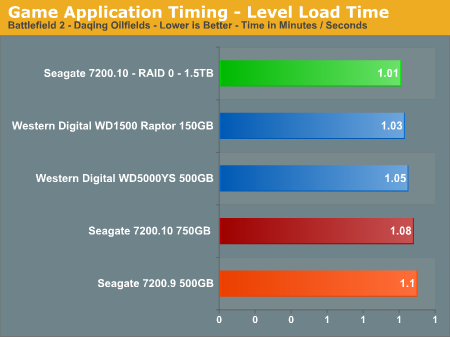
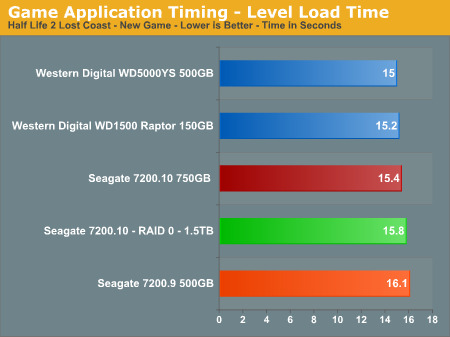
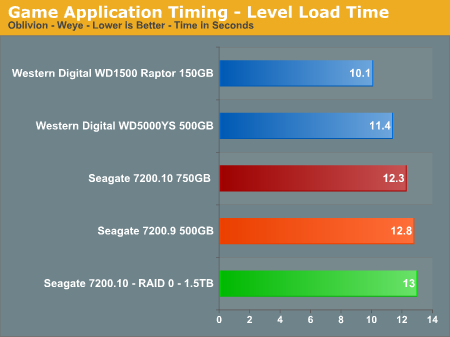
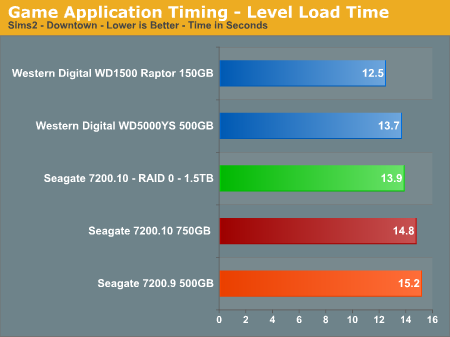
The WD Raptor continues its pattern of being the best available drive for the game enthusiast, although with a limited storage capacity it is certainly an expensive proposition for the general desktop user who typically will sacrifice speed for storage. RAID 0 finally shows up to the party and offers a 7% improvement in the Battlefield 2 scores but otherwise does not offer any tangible benefits, and it even posts slower load times in the Oblivion and Half Life 2 benchmarks. The Seagate 7200.10 does show improvements over the 7200.9 series and is competitive with the WD RE2 500GB drive these benchmarks.
WinRAR 3.51 Tests
Our WinRAR tests measure the time it takes to compress our test folder that contains 444 files, 10 folders, and contains 602MB of data. This is same test folder utilized in our IPEAK test suite. While the benchmark is extremely CPU intensive for the compression test it still requires a fast storage system to keep pace with the CPU.
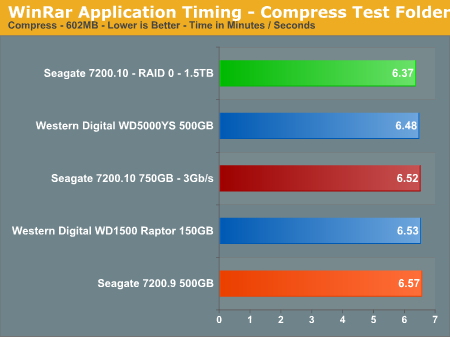
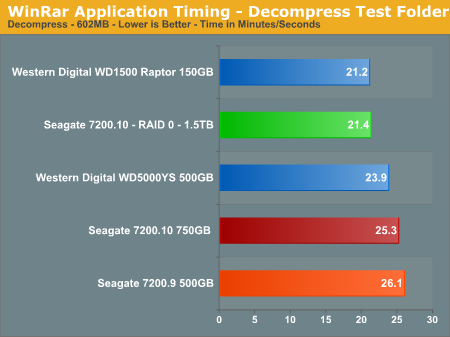
The compression tests mimic our IPEAK results with the WD RE2 500GB drive having the top score, followed by the Seagate 7200.10 unit. RAID 0 offers a 3% improvement in this benchmark where CPU choice is critical. In our testing with version 3.63 that fully supports multithreading, our dual core processor offers up to a 53% improvement in this benchmark. In our decompression test all of the drives are within a couple of percent of each other, with the Raptor back in the lead and our RAID 0 setup almost equaling its score.
AnyDVD 5.9.6
Our final test has us utilizing the "ripping" function of AnyDVD to copy the Office Space DVD file from our source drive to our test drive. Our DVD features 29 files totaling 7.55GB of data and is an excellent test for determining the write speed of a drive.
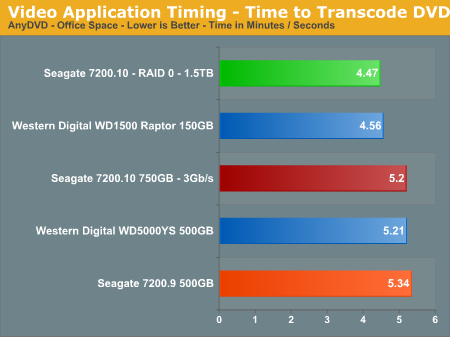
The test results show what we all know: speed kills. In this case, the WD Raptor posts an impressive score with the WD RE2 and Seagate 7200.10 finishing 13% behind. Our RAID 0 setup wakes up and finally takes a first place finish as the large sequential writes in this test are a natural fit for this setup. The Seagate 7200.10 continues to offer slightly better performance than the 7200.9 while providing a 50% increase in storage space, perfect for the audio/video enthusiast.
Acoustics
We have revised our acoustics testing methodology. Our acoustic test utilizes our standard test bed components but we implement AMD's Cool'n'Quiet technology and turn off the case fans to isolate as much case noise as possible during testing. Our OCZ power supply is virtually silent in these tests along with our fanless Asus 7600GS video card providing a further decrease in our case's ambient noise levels.Our acoustic tests are designed to measure the decibel levels while the system is at idle and also under load while running the General Hard Disk Drive Usage benchmark within PCMark 2005. We found through trail and error this particular benchmark produces controlled readings across a wide range of applications within the benchmark. This particular benchmark utilizes 60% reads and 40% writes within the trace playback file.
The measurements are taken at a distance of 5 millimeters from the rear and front of the drive being tested in order to minimize surrounding environmental noise. (Obviously, you won't have your head less than a centimeter away from the hard drive in normal computer use, but the important thing is the relative noise levels at this distance.) The reported measurements are based on an A-weighted decibel score that measures frequencies similar to the way the human ear responds to sound. We take a total of three measurements for each test. We then subtract the high and low scores and arrive at our findings by reporting the remaining score.
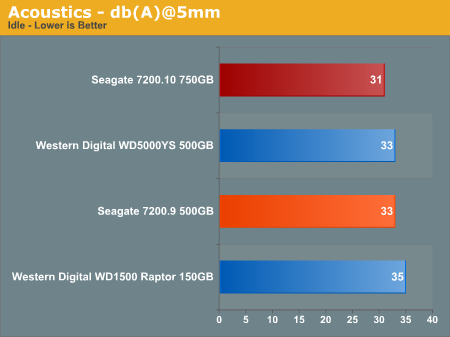
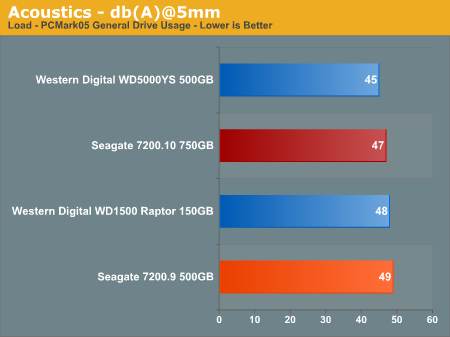
Seagate has advertised that the 7200.10 product is quieter in comparison to Barracuda 7200.9 in both idle and seek modes due to further refinements in their "Softsonic" motor technology. During our testing we came to a slightly different conclusion based upon our subjective test methodology. We found the 7200.10 drive recorded slightly better acoustic results in the instrument testing than the Seagate 7200.9 500GB drive but was subjectively louder than the 7200.9 500GB drive under load and almost matched our WD1500 Raptor in its very audible tone during full read requests.
This was surprising as the 7200.10 had the lowest idle rate of 31dBA in testing with full load tests generating a noticeable but not earth shattering 47dBA. The drive is basically a "silent" component in our case during idle conditions with only the occasional disc whirling but at full load the drive does generate a noticeable, almost thumping sound. In fact, although two of the drives tested are considered louder by our test equipment, the noise tone was slightly heavier which elicited our immediate attention to it. Of course, tone comments are generally very subjective so this drive could be considered quiet at full load when compared to other drives.
Thermals
Our thermal tests utilize sensor readings via the S.M.A.R.T. (Self-Monitoring, Analysis and Reporting Technology) capability of the drives and are reported by utilizing the Active SMART 2.42 utility. We test our drives in an enclosed case environment without the front fan operational to simulate temperatures that could conceivably be reached in a SFF or HTPC case design. We typically find the reported numbers drop anywhere from 18% to 25% on average when the front fan is operational.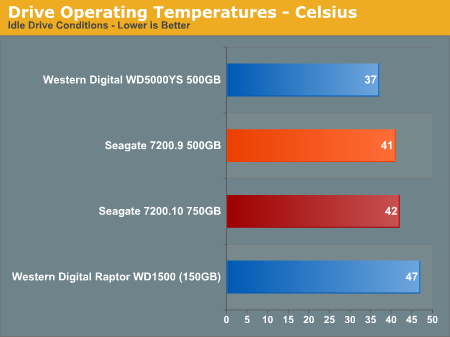
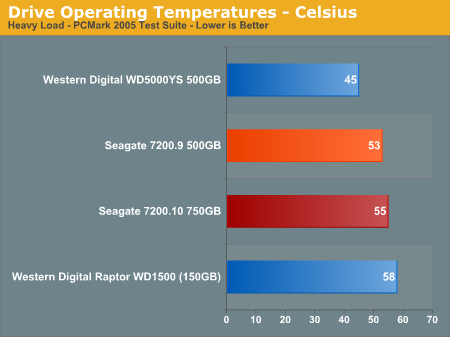
We expected the 750GB 7200.10 drive to run very warm due to its size and platter count. The drive ran cooler than we expected, but the casing did become very warm to the touch - almost hot actually - which had us concerned until we noticed the reported numbers. Using the drive's integrated SMART thermal sensor and Active SMART we were able to monitor temperatures that went from 42°C at idle to 55°C under full load. These results were recorded in our enclosed Gigabyte case without the front fan operating to simulate the effects of utilizing drive in a small enclosure for HTPC duties or possibly a poorly ventilated case.
We then activated the 120mm fan in the front of the case and watched the full load temps quickly drop to 44°C and after a cool down period of 15 minutes the idle temps dropped to 37°C with full load testing resulting in 47°C readings. We would highly recommend some type of cooling in front of the drive, especially in a SFF or HTPC case. Though the temperatures we reached without a fan are well within the operating range of the drive, it is always preferable to keep hard drives cool to prolong their life, especially at a $500 price point.
The surprise showing once again is the Western Digital WD5000YS drive with reported temperatures at idle of 37°C and 45°C at full load. The WD Raptor 1500 has the ability to sizzle some bacon with idle temps at 47°C and full load at 58°C with a hardy recommendation of adding a fan directly in front of this unit. The Seagate 7200.9 500GB falls in the middle of the pack with temps at idle of 41°C and under full load at 53°C. While the temperatures of the 7200.9 in our testing show an advantage without cooling, the drive actually ran hotter than the 7200.10 when both were cooled with the front case fan. Our recorded temperatures after the same cool down period (ambient room temp equal) resulted in 38°C readings at idle and 49°C readings at full load.
Final Words
The performance of the new Seagate Barracuda 7200.10 series keeps it promise by consistently outperforming the previous 7200.9 generation. This is truly impressive as the 7200.10 750GB drive we tested has 50% more capacity, perpendicular recording, and better acoustic results than the 7200.9 product. The thermal results of this drive are superior to the 7200.9 series as long as proper air circulation is provided around the drive. Seagate has taken a technology leadership position in the market for high capacity drives, a position we doubt Hitachi or Western Digital will be able to match in the near future. Seagate has suddenly made it easy and fairly cost effective to have multiple terabytes of storage capacity on the desktop with a drive that's oriented towards the performance market.We are sure this drive will be very successful in a market that constantly craves additional storage capacity and also requires performance levels befitting the asking price. Seagate has ensured the days of large storage drives only being offered in the slower 5400 RPM range or with other performance limitations are all but over with this product release. While some will find this drive extremely expensive, the normal practice of launching a new drive series at a $1 per gigabyte of storage space has also been swept away by Seagate. The 750GB drive is currently selling for around 66 cents per gigabyte and we fully expect the price to drop further as Seagate rolls out the balance of their 7200.10 drives with capacities ranging from 200GB to 500GB.
The performance of the drive in our testing was very good for an ultra-high capacity unit and in certain application benchmarks, where real world applications would benefit, performance was superb in RAID 0 operations. The Seagate 750GB was able to deliver a sustained transfer rate of over 66MB/s which is on par with the Western Digital 74GB Raptor, a significant achievement, and an indication of the performance potential still available in 7200 RPM drives as the platter densities increase. The Seagate 750GB drive certainly would have been considered at the top of the 7,200 RPM market sector except for the surprising performance turned in by the Western Digital WD5000YS in our IPEAK application benchmarks. Though we did not post the results for all of the pure synthetic test programs we utilized, we did see a pattern develop where the Seagate drive consistently outperformed all other 7200 RPM drives in these tests while trading places in the IPEAK application benchmarks with the Western Digital 500GB drive.
We did notice in certain IPEAK benchmarks where both Seagate drives have a tendency to perform poorly compared to the WD drives when the seek distances were not clustered tightly or on the same track. This results in the requests not being available on the expected track or in cache, causing the drive to seek the information across the disc resulting in a traffic jam effect caused by the track to track seeks and resulting rotational latencies. In our IPEAK testing, the Seagate 7200.10 drive seems to thrive on consistent read/write requests for medium to large size blocks of information providing seek distances are closely clustered. In our application test benchmarks, the drive faired better in the gaming benchmarks, indicating that while the pure hard drive performance is lacking when compared to the WD drives, the drive would be a very solid choice for a gaming machine.
While the WD RE2 500GB drive is targeted for the near-enterprise market and is based on Raptor technology, we believe Seagate will need to match or even better its performance with their new 7200.10 500GB drive. Our true hope is that Seagate releases a single or two platter version of this drive at a 10,000 RPM spindle rate in order to compete with the WD Raptor. While we understand this move could certainly cannibalize their 10K enterprise product line, it would be nice to have a choice in the ultra-enthusiast market sector for SATA storage devices. With that said, we feel like the 320GB version of this drive with a 2 platter design will be the sweet spot for cost, storage capacity, and performance capability in this drive series.
Throughout a grueling test schedule that included over 240 hours of drive testing, we did not find or experience any quality issues with this drive. However, the one quibble we have with the drive would be the tones emitted while under full load when seeking or writing data. While the sounds would probably not be noticeable in most situations, we were able to hear the drive during full seek or read requests while it was in our test bed. The test equipment told us otherwise, but when comparing the drive to the 7200.9 series our ears found it to be louder at times. While the drive runs surprisingly cool with a small amount of air circulation around it we would not be willing to operate this drive on a 24/7 basis in an HTPC or SFF enclosure without a fan cooling it. This is still impressive performance, considering the capacity of the drive and how drives of this size generally run on the hot side even with active cooling.
We applaud Seagate for bringing perpendicular recording technology to the mass market this quickly. We can certainly attest to the benefits of this technology after spending significant time with this drive. However, as with all new technology, it will be difficult to ascertain its true performance potential along with any potential quality issues without a significant amount of user interaction with the product. Seagate is acutely aware of potential buyer reluctance in embracing a new drive technology and is offering five year warranties on the product. We know Seagate is extremely confident in perpendicular recording technology as they are currently in the process of implementing this technology across their main product lines. We doubt they would have made this commitment to perpendicular recording and risked the very future of the company on an unproven technology. Considering the other drive manufacturers are moving to perpendicular recording, it appears this technology will be the industry standard in the foreseeable future.
What is our recommendation? If storage capacity is your primary concern and your budget allows it, then purchase this drive. It offers superb single-user performance for an ultra-high capacity hard disk and would be an excellent choice for the home theater computer or any video or audio workstation with proper active cooling.


