Original Link: https://www.anandtech.com/show/2117
Intel P965: The Double Mint Twins Gone Wild
by Gary Key on November 9, 2006 8:00 PM EST- Posted in
- Motherboards
At various times we will see some interesting products come through the labs and wonder why no one had thought of a certain idea before now. After spending a great amount of time with fifteen different P965 boards we were on the lookout for something what would really set one board apart from the others. We wondered if this would be possible as all of the motherboards offered the same chipset combinations and the manufacturers have the same peripheral options at their disposal. Considering the consolidation in the motherboard manufacturing sector it was going to be surprising to us if any of the boards did not follow a standard cookie cutter layout and feature list based on market segments.
It seemed to us the cookie cutter approach is exactly what happened as each series of boards fell into certain price segments with each offering almost the same feature list as you moved into ever higher price ranges. The true P965 budget boards all feature the same list of components and all overclock mildly with the only differences being in layout design - and even that is minimal at best. The mid-range sector we recently reviewed all performed nearly identically and offered the same basic features with prices being within a few dollars of each other. The high end sector boards all offer CrossFire support, unique cooling solutions, and additional features such as WiFi support or increased SATA ports. While they may appear to be different on the surface due to color schemes or minor layout changes, most offerings are basically the same except for the name on the box.
Sure we had Universal Abit trying to differentiate their product with the unusual layout design on the AB9-Pro along with a pink BIOS color scheme. While we give them full credit for at least trying to stand out from the crowd we think they ended up being out in left field with a board layout that made absolutely no ergonomic sense at all. There were other minor infractions from all of the suppliers in trying to be different but none of this usually matters if the board's performance and quality are up to standards. While we desperately wanted to see something truly interesting in our collection of boards we resigned ourselves to the fact this probably would not happen given the mass market sales and pricing targets of our test group.
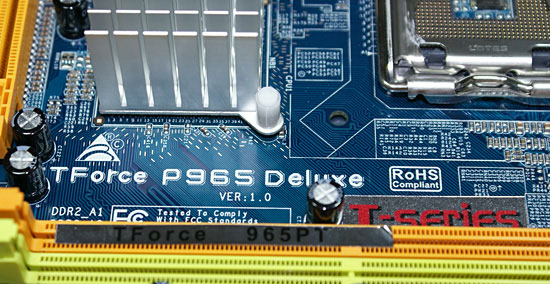
During testing it became obvious that we had two boards that stood out from the rest of the group and not because they were different. In fact, they grabbed our attention because they followed the cookie cutter process only with a twist. The first board that grabbed our attention is the Biostar TForce 965PT that is based on the Biostar TForce P965 Deluxe platform. In fact, if you peel the product label off the board you will see the P965 Deluxe silkscreen. The only difference between the two Biostar boards is the Intel ICH8 is used in place of the ICH8R found on the P965 Deluxe and a slightly different BIOS. Otherwise all of the positive aspects of the P965 Deluxe carry over to this board along with a $45 decrease in pricing. Gigabyte followed a similar path as the Gigabyte GA-965P-S3 is identical to the GA-965P-DS3 except for the type of capacitors utilized on the board and a different BIOS revision while reducing the price by $30. While not identical twins, both boards are close enough to their more expensive siblings to be considered fraternal twins in our opinion.
We originally had both of these boards in our budget category but based upon their performance and pricing right over the $100 mark we decided to separate them from our three truly budget (at least for the P965 chipset) motherboards from ECS, MSI, and Foxconn. While the stock performance between all five boards is within a couple of percent depending upon your memory choice, it was the overclocking capability of the Gigabyte and especially the Biostar board that dictated a change in our classification. In fact, the Biostar TForce 965PT board at $104.99 might just change how we look at overclocking on the Intel platform from a price/performance viewpoint. If Gigabyte can finally solve their Micron D9 issues then the GA-965P-S3 board will also fall into this new performance oriented budget category.
Let's get started and see how well our twins perform today.
Biostar TForce 965PT: Feature Set
| Biostar TForce 965PT | |
| Market Segment: | Budget Performance - $104.99 |
| CPU Interface: | Socket T (Socket 775) |
| CPU Support: | LGA775-based Pentium 4, Celeron D, Pentium D, Pentium EE, Core 2 Duo, Core 2 Extreme |
| Chipset: | Intel P965 + ICH8 |
| Bus Speeds: | 100 to 600 in 1MHz Increments |
| Memory Speeds: | Auto, 533, 667, 800 |
| PCIe Speeds: | Auto, CPU Linked, Fixed at 100MHz, 100MHz~200MHz |
| PCI: | Fixed at 33.33MHz |
| Core Voltage: | Startup, 1.10000V to 1.80000V in 0.00625V increments |
| CPU Clock Multiplier: | Auto, 6x-11x in 1X increments for Core 2 Duo |
| DRAM Voltage: | 1.8V, 2.0V, 2.1V, 2.2V |
| DRAM Timing Control: | SPD, 8 DRAM Timing Options |
| NB Voltage: | Auto,1.25V, 1.35V, 1.45V, 1.55V |
| FSB Voltage: | 1.2V, 1.3V, 1.4V, 1.5V |
| Memory Slots: | Four 240-pin DDR2 DIMM Slots Dual-Channel Configuration Regular Unbuffered Memory to 8GB Total |
| Expansion Slots: | 1 - PCIe X16 1 - PCIe X4 1 - PCIe X1 3 - PCI Slot 2.3 |
| Onboard SATA/RAID: | 4 SATA 3Gbps Ports - Intel ICH8 No RAID Capability |
| Onboard IDE: | 1 Standard ATA133/100/66/33 Port (2 drives) - VIA VT6410 |
| Onboard USB 2.0/IEEE-1394: | 10 USB 2.0 Ports - 6 I/O Panel - 4 via Headers No Firewire Support |
| Onboard LAN: | Gigabit Ethernet Controller - PCI Express Interface Realtek RTL 8110SC |
| Onboard Audio: | Realtek ALC883 HD-Audio 8-channel CODEC |
| Power Connectors: | ATX 24-pin, 4-pin EATX 12V |
| Fan Connectors: | 3 - CPU, Chassis, System |
| I/O Panel: | 1 x PS/2 Keyboard 1 x PS/2 Mouse 1 x Serial 1 x Audio Panel 1 x RJ45 6 x USB 2.0/1.1 |
| BIOS Revision: | AWARD P96CA914BS |
The Biostar TForce P965 Deluxe motherboard has been one of our favorite boards in the labs as we think it has one of the best blend of performance, options, and price. However, Biostar has not been able to supply the board due to Intel ICH8R chipset shortages. This problem seems to be easing currently and we expect the board to be available in volume later this month. Faced with this supply issue Biostar decided to offer the P965PT with the only differences being the ICH8 chipset is used instead of the ICH8R and a few minor BIOS changes. The BIOS does not offer the same MCH voltages nor can you change the multiplier downward with it.
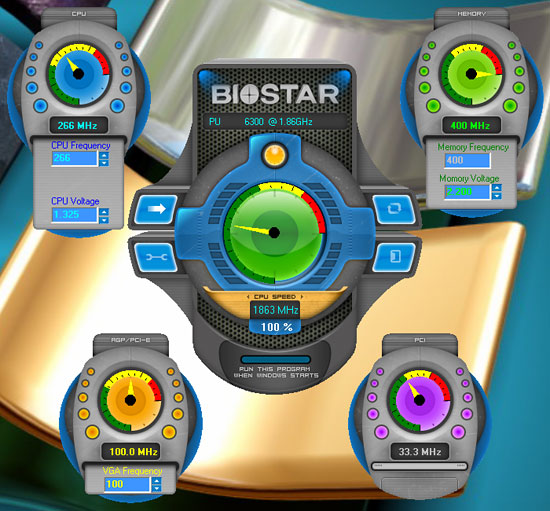
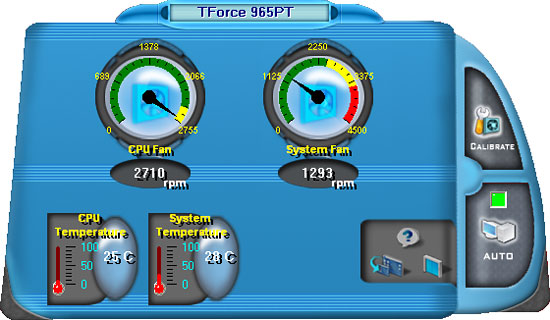
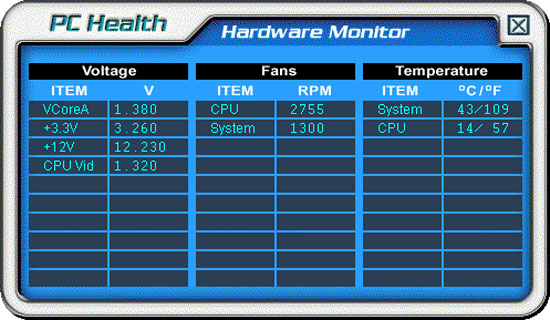
Biostar includes several software utilities with the board: an Overclock Program, Hardware Monitoring application, Smart Fan Utility, and an online BIOS update applet. The overclock utility allows for limited changes to the FSB and basic system voltages. The smart fan utility allows control of the CPU and main system fan header within Windows, although the BIOS options are more significant in regards to temperature control. The Hardware monitoring utility allows for real-time monitoring of CPU temperature, CPU fan speeds, and basic system voltages. Biostar includes an automatic overclocking utility in their BIOS that offers three different settings named V6, V8, and V12.
We once again selected the V12 setting in the BIOS and after a quick reboot our speeds increased to Ford Escort performance this time around. The asphalt ripping speeds of our V12 equipped Escort netted us a 2037MHz CPU speed via a 7x291FSB and DDR2-723 memory speed. However, the system was smart enough (unlike our other boards) to actually set the memory timings at something other than an ultra safe 5-5-5-15 setting with actual timings at 4-4-4-10. This is unusual as this BIOS will default to DDR2-667 (4:5) settings with timings at 5-5-5-15 when left on auto settings. Overall, the automatic overclocking worked without any issues and provided an increase in speed just as Biostar intended, although we expected a little more from a beefy V12.
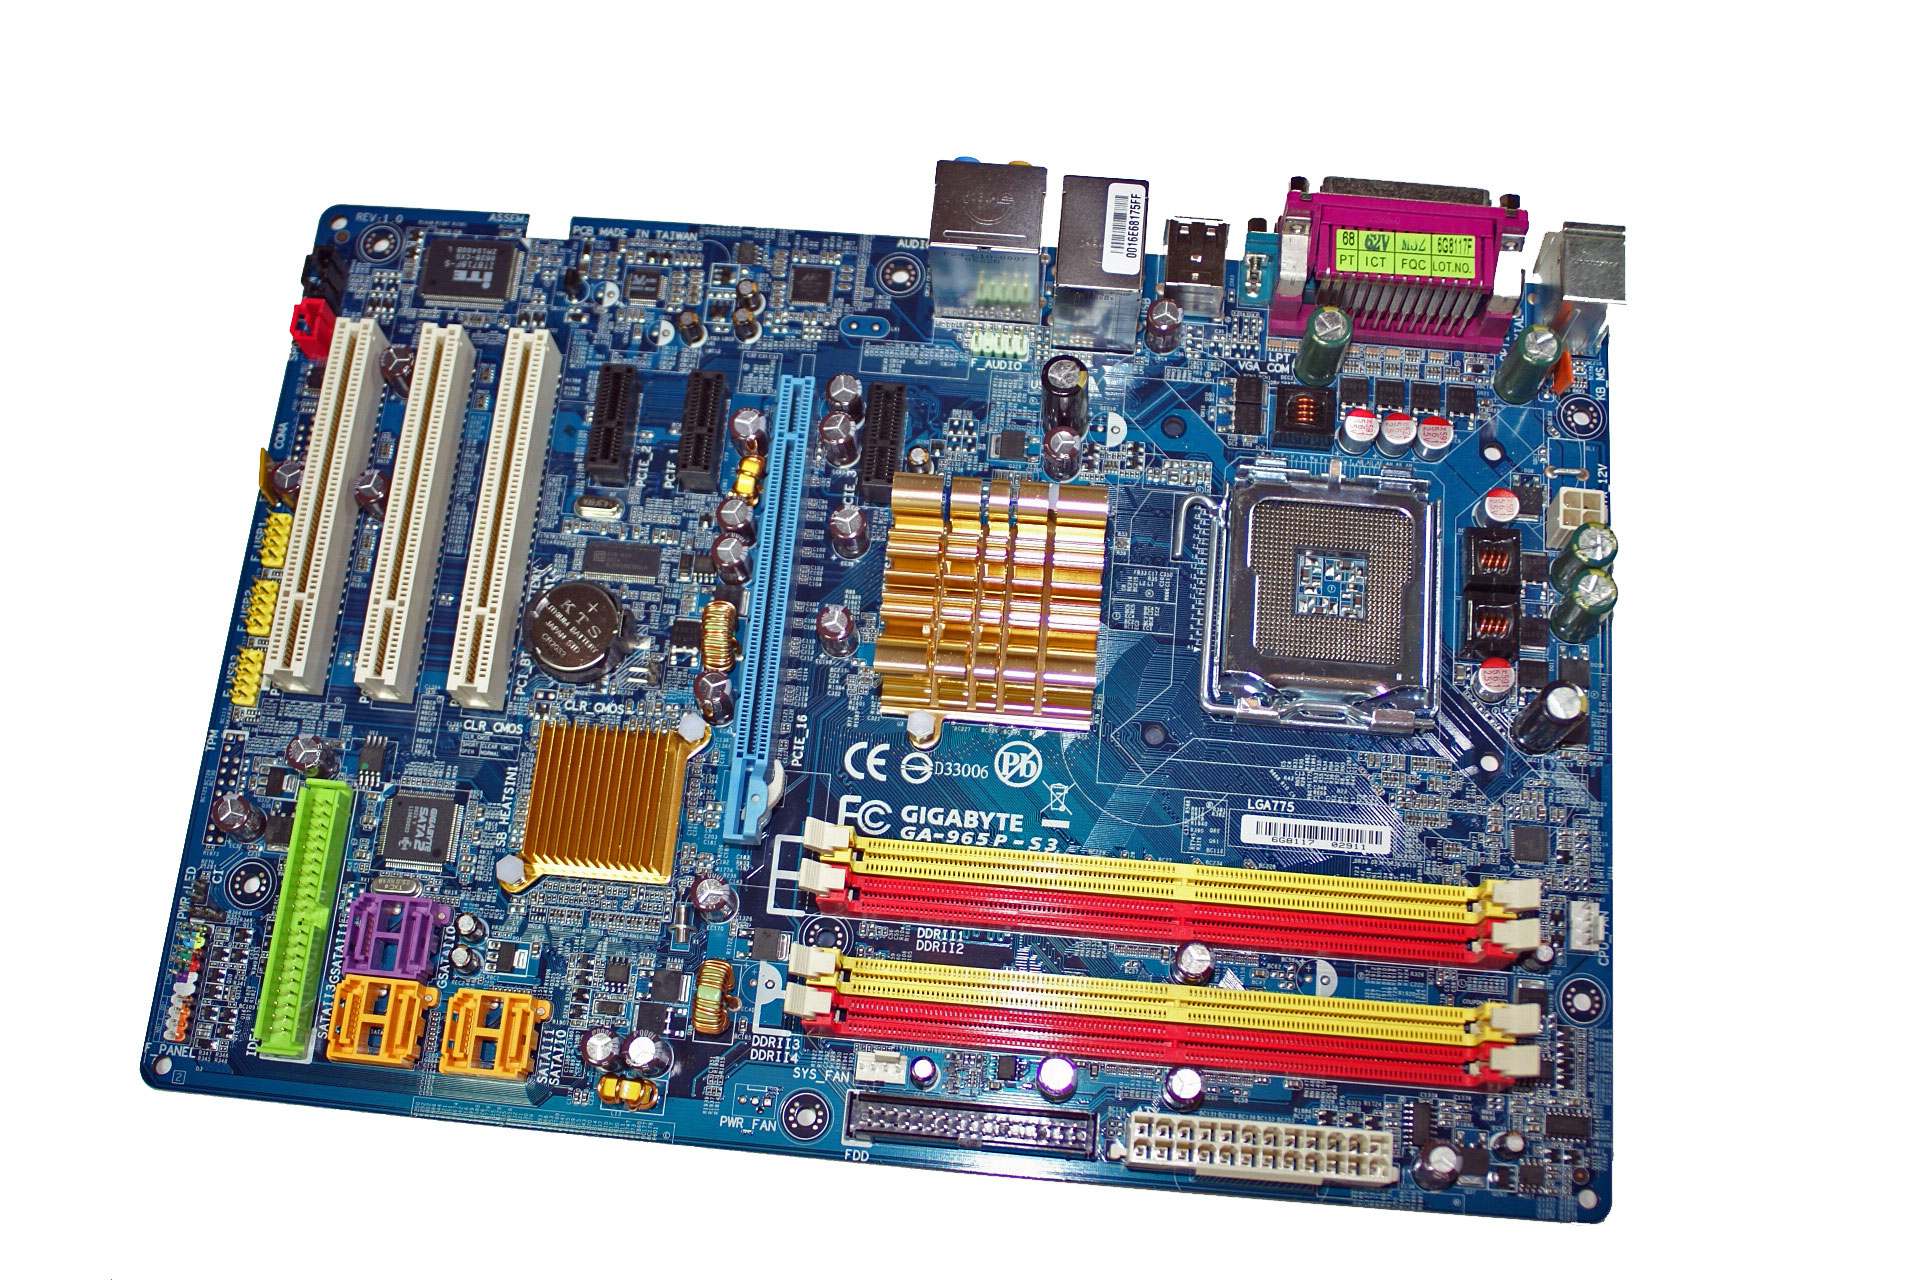
Biostar TForce 965PT: Board Layout and Features
 |
| Click to enlarge |
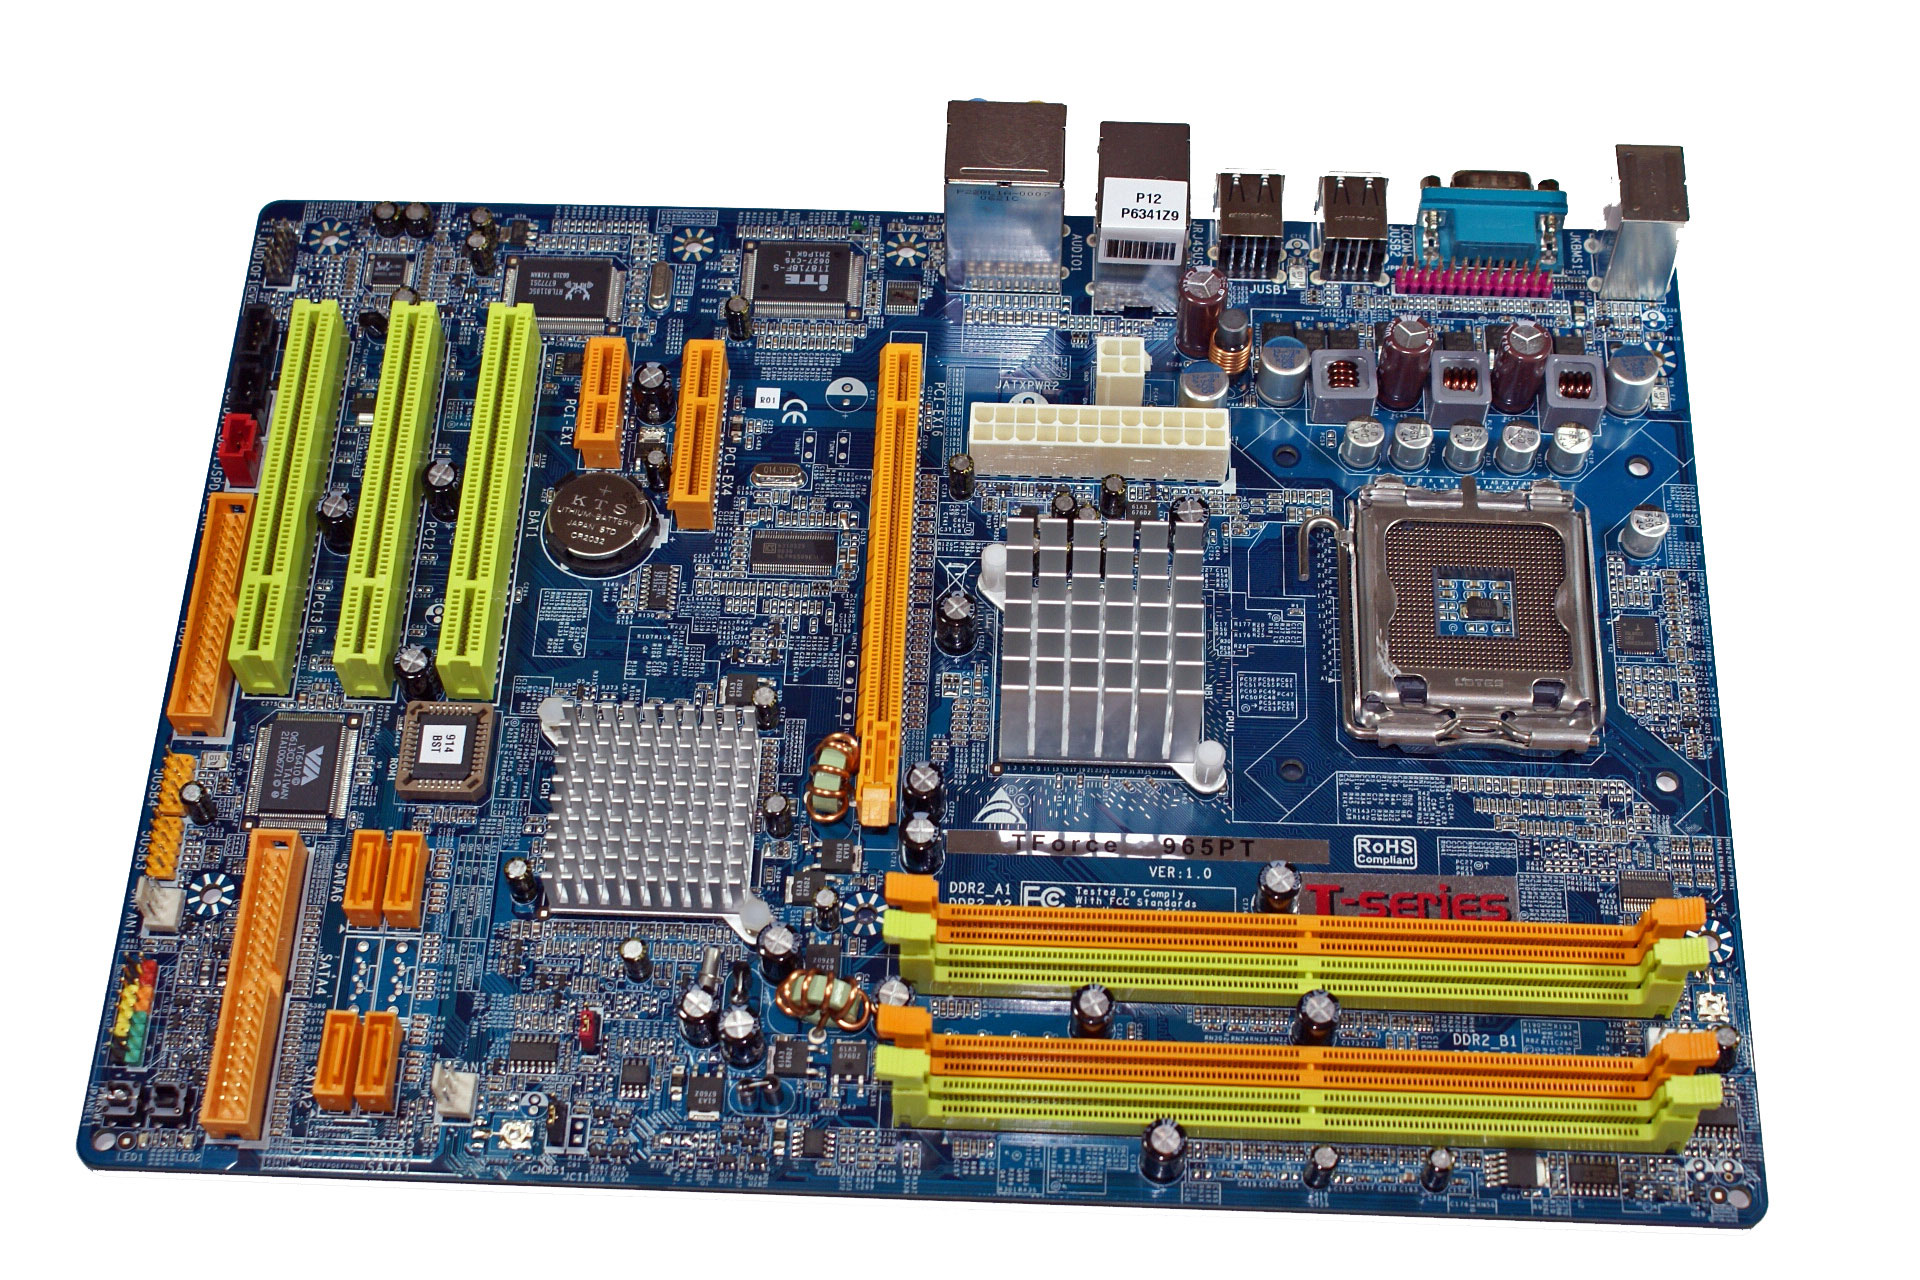
Our opinions of the board are the same as the P965 Deluxe since it is actually the same board sans two SATA ports. The board is laid out nicely, the color combination grabs your attention, and it was extremely easy to install in our Cooler Master CM Stacker 830. However our concerns remain the same as the location of the 24-pin and 4-pin ATX connectors near the CPU area could cause cable management issues with larger air coolers like the Scythe Infinity. We also recommend installing the 4-pin ATX connector first as it is difficult to attach it with the 24-pin cable already installed. The board features a total of three fan headers. A fourth one would have been preferred near the I/O panel. The board features a three-phase voltage regulator system that provided superb stability throughout our testing.
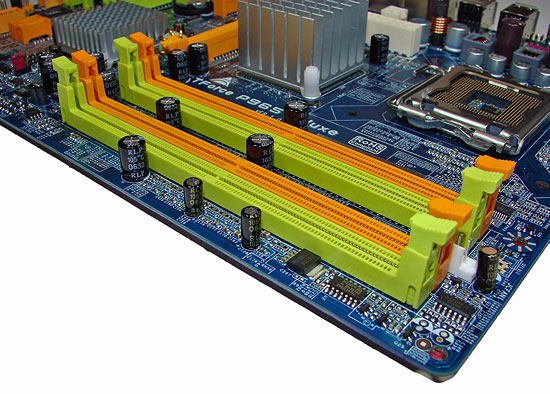
The DIMM module slots' color coordination is correct for dual channel setup based upon the premise of installing DIMMs in the same colored slots for dual-channel operation. It is impossible to install memory modules with a full size video card placed in the PCI Express x16 slot. Biostar places the CPU fan header in between the number two and three memory module and it is a fair distance to reach for most CPU fan/heatsink cables.
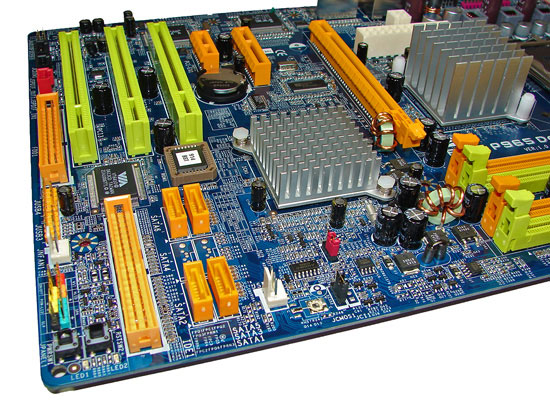
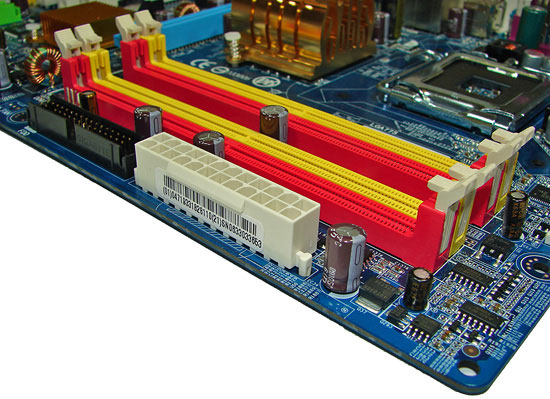
The four Intel ICH8 SATA ports are orange and are conveniently located to the left of the ICH8 Southbridge and second fan header. The SATA ports feature the newer clamp and latch design. We found the positioning of the SATA ports to be very good when utilizing the PCI 2.3 slots. The ICH8 is passively cooled and remained cool to the touch throughout testing.
The clear CMOS jumper is color coded black and is located in an easy access location at the edge of the board near the second fan header. Biostar includes a power on and reset button at the bottom corner of the board next to the VIA IDE connector. This is one option we wish all performance oriented boards would include. The chassis panel, third fan header, and USB connectors are located along the left edge of the board.
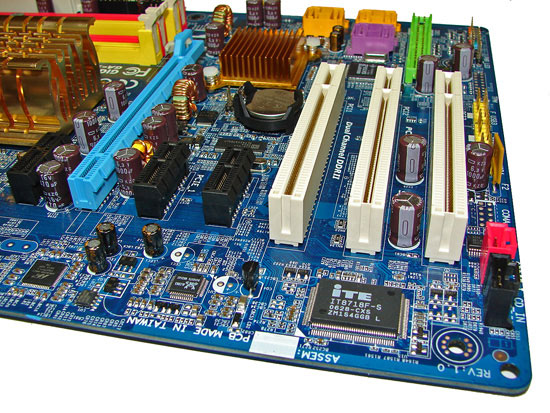
The board comes with one physical PCI Express x16 connector, one PCI Express x4, one PCI Express x1, and three PCI 2.3 connectors. The layout of this design offers one of the best single x16 connector designs we have worked with as none of the slots are blocked when using a dual slot video card in the x16 slot. We have to give credit to Biostar for this impressive layout and combination of slots on a budget board. However, the sacrifice for this layout is the inability to change memory modules with most video cards installed. The floppy drive connector is located at the edge of the board next to the last PCI slot. We would just as well have this connector disappear at this time.
 |
| Click to enlarge |
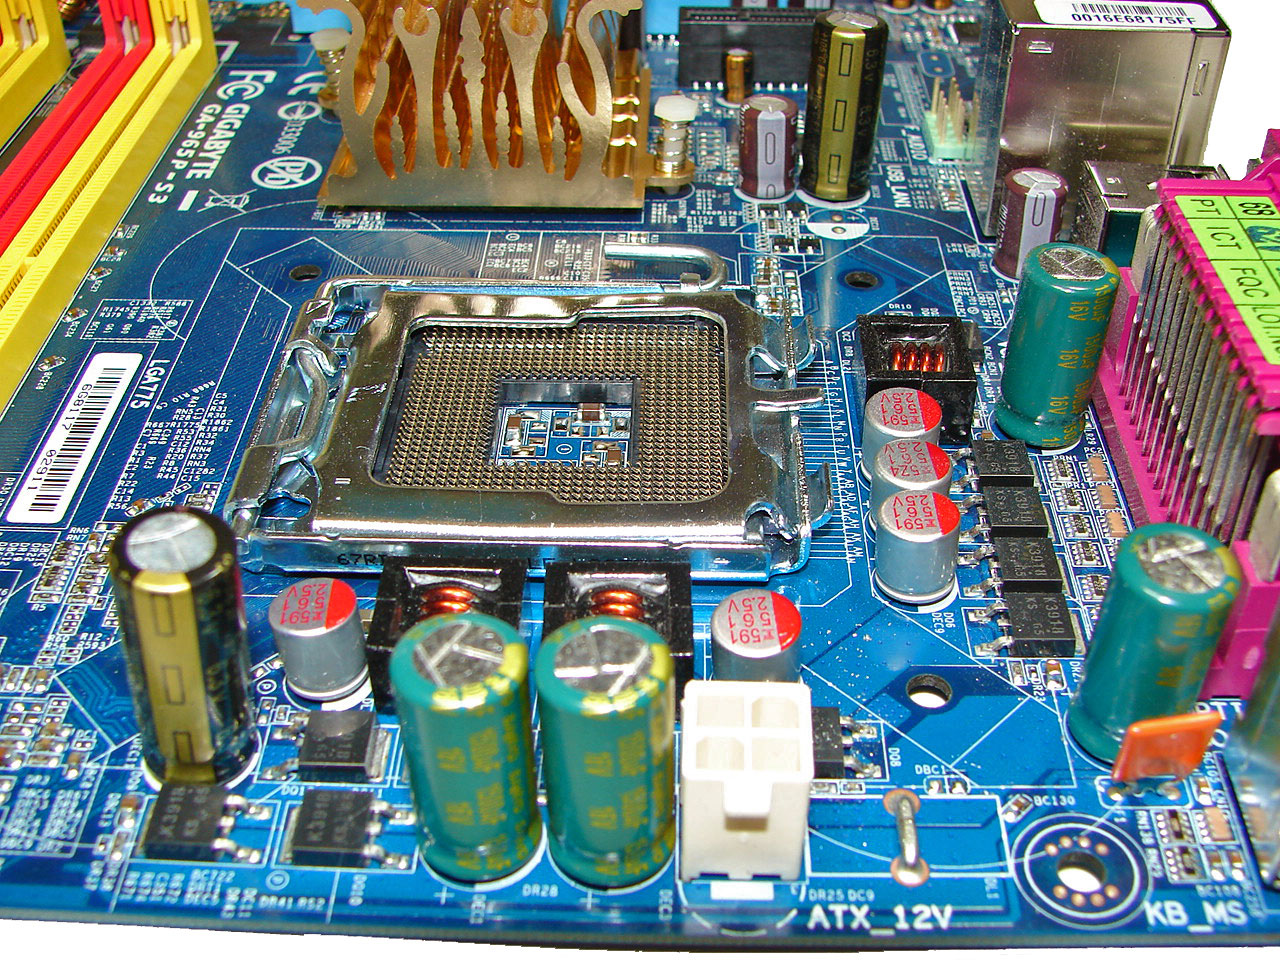
Getting back to CPU socket area, we find a fair amount of room for alternative cooling solutions. We utilized the stock heatsink/fan in our normal testing but also verified a few larger Socket-775 air cooling solutions would fit in this area during our overclocking tests. The Intel P965 MCH chipset is passively cooled with a mid-rise heatsink unit that did not interfere with any installed peripherals. However, it was very difficult routing the ATX power cables to their connectors with a cooling solution like the Tuniq Tower 120 installed. Fortunately our power supply had cables that were sleeved that allowed us to bend the cables around the heatsink area without worrying about ripping a wire open. When we removed the heatsink we found Biostar had used paste instead of the typical concrete hard pad. This explained why the heatsink generally ran cooler than our other P965 offerings, although Biostar could save some money considering there was enough paste available to install three heatsinks.
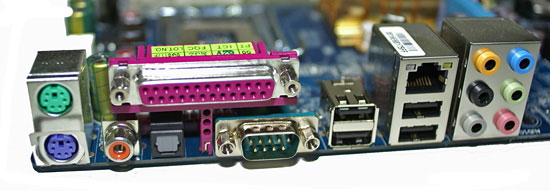
The rear panel contains the PS/2 mouse and keyboard ports, LAN port, and 6 USB 2.0 ports. The LAN (RJ-45) port has two LED indicators representing Activity and Speed of the connection through the Realtek RTL8110SC Gigabit PCI-E chipset. The audio panel consists of 6 ports that can be configured for 2, 4, 6, and 8-channel audio connections for the Realtek ALC 883 HD codec. The panel also has a serial port and we would have preferred an S/PDIF optical out port to have been included in this area.
FSB Overclocking Results
| Biostar TForce 965PT Overclocking Testbed |
|
| Processor: | Intel Core 2 Duo E6300 Dual Core, 1.86GHz, 2MB Unified Cache 1066FSB, 7x Multiplier |
| CPU Voltage: | 1.4750V (default 1.3250V) |
| Cooling: | Scythe Infinity Air Cooling |
| Power Supply: | OCZ GameXStream 700W |
| Memory: | Geil PC2-6400 800MHz Plus (2x1GB - GX22GB6400PDC) (Micron Memory Chips) |
| Alternative Memory: | Crucial PC2-5300 667MHz (2x1GB - TY2KIT12864AA663) (Micron Memory Chips) |
| Video Cards: | 1 x MSI X1950XTX |
| Hard Drive: | Seagate 320GB 7200RPM SATA2 16MB Buffer |
| Case: | Cooler Master CM Stacker 830 |
| Maximum CPU OC: (GEIL Memory) |
505x7 (4-4-4-12, 1:1), C1 Stepping 3539MHz (+90%) |
| Maximum CPU OC: (Crucial Memory) |
490x7 (4-4-4-12, 1:1),C1 Stepping 3432MHz (+84%) |
| . | |
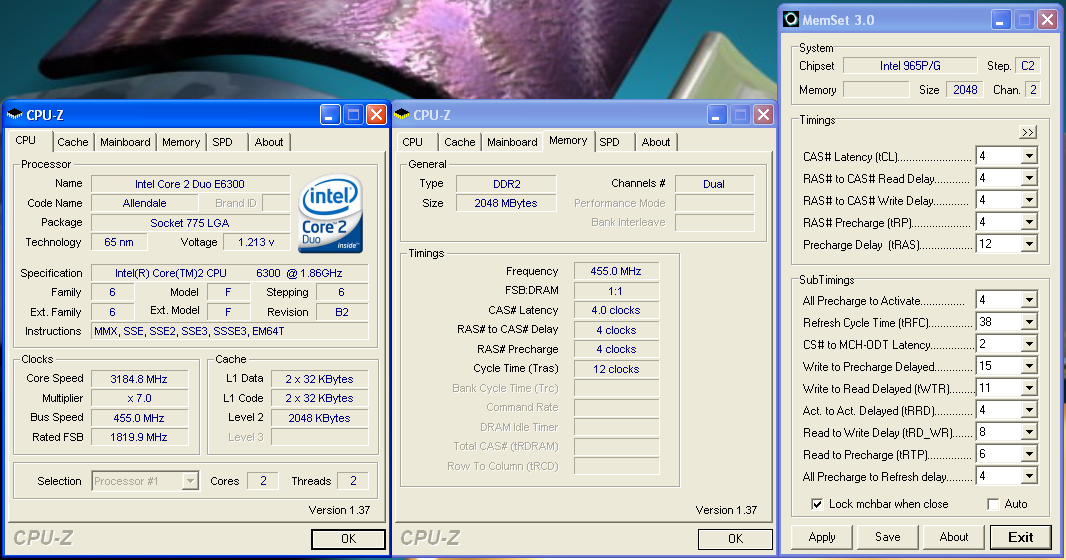
 |
 |
| Click to enlarge |
We were easily able to reach a final benchmark stable setting of 7x505 FSB resulting in a clock speed of 3539MHz. The board was actually capable of running at 7x520 FSB but would consistently fail our Dual Prime95 test along with a few game benchmarks. We settled on a 7x505 FSB setting and set our VCore to a very acceptable 1.475V with Vdroop being around .02~.03V during load testing. We were able to operate our GEIL memory at 5-4-4-12 at 2.20V at the maximum POST speed of 7x520 FSB and 4-4-4-12 at 2.20V at 7x505 FSB.
We had several requests to test our boards with memory that was more affordable so we chose the Crucial Tenth Anniversary 2GB DDR2-667 kit that is selling for around $230 currently. This memory is rated at 3-3-3-10 at DDR2-667 and has reached DDR2-1020 on our ASUS P5B-E 1.02G board with 2.30V. We were able to overclock the Crucial memory to DDR2-980 with settings of 4-4-4-12 and 2.20V on the Biostar board. We could have gone higher if the BIOS supported a 2.30V memory option. Our overall overclock results on the 965PT are still amazing for a "budget" motherboard.
Although not shown in our charts we had one anomaly with the 965PT board when overclocking and using memory ratios other than 1:1. We generally found the 4:5 memory ratio to be flaky once we hit a 300 FSB rate even with memory that fully supports DDR2-1066 timings. This issue did not occur with the P965 Deluxe so we attribute it to the BIOS at this time.
Memory Stress Testing
Memory Tests
 |
| Click to enlarge |
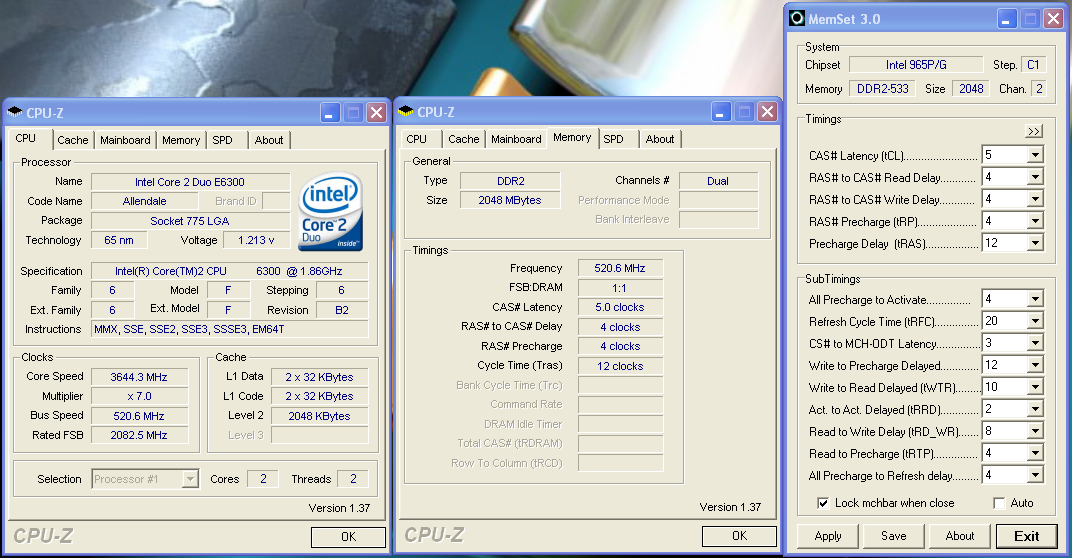
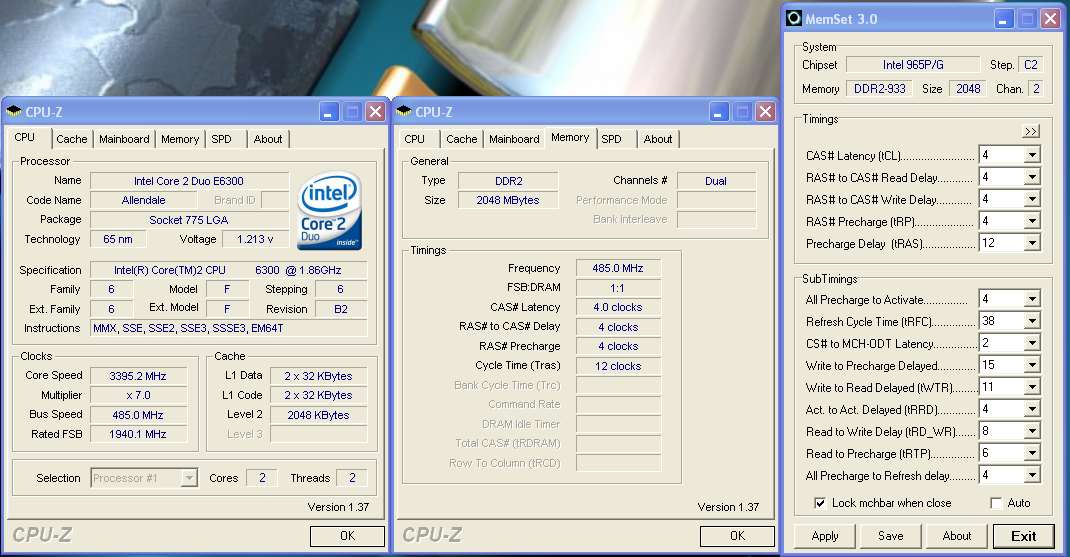
We'll take a look now at seeing how well our GEIL PC2-6400 memory operates in this board in both two and four DIMM testing. The screenshot above shows the actual memory settings used in our benchmark tests of the board. We do not modify the memory timings beyond the four major settings in our charts. The balance of memory settings is implemented automatically via the BIOS. Biostar implements slightly tighter memory and MCH timings than ASUS or Abit resulting in minor performance differences in our benchmark testing.
| Biostar TForce 965PT Stable DDR2-800 Timings - 2 DIMMs (2/4 slots populated - 1 Dual-Channel Bank) |
|
| Clock Speed: | 800MHz |
| CAS Latency: | 3 |
| RAS to CAS Delay: | 3 |
| RAS Precharge: | 3 |
| RAS Cycle Time: | 9 |
| Voltage: | 2.20V |
We were able to set our timings to 3-3-3-9 by increasing the memory voltage to 2.20V with our GEIL memory. We were able to hold these timings up to DDR2-840 on this board along with timings of 3-4-4-9 up to DDR2-860. The board ran at 4-4-3-10 up to DDR2-910 before switching to the final overlclock settings of 4-4-4-12.
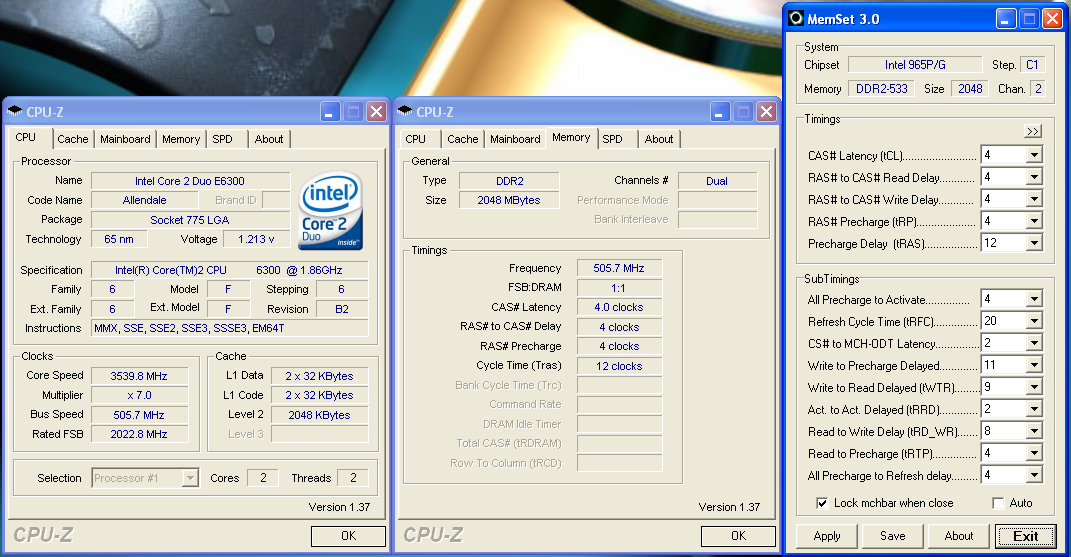
| Biostar TForce P65PT Stable DDR2-800 Timings - 4 DIMMs (4/4 slots populated - 2 Dual-Channel Bank) |
|
| Clock Speed: | 800MHz |
| CAS Latency: | 3 |
| RAS to CAS Delay: | 4 |
| RAS Precharge: | 4 |
| RAS Cycle Time: | 10 |
| Voltage: | 2.20V |
Our settings of 3-4-4-10 at 2.20V were not quite as good as our ASUS P5B-E 1.02G settings of 3-4-3-10 but due to tighter overall memory latencies as the clock speeds were increased the benchmarks were still competitive. We were able to keep this setting up to DDR2-820 before switching over to 4-4-3-10 settings that held stable until we reached DDR2-890. We then kept a setting of 4-4-4-12 at 2.20V up to our final overclock setting of 7x475, 3325MHz, with four DIMMs installed.
Gigabyte GA-965P-S3: Feature Set
| Gigabyte GA-965P-S3 | |
| Market Segment: | Budget Performance - $115.99 |
| CPU Interface: | Socket T (Socket 775) |
| CPU Support: | LGA775-based Pentium 4, Celeron D, Pentium D, Pentium EE, Core 2 Duo, Core 2 Extreme |
| Chipset: | Intel P965 + ICH8 |
| Bus Speeds: | 100 to 600 in 1MHz Increments |
| Memory Ratios: | Auto, 2, 2.5, 3, 2.66, 3.33, 4 |
| PCIe Speeds: | Auto, 90MHz~150MHz in 1MHz Increments |
| PCI: | Fixed at 33.33MHz |
| Core Voltage: | Normal, 1.0250V to 1.6000V in 0.00625V increments, 1.80V, 2.0V |
| CPU Clock Multiplier: | Auto, 6x-11x in 1X increments if CPU is unlocked, downwards unlocked, Core 2 Duo |
| DRAM Voltage: | Normal, +.1V ~ +.7V in +.1V increments |
| DRAM Timing Control: | Normal, 9 DRAM Timing Options, Memory Performance Enhance Mode |
| FSB Termination Voltage: | Normal, +.1V ~ +.3V in +.1V increments |
| MCH Voltage: | Normal, +.1V ~ +.3V in +.1V increments |
| Memory Slots: | Four 240-pin DDR2 DIMM Slots Dual-Channel Configuration Regular Unbuffered Memory to 8GB Total |
| Expansion Slots: | 1 - PCIe X16 3 - PCIe X1 3 - PCI Slot 2.3 |
| Onboard SATA/RAID: | 4 SATA 3Gbps Ports - Intel ICH8 2 SATA 3Gbps Ports - (RAID 0,1,JBOD) - JMicron JMB363 |
| Onboard IDE: | 1 ATA133/100/66 Port (2 drives) - JMicron JMB363 |
| Onboard USB 2.0/IEEE-1394: | 10 USB 2.0 Ports - 4 I/O Panel - 6 via Headers No firewire support |
| Onboard LAN: | Gigabit Ethernet Controller - PCI Express Interface Marvel 88E8056 |
| Onboard Audio: | Realtek ALC-883 8-channel High Definition Audio CODEC |
| Power Connectors: | ATX 24-pin, 4-pin EATX 12V |
| Fan Connectors: | 2 - CPU, Chassis |
| I/O Panel: | 1 x PS/2 Keyboard 1 x PS/2 Mouse 1 x Parallel Port 1 x S/PDIF Optical 1 x S/PDIF Coaxial 1 x Serial Port 1 x Audio Panel 1 x RJ45 4 x USB 2.0/1.1 |
| BIOS Revision: | Award F6 |
The Gigabyte GA-965P-S3 is slotted in between the Biostar P965PT and the Gigabyte GA-965P-DS3. Like the Biostar P965PT it uses the Intel ICH8 but also adds two additional SATA ports and RAID capabilities via the JMicron JMB363 chipset that also serves as the IDE controller. The S3 does not come with Firewire capability which is a mistake in our opinion.
The BIOS is feature rich like the DS3 and is geared towards the enthusiast with a significant amount of voltage/memory timing options available, provided you remember to press Ctrl-F1 while in the BIOS setup screen. Why Gigabyte continues to force the user to remember this keystroke sequence for additional BIOS options is beyond us.
Gigabyte also includes a full suite of utilities for the board: EasyTune5, M.I.T. (Motherboard Intelligent Tweaker), Download Center, Xpress Install, @BIOS, Smart LAN, Smart Fan, and Virtual Dual BIOS. We found the @BIOS utility to be very handy for downloading and then updating the BIOS while in Windows. For those who are squeamish about updating their BIOS within Windows, Gigabyte has the Q-Flash utility built into the BIOS that allows updating from a floppy drive.
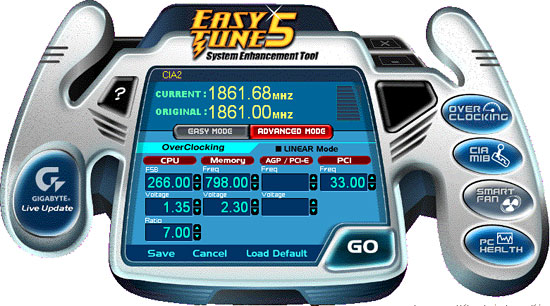
EasyTune5 is probably one of the most useful utilities in the Gigabyte arsenal and allows for control of the FSB settings and certain voltages within Windows, although a reboot is required to change most voltage settings. We found the utility worked well for squeezing out those last few FSB increases but we still found ourselves tweaking the BIOS the majority of the time. The PC Health monitor provided basic readings of the system but for some odd reason our CPU temperature liked to blip under 20C when capturing our screenshots. Our actual idle temps at stock settings were 25C on this board at time of testing. The Smart Fan utility allows control over the two fan headers located on the board.
Like our other boards in these roundups, Gigabyte includes a dynamic overclocking capability dependent on system load or preset attributes. This capability can be located within the BIOS under the C.I.A.2 setting. The settings range from Cruise (5% increase) to Full Thrust (17% increase). We decided to see how well this motherboard performed at Full Thrust. The blank screen after rebooting led us to believe we had selected the Zero Thrust option. After a quick CMOS clear event we backed down to the Turbo (15% increase) setting and were able to complete our benchmark testing. C.I.A.2 determined our Turbo settings would end at a final 7x308FSB providing a CPU speed of 2156MHz and our memory running at DDR2-924 with 5-5-5-15 settings. Just as predicted by C.I.A.2 an increase of just over 15% in the FSB speed was realized matching our settings on the DS3.
Gigabyte GA-965P-S3: Board Layout and Features
 |
| Click to enlarge |
Gigabyte has engineered a nice board with a very good layout that unfortunately keeps the same color combination (or lack thereof) from the DS3. The board installed into our case without problems and all connections were easily reached. The board features a three-phase voltage regulator system that provided excellent stability throughout our testing. Unlike the DS series that use 100% Conductive Polymer Aluminum Solid Capacitors our S3 board uses a combination of solid and electrolytic capacitors. The purpose of the Conductive Polymer Aluminum Solid capacitors is theoretically to improve system durability and to provide for added stability under heavy load operations such as overclocking. However, we did not notice any differences in our testing, but the long term benefits of the solid capacitors could be significant in terms of the board's lifespan.
The DIMM module slots' color coordination is once again correct for dual channel setup based upon the premise of installing DIMMs in the same colored slots for dual-channel operation. The memory modules are slightly difficult to install with a full size video card placed in the PCI Express x16 slot. The 24-pin ATX power connector and black floppy drive connector are located along the edge of the board and behind the DIMM slots. The board only comes with two fan headers with the CPU fan header being located to the right of the first DIMM slot. We usually prefer a minimum of four fan headers on a motherboard.
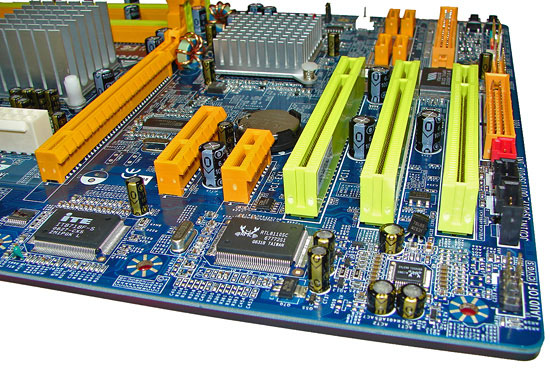
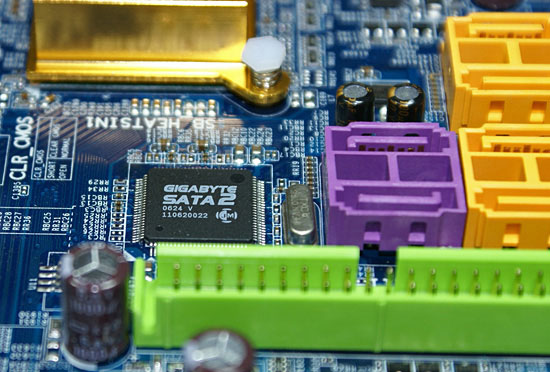
The four Intel ICH8 SATA ports are color coded yellow and the two JMicron JMB363 SATA ports are in a wonderful shade of lavender next to the green IDE connector. We found the positioning of the SATA ports to be excellent when utilizing the PCI 2.3 slots although we still prefer the IDE connector on the edge of the board to facilitate better cable management. The ICH8 is passively cooled with a gold colored low-rise heatsink and remained fairly cool to the touch throughout testing.
The chassis panel is located at the bottom left corner of the board. The clear CMOS jumper is located in between the battery and ICH8 chipset. This is a two pin configuration and requires the use of a pen to reach and is blocked if a card is installed in the first PCI slot. It seems to be a trend lately of the various manufacturers to place this jumper in the most inconvenient locations. Until the BIOS recovery programs work 100% of the time it would be nice to have this jumper out in the open, or even better go with the "button" design that we've seen used by a few manufacturers.
The board comes with one physical PCI Express x16 connector, three PCI Express x1 connectors, and three PCI 2.3 connectors. The layout of this design offers a very good balance of expansion slots for a mainstream performance board while providing excellent clearance space for graphics card utilization. The second PCI Express x1 slot will be blocked by a dual slot graphics card but considering the dearth of PCI Express peripherals this is fully acceptable. The first PCI Express x1 slot is a tight fit as a card installed in this slot will have minimal clearance between the MCH heatsink and video card.
 |
| Click to enlarge |
Returning to the CPU socket area, we find an ample amount of room for the majority of cooling solutions. We utilized the stock heatsink/fan in our base testing but also verified several of the larger Socket-775 cooling solutions would fit in this area during our overclocking tests. The 4-pin ATX power connector is placed on the far right side of the board and did not interfere with our various cooling units.
The Intel P965 MCH chipset is passively cooled with a mid-rise heatsink unit that did not interfere with any installed peripherals. Unfortunately, this heatsink is not very good at keeping the MCH cool during heavy overclocking. Gigabyte has used this design for the past year but has generally shipped a small fan that attaches to it for additional cooling. This heatsink needs it when running the system above 400FSB. However, even if it were included this board only has two fan headers which is not representative of a performance oriented board.
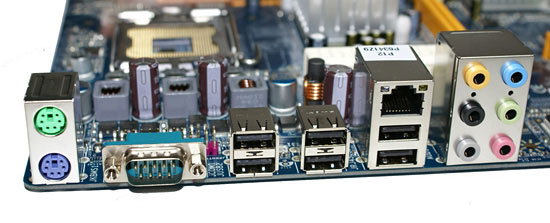
The rear panel contains the standard PS/2 mouse and keyboard ports along with serial and parallel ports for those who still require legacy peripherals. The panel also includes a LAN port, 4 USB ports, and two S/PDIF (optical out/coaxial out) ports. The LAN (RJ-45) port has two LED indicators representing Activity and Speed of the connection through the Marvell 88E8056 Gigabit PCI-E chipset. The audio panel consists of 6 ports that can be configured for 2, 4, 6, and 8-channel audio connections for the Realtek ALC 883 HD codec. The only item missing from our wish list would be a Firewire port if the board supported it.
FSB Overclocking Results
| Gigabyte GA-965P-S3 Overclocking Testbed |
|
| Processor: | Intel Core 2 Duo E6300 Dual Core, 1.86GHz, 2MB Unified Cache 1066FSB, 7x Multiplier |
| CPU Voltage: | 1.4250V (default 1.3250V) |
| Cooling: | Scythe Infinity Air Cooling |
| Power Supply: | OCZ GameXStream 700W |
| Memory: | Geil PC2-6400 800MHz Plus (2x1GB - GX22GB6400PDC) (Micron Memory Chips) |
| Alternative Memory: | Crucial PC2-5300 667MHz (2x1GB - TY2KIT12864AA663) (Micron Memory Chips) |
| Video Cards: | 1 x MSI X1950XTX |
| Hard Drive: | Seagate 320GB 7200RPM SATA2 16MB Buffer |
| Case: | Cooler Master CM Stacker 830 |
| Maximum CPU OC: (GEIL Memory) |
455x7 (4-4-4-12, 1:1, 2.2V), C2 Stepping 3185MHz (+71%) |
| Maximum CPU OC: (Crucial Memory) |
455x7 (4-4-4-12, 1:1, 2.2V), C2 Stepping 3185MHz (+71%) |
| . | |
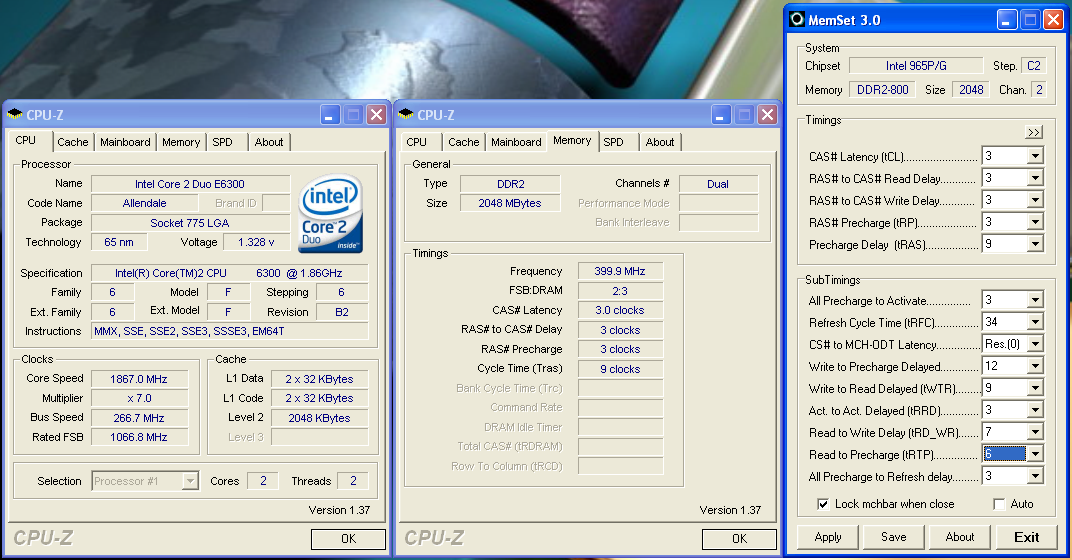
 |
 |
| Click to enlarge |
We were able to reach a final benchmark stable setting of 7x455FSB resulting in a clock speed of 3185MHz. This board is fully capable of near 500 FSB rates with correct memory support. This board has the same issue as the DS3 with most D9 Micron based 1GB modules not wanting to go above the 460FSB range in a stable manner. Our first screenshot shows the result of a beta BIOS that Gigabyte provided us which raised our FSB to 485 with our GEIL and Crucial memory.
Unlike previous testing with our DS3 we were able to drop our CPU voltage to 1.4250V compared to 1.4750V. The Vdroop on this board averaged around .01~.03V during testing. However, we had to increase our CPU voltage back to 1.4750V at our benchmark stable 7x485 FSB setting on this board. Our Gigabyte GA-965P-DS3 with the F8G beta BIOS was able to reach a maximum 505 FSB with the GEIL memory and 490 FSB with the Crucial memory although those settings were not completely benchmark stable. We expect to see the public release of these D9 friendly BIOS revisions in the near future.
Memory Stress Testing
Memory Tests
 |
| Click to enlarge |
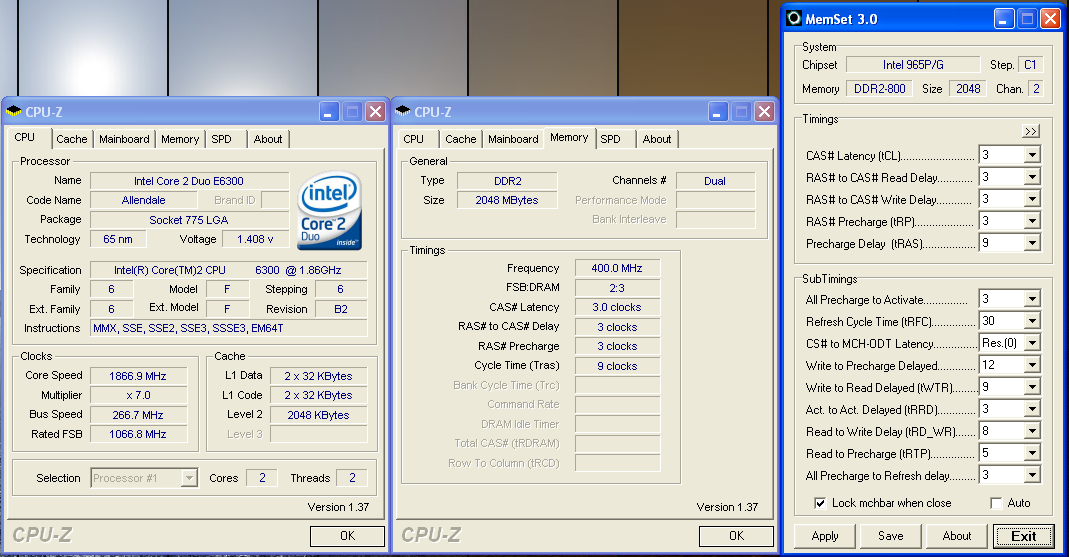
We will take a look at how well our GEIL PC2-6400 memory operates in our S3 board in both two and four DIMM testing. The screenshot above shows the actual memory settings used in our benchmark tests of the board. We do not modify the memory timings beyond the four major settings in our charts. The balance of the settings is implemented automatically via the BIOS. Gigabyte, like Biostar, is fairly aggressive with their internal memory and MCH timings.
| Gigabyte GA-965P-S3 Stable DDR2-800 Timings - 2 DIMMs (2/4 slots populated - 1 Dual-Channel Bank) |
|
| Clock Speed: | 800MHz |
| CAS Latency: | 3 |
| RAS to CAS Delay: | 3 |
| RAS Precharge: | 3 |
| RAS Cycle Time: | 9 |
| Voltage: | 2.20V |
We were able to set our timings to 3-3-3-9 by increasing the memory voltage to 2.20V with our GEIL memory. We were able to hold these timings up to DDR2-820 on this board and held timings of 3-4-3-9 up to DDR2-850 which is slightly lower than our DS3 settings. The board ran at 4-4-4-10 up to DDR2-860 before switching to the final overlclock settings of 4-4-4-12. We highly suggest the use of auto memory settings above DDR2-860 to ensure a stable system until you are able to fine tune the BIOS based upon your memory capability.
| Gigabyte GA-965P-S3 Stable DDR2-800 Timings - 4 DIMMs (4/4 slots populated - 2 Dual-Channel Bank) |
|
| Clock Speed: | 800MHz |
| CAS Latency: | 3 |
| RAS to CAS Delay: | 4 |
| RAS Precharge: | 4 |
| RAS Cycle Time: | 10 |
| Voltage: | 2.20V |
Our settings of 3-4-4-10 at 2.20V were normal for the group and matched our Biostar P965PT board with both boards running tighter overall memory latencies than the ASUS or Abit offerings. We were able to keep this setting up to DDR2-820 before switching over to 4-4-3-10 settings that held stable until we reached DDR2-840. We then kept a setting of 4-4-4-12 at 2.30V up to our final overclock setting of 7x440, 3080MHz DDR2-880, with four DIMMS installed. This board should overclock higher with four DIMMs once the Micron D9 issue is solved.
Test Systems: Benchmark Setup
Our Gigabyte and Biostar boards both support the current range of socket 775 Intel processors. We chose an E6300 for testing as we feel this will be a very popular Core 2 Duo CPU choice with the P965 motherboards, particularly these two "budget" priced models. We originally chose our GEIL PC2-6400 GX22GB6400PDC as it represented an excellent blend of price and performance although that is no longer the case due to the significant increase in pricing. Until DDR2 pricing drops down to reasonable levels again we would suggest the Crucial TY2KIT12864AA663 or something similar that will allow you to reach DDR2-1000 when overclocking the E6300. The other suggestion would be to move up to the E6400 or E6600 processor series so the memory overclocking requirements are not as strenuous or expensive.
| Standard Test Bed Performance Test Configuration |
|
| Processor: | Intel Core 2 Duo E6300 (1.86GHz, 2MB Unified Cache) |
| RAM: | GEIL PC2-6400 800MHz Plus (2x1GB - GX22GB6400PDC) 2.20V (Micron Memory Chips) |
| Hard Drive: | Seagate 320GB 7200RPM SATA2 16MB Buffer |
| System Platform Drivers: | Intel - 8.1.1.1001 |
| Video Cards: | 1 x MSI X1950XTX |
| Video Drivers: | ATI Catalyst 6.10 |
| CPU Cooling: | Scythe Infinity |
| Power Supply: | OCZ GameXstream 700W |
| Optical Drive: | Sony 18X AW-Q170A-B2 |
| Case: | Cooler Master CM Stacker 830 |
| Motherboards: | ASUS P5B-E (Intel P965 C2, 1.01G) - BIOS 0601 (2.10V RAM) ASUS P5B-E (Intel P965 C2, 1.02G) - BIOS 0601 Abit AB9-Pro (Intel P965 C1) - BIOS 1.5 BioStar T-Force 965 Deluxe (Intel P965 C1) - BIOS IP96a803 BioStar T-Force 965PT (Intel P965 C1) - BIOS P96CA914BS Gigabyte GA-965P-S3 (Intel P965 C2) - BIOS F6 Gigabyte GA-965P-DS3 (Intel P965 C2) - BIOS F7 ASUS P5NSLI (NVIDIA 570SLI) - BIOS 0601 ASUS P5W-Deluxe (Intel 975X) - BIOS 1407 |
| Operating System: | Windows XP Professional SP2 |
| . | |
A 2GB memory configuration is now standard in the AT testbed as most enthusiasts are currently purchasing this amount of memory. Our choice of DDR2-800 memory from GEIL offers a very wide range of memory settings during our stock and overclocked test runs. Our memory timings are set based upon determining the best memory bandwidth via MemTest 86 and our test application results for each board.
We are utilizing the MSI X1950XTX video card to ensure our 1280x1024 resolutions are not completely GPU bound for our motherboard test results. We did find in testing that applying a 4xAA/8xAF setting in most of today's latest games created a situation where the performance of the system starts becoming GPU limited. Our video tests are run at 1280x1024 resolution for this article at standard settings. We will not report on 1600x1200 4xAA/8xAF single and ATI CrossFire performance until part four of the roundup. However, we will state that since our games are GPU limited at that setting all initial results in our testing are within one percent of each other.
Synthetic Graphics Performance
The 3DMark series of benchmarks developed and provided by Futuremark are among the most widely used tools for benchmark reporting and comparisons. Although the benchmarks are very useful for providing apple to apple comparisons across a broad array of GPU and CPU configurations they are not a substitute for actual application and gaming benchmarks. In this sense we consider the 3DMark benchmarks to be purely synthetic in nature but still valuable for providing consistent measurements of performance.
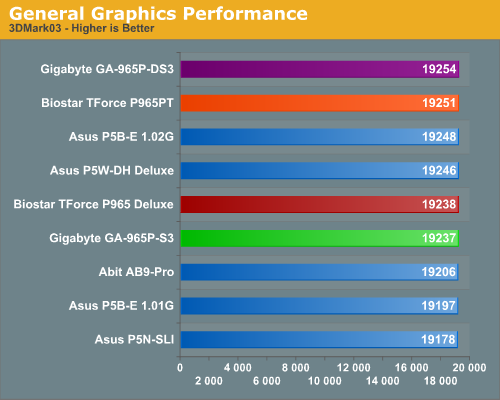
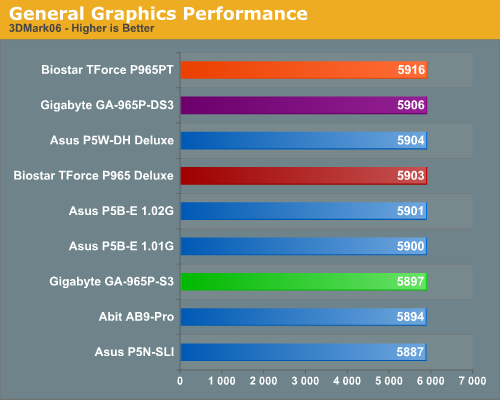
In our first tests, each P965 platform score is so close that there is no real winner or loser. In the more memory and CPU sensitive 3DMark03 benchmark we see the same trend with the P965 boards scoring extremely close and our Biostar 965PT placing second. The Biostar 965PT scores first in the 3DMark06 test and once again is doing better than the P965 Deluxe board. We attribute this to a combination of newer BIOS and the variability in MCH chipsets. We expected the S3 to perform on par with the DS3 but it stays right behind the DS3 in these tests. We will see this pattern repeat itself several times.
General System Performance
The PCMark05 benchmark developed and provided by Futuremark was designed for determining overall system performance for the typical home computing user. This tool provides both system and component level benchmarking results utilizing subsets of real world applications or programs. This benchmark is useful for providing comparative results across a broad array of Graphics subsystems, CPU, Hard Disk, and Memory configurations along with multithreading results. In this sense we consider the PCMark benchmark to be both synthetic and real world in nature while providing consistency in our benchmark results.
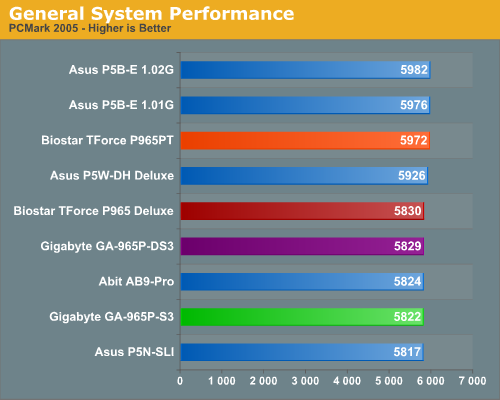
Considering our 3DMark results we really did not expect a difference in this benchmark but there is one. The Intel P965 based ASUS boards had scored significantly better than our other P965 boards in previous testing due to the final test which consists of multitasking three different applications. The ASUS P965 boards scored up to 58% better in the File Encryption and HDD Virus section of the test. The File Compression number was around 16% better on the ASUS P965 boards.
After testing the Gigabyte S3 board and noticing it scoring nearly the same as the DS3 board we expected the same with our Biostar twins. We were surprised when the Biostar 965PT had the same basic scores as the ASUS P965 boards. We played detective once again and flashed the Biostar P965PT board with the P965 Deluxe BIOS. The P965PT results were the same as the original P965 Deluxe scores indicating the newer BIOS design does indeed have the benefit of additional tuning.
General System Performance
We devised a script that would compress our standard test folder consisting of 444 files, ten subfolders, and 602MB worth of data, convert a 137MB High Definition QuickTime movie clip to a 37MB MPEG-4 format, play back the first two chapters of Office Space with PowerDVD, and run our AVG anti-virus program in the background. We stop the script when the file compression and video conversion are complete. This is a very taxing script for the CPU, Memory, and Storage subsystem. We also found it to be a good indicator of system stability during our overclocking testing.
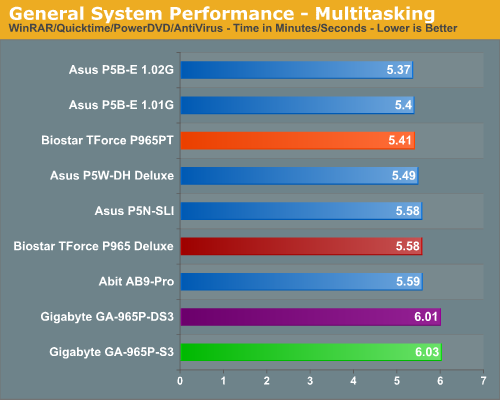
The performance difference basically mirrors our PCMark 2005 tests with the ASUS P965 boards scoring about 3% better overall in our multitasking test. We also see our Biostar 965PT board nipping on the heels of the ASUS boards and showing the results in PCMark 2005 were repeatable in this multitasking test. Both Gigabyte boards finish last which is surprising given their strength in our other benchmarks. As with our PCMark 2005 test both Gigabyte boards had issues with the virus scanning tests. We noticed in this test that our AVG anti-virus scan would stutter severely at various times during the tests.
PCMark 2005, together with two benchmarks that use rendering to test system performance - Cinebench 9.5 and POV-Ray 3.6 - has replaced Winstones for testing general performance. The Cinebench 9.5 and POV-RAY 3.6 benchmarks both heavily stress the CPU subsystem while performing graphics modeling and rendering. We utilize the standard benchmark demos in each program along with their default settings. Cinebench 9.5 features two different benchmarks with one test utilizing a single core and the second test using the power of multiple cores to render the benchmark image. We utilize the dual core test for our results.
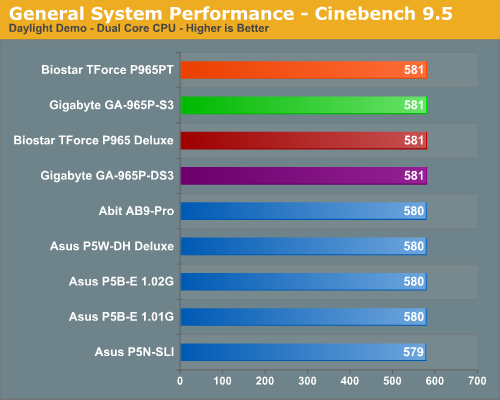
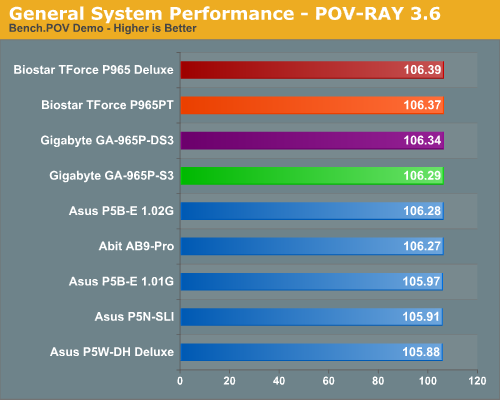
We see our collection of Biostar and Gigabyte boards taking top honors in these benchmarks although all of the scores are extremely close. We continue to see a pattern where the P965 boards at stock speeds are scoring slightly better than our 975X and NVIDIA 570SLI offerings.
Media Encoding Performance
Our first test is quite easy - we take our original Office Space DVD and use AnyDVD Ripper to copy the full DVD to the hard drive without compression, thus providing an almost exact duplicate of the DVD. We then fired up Nero Recode 2, selected our Office Space copy on the hard drive, and performed a shrink operation to allow the entire movie along with extras to fit on a single 4.5GB DVD disc. We left all options on their defaults except we checked off the advanced analysis option. The scores reported include the full encoding process and are represented in minutes and seconds, with lower numbers providing better performance.
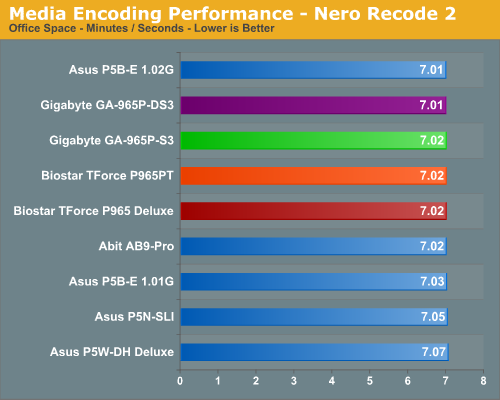
We continue to see a strong performance from the Biostar 965PT motherboard with the Gigabyte S3 trailing the DS3 once again although the differences in scores are minimal between the P965 boards. The 975X and NVIDIA 570SLI lag slightly behind in this test where the CPU and storage subsystems are stressed.
Audio Encoding Performance
While the media encoding prowess of the P965 boards were superb in our initial media encoding testing, we wanted to see how they faired on the audio side. Our audio test suite consists of Exact Audio Copy v095.b4 and LAME 3.98a3. We utilize the INXS Greatest Hits CD that contains 16 tracks totaling 606MB of one time '80s hits.
We set up EAC for variable bit rate encoding, burst mode for extraction, use external program for compression, and to start the external compressor upon extraction (EAC will read the next track while LAME is working on the previous track, thus removing a potential bottleneck with the optical drive). We also set the number of active threads to two to ensure both cores are active during testing. The results are presented in minutes/seconds for the encoding process, with lower numbers being better.
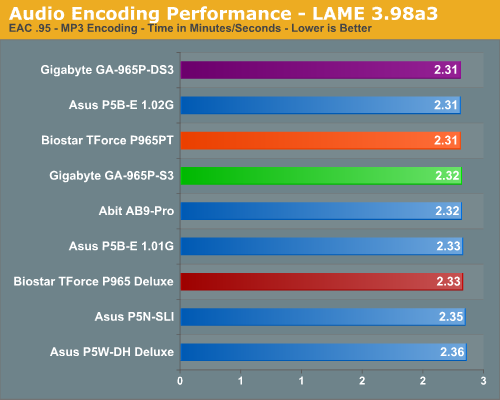
As in the media encoding section, the more intensive CPU and storage system tests seem to favor the P965 over the i975X/NV570SLI when running at the same memory timings. The Biostar 965PT scores slightly better than the Deluxe model in this test and ties our Gigabyte and ASUS boards for top scores. This test has proven to be very repeatable so we loaded the P965 Deluxe BIOS on the 965PT and the board consistently scored 2.33 so we again attribute the difference in scores to the newer BIOS.
File Compression Performance
In order to save space on our hard drives and ensure we had another CPU crunching utility, we will be reporting our file compression results with the latest version of WinRAR that fully supports multi-treaded operations and should be of particular interest for those users with dual core or multi-processor systems. Our series of file compression tests utilizes WinRAR 3.61 to compress our test folder that contains 444 files, ten subfolders, and 602MB worth of data. All default settings are utilized in WinRAR along with our hard drive being defragmented before each test.
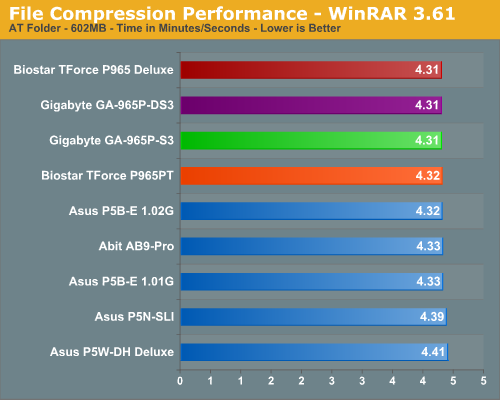
Once again the Gigabyte and Biostar boards share first place honors with the Abit and ASUS boards finishing right behind them. The margins continue to be extremely close between our P965 boards just reiterating the fact that boards based on the same chipset are going to offer the same performance. The 975X and 570SLI boards trail slightly but the differences are minimal.
Gaming Performance - FPS
As usual, gaming performance was tested with a variety of current games. We ran benchmarks with our standard 1280x1024 resolution. Given the number of users that run 19 inch LCDs these days, 1280x1024 represents one of the most commonly used resolutions. We will show 1600x1200 4xAA/8xAF and 1920x1200 4xAA/8XAF results in part four of our roundup when we test the motherboards that are capable of running CrossFire.
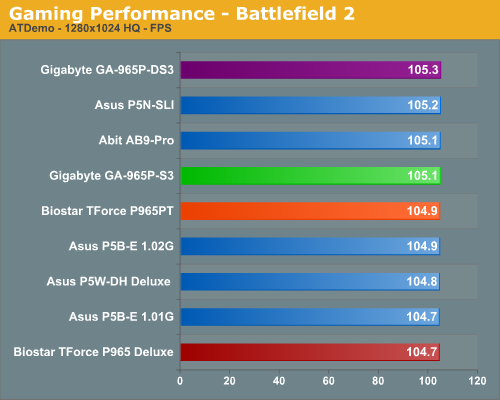
Battlefield 2
This benchmark is performed using DICE's built-in demo playback functionality with additional capture capabilities designed in house. During the benchmark, the camera switches between players and vehicles in order to capture the most action possible. There is a significant amount of smoke, explosions, and vehicle usage as this a very GPU intensive Battlefield 2 benchmark. We run Battlefield 2 using the highest quality graphics settings available in the video settings. The game itself is best experienced with average in-game frame rates of 35 and up.
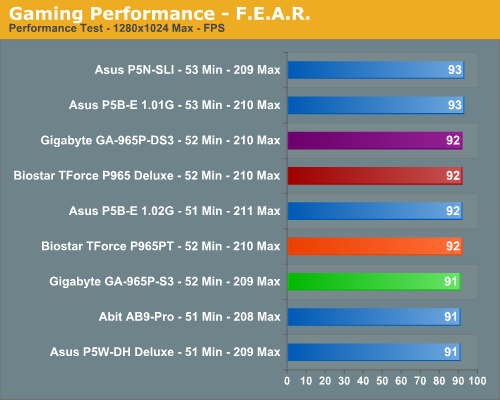
F.E.A.R.
F.E.A.R. uses a built-in performance test that generates graphical test scenes based upon the actual game engine. This test consists of a couple of different action sequences, a stressful water flyby, and heavy use of shadows while traveling through hallways. F.E.A.R. is a very graphics intensive game and we switch all settings to maximum. An average frame rate for F.E.A.R. that can dip into the teens is not good for a first person shooter, but the game is still playable to around 25 fps, although we prefer 35fps.
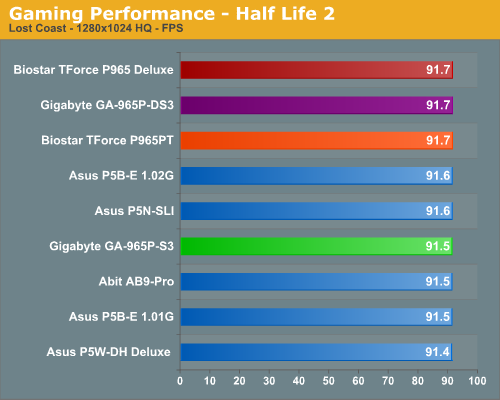
Half Life 2: Lost Coast
We use the built-in timedemo feature to benchmark the game. Our timedemo consists of starting at the bottom of the hill near the lake and ending in the old church. The Source engine timedemo feature is similar to the nettimedemo of Id's Doom 3 engine, in that it plays back more than just the graphics. The highest visual quality settings possible were used with HDR turned on. While the Source engine is notorious for giving great frame rates for almost any hardware setup, we find the game isn't as enjoyable if it isn't running at 35fps or above.
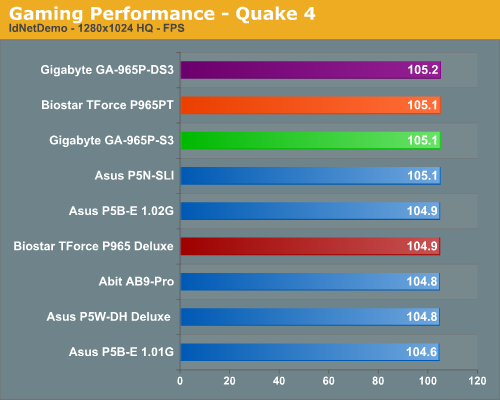
Quake 4
There has always been a lot of debate in the community surrounding pure timedemo benchmarking. We have opted to stick with the nettimedemo test rather than the timedemo option for motherboard benchmarking of Quake 4. To be clear, this means our test results focus mostly on the performance one would experience during actual game play. Additionally, Quake 4 limits frame rate to 60 fps during gameplay whether or not VSync is enabled. Our benchmark utilizes the IdNetDemo. This demo includes mainly outdoor areas with numerous players trying to wipe each other out. We tested the game with High Quality settings (uncompressed normal maps), and we enabled all the advanced graphics options except for VSync.
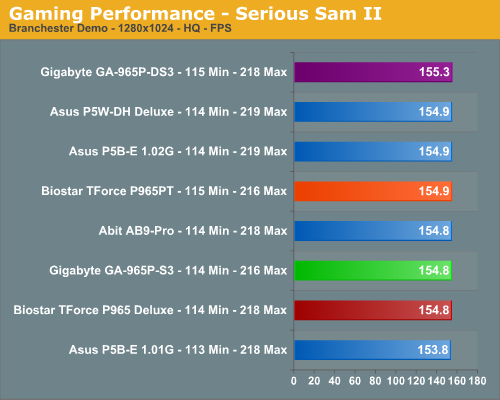
Serious Sam II
This benchmark is performed using Croteam's built-in demo capability in the Serious Sam II engine. We utilize the included Branchester Demo and capture the playback results using the Ctrl-~ function. The benchmark features a large number of combatants, explosions, and general mayhem. The benchmark is primarily GPU sensitive with the actual percentage of GPU/CPU/Audio activity being displayed during the benchmark run. We typically find this game is very playable at average in-game frame rates of 60 and above. We maximize all settings except antialiasing and anisotropic filtering within the general and advanced video settings.
FPS Gaming Summary
What else can you really say after reviewing the results? Once again if you utilize the same chipset you can expect the same basic results during benchmark testing. The differences between each board are minor and during actual game play we could not tell any differences amongst the P965 motherboards tested so far. The Gigabyte GA-965P-DS3 continues to offer the best overall performance by a small margin and except for the Battlefield 2 results the Biostar TForce 965PT offered almost equal performance for significantly less money.
The Gigabyte GA-965P-S3 consistently scored a little lower than the DS3. We did not expect this during testing since both boards are based on the same design along with each BIOS being built on common code. However, it appears the internal memory timings and the MCH timings are a little looser on the S3 resulting in the slightly reduced performance.
We did not experience any issues during testing or during game play with either board. We generally play every game for at least a couple of hours on each board to ensure there are no issues such as overheating, stuttering, or network issues when playing online.
Gaming Performance - RTS & Simulation
While our previous tests were based around First Person Shooters we are going to take a look at how our motherboards perform with Real Time Strategy and Simulation games.
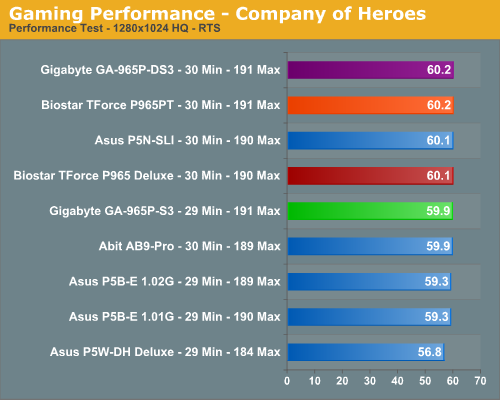
Company of Heroes
Company of Heroes is very GPU intensive and also requires a hefty CPU at times. The game contains a built-in performance test that utilizes the game engine to generate several different action scenes along with a coffee argument as a sideline distraction before the war starts. We found the performance test gives a good indication of how well your system will run the game, though some of the in-game action sequences are more demanding than the performance test. We generally found the game to be enjoyable with an average performance test frame rate above 35fps.
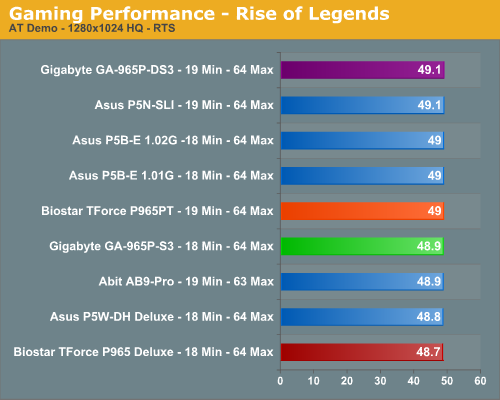
Rise of Legends
This game was released a few months back and like most real time strategy games is very CPU intensive but still offers a very visual experience. In order to experience the game properly you need a fast CPU, very good memory subsystem, and a decent GPU to play at the higher resolutions. We utilize FRAPS to capture the results from our replay file. Our benchmark consists of a one on one player game that takes approximately an hour to complete with some significant action throughout the game. Our camera movements are constant as we try to out play each other with a general tank rush between the two Vinci sides every few minutes. We set all video options to high but disable AA, although we found it makes very little difference in the performance of the game at the lower resolutions. We generally found the game to be enjoyable with an average frame rate above 35fps.
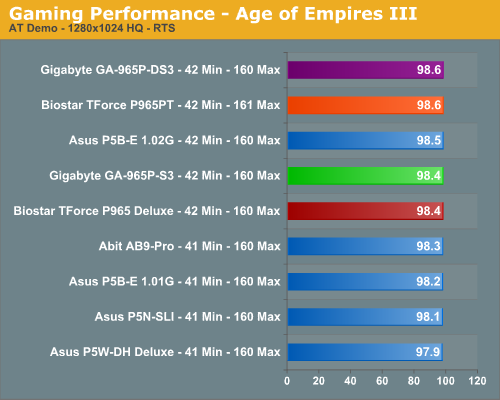
Age of Empires III
Age of Empires III was released last fall and was recently updated with The WarChiefs expansion pack. In testing with the WarChiefs expansion pack we did not notice any measurable differences in performance so our benchmark will be reflective of gameplay with this expansion pack. This particular game requires a decent CPU and a very capable GPU when utilizing the antialiasing options.
We once again utilize FRAPS to capture the results from our replay file. Our benchmark consists of a four player scenario that takes approximately an hour to complete. Our playback file follows the action of the best player on our staff as he generally is involved in attacks from an early point in the game until he decimates everyone at the end. The camera movements are constant as is the action so we feel like this benchmark represents the typical game. We set all video options to high but disable AA. We generally found the game to be enjoyable with an average frame rate above 40fps.
GT Legends
Our final game is a racing simulation introduced last year that generally delivers a very accurate portrayal of driving the top sports cars in the 1960s and 1970s on some of the world's finest race tracks. The game is an update to GTR with improved physics and graphics. GTR2 was recently released but we were unable to test it in time for this roundup. Our test consists of racing our Mustang around the Monza GP track for three laps and capturing the results with FRAPS. We set all in-game options to their highest settings but disable AA, even though we feel the game requires it for an enjoyable experience from the cockpit. The performance penalty on level three AA is minimal. We generally found the game to be enjoyable with an average frame rate above 45fps.
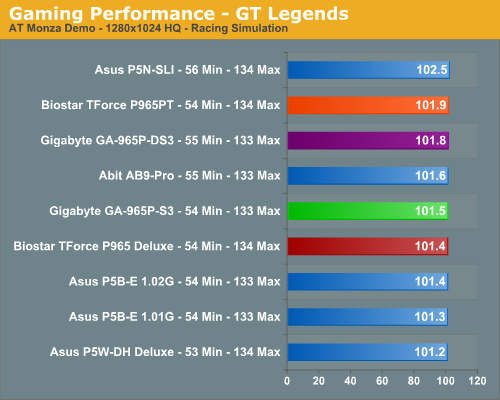
RTS/Sim Gaming Summary
Our results follow the FPS benchmark scores with all of the P965 boards scoring very close to each other. We still see the 975X trailing the other boards but our ASUS 570SLI is suddenly competitive with the P965 offerings. Once again, the Gigabyte GA-965P-DS3 motherboard is consistently at the top but we now find it joined by the Biostar 965PT board. We spent numerous hours testing each game in single player and online multiplayer modes with the audio system enabled. We did not notice any issues during our game play experiences at stock or overclocked settings.
Overclocking Performance
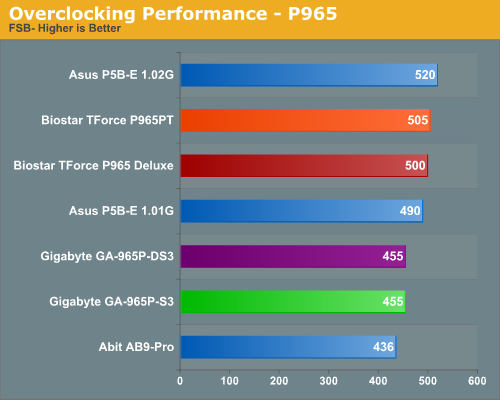
We have already reviewed the overclocking capabilities of each board in detail during our review of the boards' feature sets if additional information is required about the results. The ASUS P5B-E 1.02G is still the best overclocking board in our review to date but we were pleasantly surprised by the performance of the Biostar TForce 965PT. Actually, we were amazed as we had figured Biostar would have neutered the BIOS since the board is designed for the budget sector. We feel like the Biostar boards would have no issue matching the ASUS boards if they had memory voltage options up to 2.4V. The Gigabyte boards will be very competitive once the Micron D9 issues are resolved but until that time we hesitate to recommend them if you plan on overclocking an E6300 past 450 FSB.
 |
 |
| Click to enlarge |
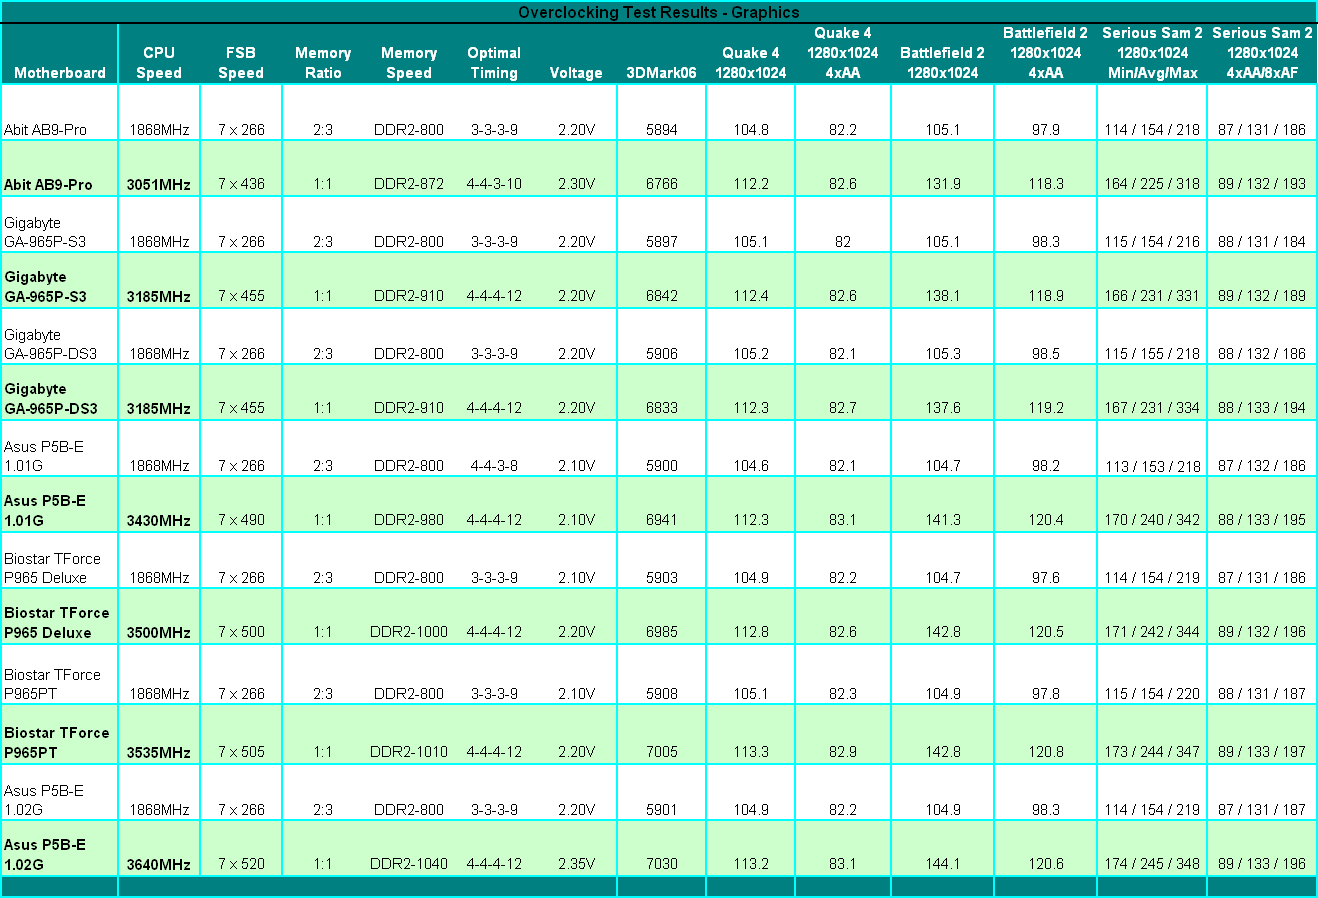
Our results have not really changed since the first roundup although we see the Biostar 965PT nipping at the heels of the ASUS P5B-E 1.02G due to its overclocking capability. In our application benchmarks that tend to be very CPU intensive we see the benefits of overclocking as our Nero Recode test shows an improvement of 16% on average with our WinRAR tests showing upwards of a 36% increase in performance. Our audio encoding test only showed an improvement of 11% but this is due to the fact that the CPU was waiting on the optical drive during the encoding process as it takes two minutes and three seconds to extract the audio files.
In our Sandra memory results we see the Gigabyte GA-965P-DS3 having the highest unbuffered results which directly translates to its class leading performance in most of our benchmarks. We also have to commend Biostar for very consistent performance from their boards with the second highest memory scores. ASUS is close behind but they generally run relaxed timings to a certain degree in order to improve overclocking at the high end.
In our gaming benchmarks we see differences of 7% in Quake 4, up to 38% in Battlefield 2, and 59% in the older Serious Sam II title when overclocking. This trend shows a definite improvement in the CPU/GPU balanced titles with little improvement in a title like Quake 4 that can become GPU limited at 1280x1024. We implemented 4xAA in Quake 4 and as expected the game shows no real differences in performance once it becomes GPU limited. This basically holds true for the balance of our games as overclocking will improve performance to a certain degree but the GPU is the biggest factor in most games today.
Disk Controller Performance
The AnandTech iPeak test is designed to measure "pure" hard disk controller performance, and in this case, we keep the hard drive as consistent as possible while varying the hard drive controller. The idea is to measure the performance of each hard drive controller with the same hard drive.
We played back our raw files that are recorded I/O operations when running a real world benchmark - the entire Winstone 2004 suite. Intel's iPeak utility was then used to play back the trace file of all I/O operations that took place during a single run of Business Winstone 2004 and MCC Winstone 2004. To try to isolate performance differences to the controllers that we are testing we use the Seagate 7200.10 Barracuda 320GB 7200 RPM drive in both SATA and IDE offerings for our tests. The drive is formatted before each test run and a composite average of three tests on each controller interface is tabulated in order to ensure consistency in the benchmark.
iPeak gives a mean service time in milliseconds; in other words, the average time that each drive took to fulfill each I/O operation. In order to make the data more understandable, we report the scores as an average number of I/O operations per second so that higher scores translate into better performance. This number is meaningless as far as hard disk performance is concerned, as it is just the number of I/O operations completed in a second. However, the scores are useful for comparing "pure" performance of the storage controllers in this case.
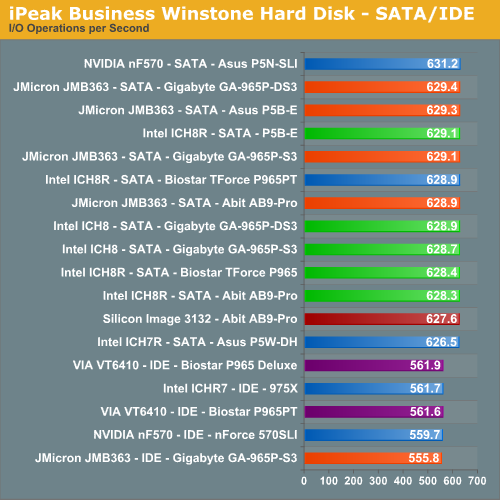
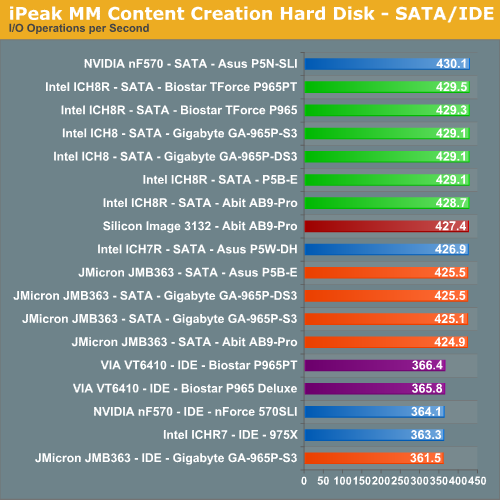
The performance patterns hold steady across both Multimedia Content I/O and Business I/O, with the NVIDIA nForce 500 based SATA controllers providing a slight improvement in I/O operations over the Intel, JMicron, and Silicon Image SATA controllers. This has been a historical trend between the manufacturers with the NVIDIA controllers generally having a fractionally higher throughput than the other chipsets. We look forward to seeing how well the ATI SB600 will perform with an Intel processor in the upcoming DFI ICFX-3200 based on the RD600 chipset.
Of note in our SATA tests is the excellent performance generated by the JMicron controller logic that scored higher than the Intel ICH7R or ICH8 based SATA controllers in the Business Winstone test. However, in the read and write heavy Content Creation tests we see the Intel SATA controllers placing ahead of the JMicron offerings. After reviewing the test script results we noticed the write operations of the JMicron JMB363 chipset was about 3% slower than the Intel ICH chipsets while being around 2% faster in read operations.
The VIA VT6410 controller offered the best performance in the IDE tests with the JMicron JMB363 finishing last. During initial testing with the JMicron chipset we noticed several boards having issues with the optical drives being stuck in PIO mode resulting in terrible performance. However, this issue was solved with recent BIOS updates from the motherboard suppliers. We also advise that unless you utilize the JMicron JMB363 for RAID operation then do not load the JMicron driver or allow Windows Update to install the newly released driver. Installing this driver will usually result in sporadic operation of the IDE port or failure to recognize certain optical drives.
Firewire and USB Performance
After looking at many options for Firewire and USB testing, we finally determined that an external USB 2.0, Firewire 400, and Firewire 800 hard disk would be a sensible way to look at USB and Firewire throughput. We utilize a RAM disk as our "server", since memory removes almost all overhead from the serving end. We turn off disk caching on the USB and Firewire side by setting up the drives for "quick disconnect" so our results are consistent.
We use 2GB of system memory with timings of 3-3-3-9 and set our RAM disk to 450MB with system memory at 1550MB. Our standard file is the SPECviewPerf install file, which measures 432,533,504 bytes (412.4961MB). After copying this file to our RAM disk, we measured the time for writing from the RAM disk to our external USB 2.0, Firewire 400, or Firewire 800 drive utilizing our internal Windows based timing program. The copy times in seconds were then converted into Megabits per second (Mb) to provide a convenient means of comparing throughput. Higher Rates therefore mean better performance in this particular test.
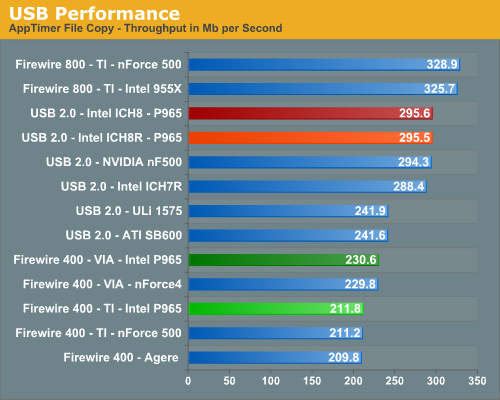
The most interesting aspect in testing Firewire and USB throughput tests is the outstanding performance of an external hard drive connected to Firewire 800. Our benchmarks show Firewire 800 is up to 42% faster than a drive connected to the more common Firewire 400, and about 11% faster than the fastest USB 2.0 solution.
We see our Intel ICH8 chipset finally overtake perennial champion NVIDIA in USB 2.0 performance. We see the USB performance on the ATI SB600 still trailing the other solutions but it has vastly improved compared to the SB450. The Firewire solution from VIA is still slightly faster than the TI solutions normally used on most motherboards.
Ethernet Performance
The current motherboard test suite includes LAN performance measurements. All of these boards utilize PCI or PCI Express based controllers with the only difference being the supplier of the core logic.
The Windows 2000 Driver Development Kit (DDK) includes a useful LAN testing utility called NTttcp. We used the NTttcp tool to test Ethernet throughput and the CPU utilization of the various Ethernet Controllers used on the Intel motherboards.
We set up one machine as the server; in this test, an Intel system with an Intel CSA Gigabit LAN connection. Intel CSA has a reputation for providing fast throughput and is a logical choice for our Gigabit LAN server.
On the server side, we used the following Command Line as suggested by the VIA whitepaper on LAN testing:
Ntttcpr -m 4,0,‹server IP› -a 4 -l 256000 -n 30000
On the client side (the motherboard under test), we used the following Command Line:Ntttcps -m 4,0,‹client IP› -a 4 -l 256000 -n 30000
At the conclusion of the test, we captured the throughput and CPU utilization figures from the client screen.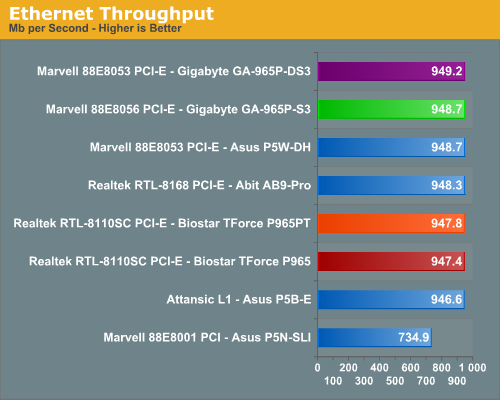
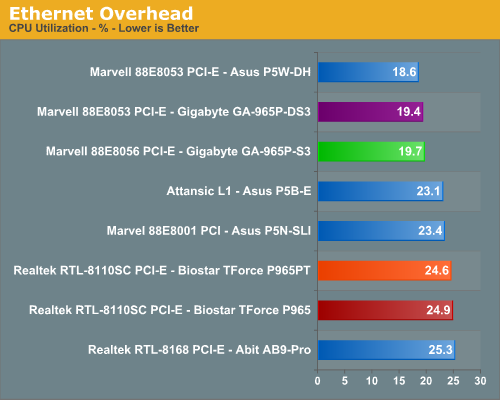
The CPU utilization performance favors the Marvell Gigabit controllers with the Realtek solutions having the highest utilization numbers. The throughput numbers also favor the Marvell Gigabit controllers with the Realtek options close behind. The Gigabyte S3 utilizes the Marvell 88E8056 solution instead of the 88E8053 on the DS3. ASUS is now using the Attansic L1 PCI Express based controller chip and it posted comparable numbers to the more widely used Realtek and Marvell solutions. ASUS utilizes a PCI based Gigabit controller on the 570SLI even though the NVIDIA chipset has native support for Gigabit operations. This decision results in the worse throughput and average CPU utilization numbers. However, even with throughput at 646Mb/s it still exceeds what most home networks are capable of and certainly any DSL or Cable based Internet connection.
Audio Performance
We are no longer showing the individual CPU utilization rates as the use of a dual core processor means the driver load is balanced between each processor with our audio solutions. The 2.3 version of Rightmark properly supports dual core processors but considering the results they are almost meaningless for most users at this time. We have found the CPU utilization rate improvements with the dual-core setup in this test do not have any bearing on actual game benchmarks as the reduction in frame rate percentages are the same on our single core systems. Hopefully we will begin to see more multithreading in games in the near future that will allow audio operations to run on a second core.
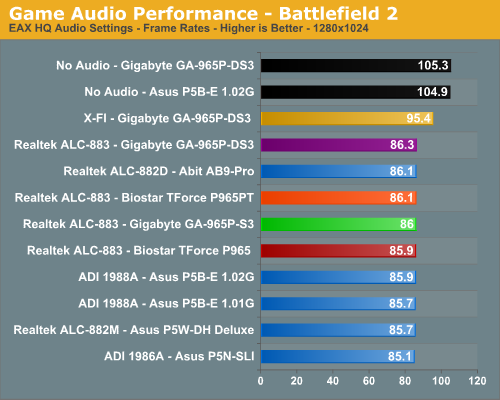
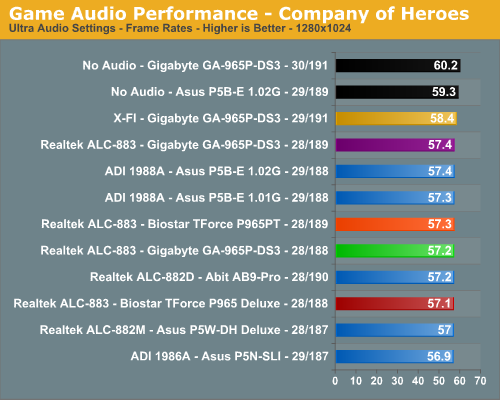
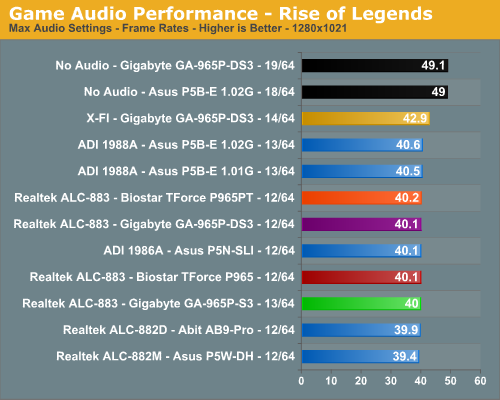
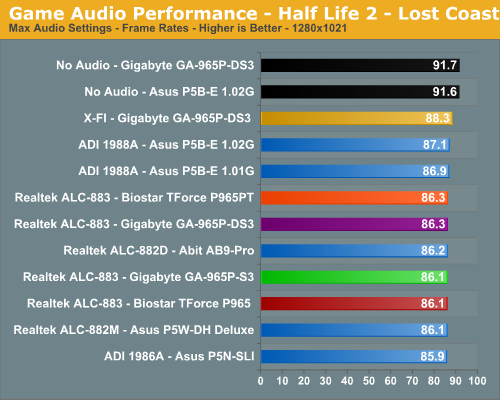
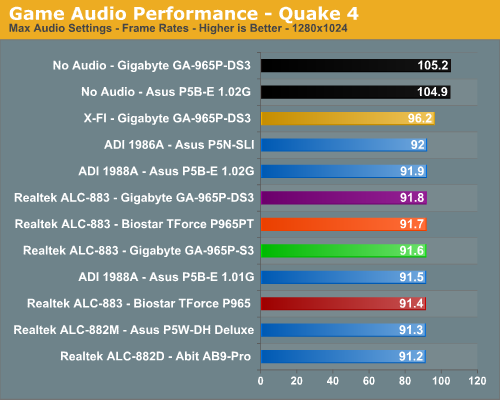
The audio performance numbers remain consistent between the Analog Devices and Realtek Codecs but both finish consistently behind the SoundBlaster X-Fi in the benchmarks. This is to be expected as the ADI and Realtek Codecs are host processing units dependent upon the CPU and drivers for generating their audio streams. The SoundBlaster X-Fi on the other hand has dedicated hardware that generates its audio streams and off loads this burden from the CPU. We are finding the CPU utilization rates to be constantly decreasing for the onboard solutions as CPU processing power increases and driver optimizations improve, but they still take a toll in certain games. This is reflected in our numbers as Battlefield 2 has an average loss of 22% (was 28%), Quake 4 at 14% (was 21%), Half Life 2: Lost Coast at 5%, Company of Heroes at 5%, and Rise of Legends at 22%.
Rise of Legends is a very CPU intensive game with numerous sound effects and as such the CPU hit for generating audio is significant, although we did not notice any stuttering during game play. Battlefield 2 utilizes EAX 2 for our ADI and Realtek HD Codecs which creates another significant demand on the CPU to process the audio streams, especially with the sound effects quality set to high. Quake 4 is the exception to the rule as it is generally GPU limited leaving additional CPU cycles for audio processing. In this case the ADI and Realtek solutions still create a significant hit on frame rates in a game where frame rates are everything.
Analog Devices has made news lately claiming other host-based audio solutions (Realtek is obviously in their crosshairs) do not properly generate EAX compatible audio in their drivers. During our testing we found this to be true to some degree. Since our previous Realtek testing always compared EAX 2 to the X-Fi series we basically assumed some of the muddy audio (complete lack of obstructions and occlusions) we encountered in Battlefield 2 as an example were issues with the codec and a poor driver optimization.
After comparing the ADI 1988A to the Realtek ALC-882D in Battlefield 2 we completely agree the issues we heard before are strictly driver related. In fact, the ADI 1988A generated EAX 2 sound effects that were very close or equal to our Audigy 2 and within hearing distance of our X-Fi at times. The audio quality differences in EAX capable games between the ADI and Realtek HD Audio Codecs were almost startling. We firmly believe this is due to obstructions and occlusions not being implemented correctly in the Realtek drivers. In EAX 2 capable games that feature outdoor areas or vast expanses we found sounds at one end of the map to have the same volume and distance correlation as sounds in front of the character. We compared earlier driver releases from Realtek and noticed this issue has become worse over the course of the last year. We suggest turning off EAX 2 in games when utilizing the Realtek solution; they just sound better the majority of time.
The audio differences in other games such as Company of Heroes were minimal although you could still tell the difference. This was especially true in the CoH benchmark where the two American soldiers are treading through the water to meet their group. You could hear the water gently move as they walked while with the Realtek solution the water sounded like a beached whale. This pattern held true for all of our games we tested throughout the benchmark process including thirty games that we tested off-line.
Obviously, if you are a serious gamer, then a dedicated sound card is still useful to ensure consistent frame rate averages across a wide variety of games, and in the case of the Sound Blaster X-Fi, you also get improved audio quality and EAX3/4/5 support. If you'd like more details on the Realtek or ADI solutions, you can refer to the Realtek HD Audio Codec Specifications or SoundMAX HD Audio Codec Specifications.
Final Words
Setup Intel P965 based motherboard; insert Core 2 Duo E6300, Test, Rinse, and Repeat. While there are some performance differences between our various P965 motherboards they all basically perform the same at stock settings. This is not necessarily bad as it shows a level of consistency between each manufacturer when utilizing the same Intel chipset. Depending on your requirements this can actually be a significant positive as you can expect the same level of base performance no matter what solution you choose to purchase. With the base level performance basically being equal you can decide if features, price, quality, overclocking performance, or support will be the determining factor in your buying decision. It is like buying cookies: they are all good, but which flavor and ingredients is the most attractive to you will determine what you buy.
While we have a certain disdain for the cookie cutter process from a design viewpoint, it does have benefits such as reduced cost, consistency of product, and manufacturability. The toppings may be different at times, but the base product remains the same. In our case today, that turned out to be a very fortunate series of events with the Biostar TForce 965PT amazing us with its overall performance and overclocking capability considering its price. The Gigabyte GA-965P-S3 impressed us greatly but that Micron D9 black cloud is still hovering over it if high FSB overclocking is in your future. While Gigabyte provided us a beta BIOS that shows they are well on their way to solving this issue we found other issues with the BIOS that are preventing an immediate release.
Not all is perfect with either board but a few minor issues can easily be overlooked considering the price/performance of both boards. We did notice a bad habit of the Biostar board not wanting to overclock consistently over a 300 FSB setting when using the 4:5 (DDR2-667) memory divider. We noticed the same issue to a certain degree when utilizing the 2:3 (DDR2-800) divider as the board seemed to hard lock when nearing or exceeding DDR2-1066 memory speeds. The absence of a downward CPU multiplier also means you will be limited in overclocking based upon your choice of CPU. We highly recommend an E6300 or E6400 on this board with decent DDR2-800 at a 1:1 memory divider when overclocking. The location of the 24-pin and 4-pin ATX power connectors are a detraction in a smaller case and the requirement to remove the video card to change the memory can be a hindrance if you swap out modules frequently. One last minor quibble that can be solved eaisly would be the addition of another fan header and Firewire support.
We're probably sounding like a broken record by now, but we wish Gigabyte would solve the Micron D9 issue before the next decade is upon us. We do not have this issue with any of the other manufacturers. Considering their recent partnership with ASUS we think it could be solved quickly with a phone call or maybe a visit. Even without the Micron D9 fix, a "budget P965" board that overclocks to the 450 FSB range is still impressive, but we know it has the capability to do more. Up until the release of the Biostar 965PT this capability would have earned it high praises in this near $100 category but the bar has been raised now. Other than this major issue the Gigabyte GA-965P-S3 has a very good feature set, layout is quite good, and their technical support has been terrific as of late. Our other issues are minor but we feel like an additional two fan headers, improved MCH heatsink design, and Firewire support would have made the board really stand out in this price range.
All in all, both of our fraternal twins deliver impressive performance for the price and are backed by solid technical support groups. We now move on to our true budget boards and we wonder if there will be another surprise waiting for us in that group.


