Original Link: https://www.anandtech.com/show/2236
Intel P35: Intel's Mainstream Chipset Grows Up
by Gary Key & Wesley Fink on May 21, 2007 3:45 PM EST- Posted in
- CPUs
Introduction
The introduction of the new P35 chipset today will likely be remembered as the time when Intel fully embraces the 1333 FSB. In the broad scope of events that would be a natural handle for the P35 introduction. However, Intel could have pushed P965 to officially support 1333 MHz for both FSB and memory speeds and called it a day with a suffix. Instead the decision was made to refine P965, improve a number of items in that existing chipset, and couple the new P35 Northbridge with a new spin on the Intel ICH Southbridge family to be known as ICH9/R.
Today is also the technology launch for the new Intel G33 Express chipset, a graphics chipset that replaces the 945G. Since the 945G replacement will mostly be of interest to OEMs like Dell and HP, we will not be evaluating the G33 chipset in this launch review. We will talk briefly about what is new, but reserve board testing to the new P35 Express chipset motherboards that will be of greatest interest to our readers.
With the incredible confusion surrounding today's introductions, perhaps it is worthwhile to talk about what was supposed to happen in the series 3 Chipset launch. The P35/G33 OEM launch was scheduled for May 9th, which was the time OEMs were to receive those new chipsets. The Performance launch is today, May 21st, when reviewers can first talk about performance of the new boards. The official product launch will not happen until Computex which begins on June 4th.
Still to come sometime in the 3rd quarter is the introduction of the X38 chipset, which replaces 975x, and the launch of G35, which will replace G965. The G35 will likely be of interest to mainstream readers, and we plan full coverage of that launch. There will also be a new value G31 chipset that replaces the current 946GZ and the 946GC. All of these new chipset launches are considered by Intel to be the transition to 3 series chipsets, which will pave the way for Intel's move to the 45nm CPU architecture.
| Intel 3 Series Chipset | |||
| Chipset | Launch | Replaces | Segment |
| X38 | Q3 '07 | 975X | Extreme |
| P35 | June 4th '07 | P965 | Extreme |
| Q35 | Q3 '07 | Q965 | Business |
| Q33 | Q3 '07 | Q963 | Business |
| G35 | Q3 '07 | G965 | Mainstream |
| G33 | June 4th '07 | 945G | Mainstream |
| G31 | Q3 '07 | 946GZ, 946GC | Value |
The current Q series may not be familiar to some readers. It and the upcoming Q35 and Q33 are chipsets targeted at the business market. AnandTech readers will likely be most interested in today's P35 chipset and the upcoming X38 chipset that will replace 975X. Set-top builders will also be interested in the G35 that will be introduced next quarter.
Features Comparison
While P35 and G33 are said to target the same segment, the likely target markets are quite different. Enthusiasts will generally opt for the P35 desktop chipset, or perhaps the upcoming G35 if their application requires integrated graphics. The G33 will more likely be found in machines by HP or Dell. Despite the differing end users a closer look at features shows Intel Series 3 features that are universal throughout the line.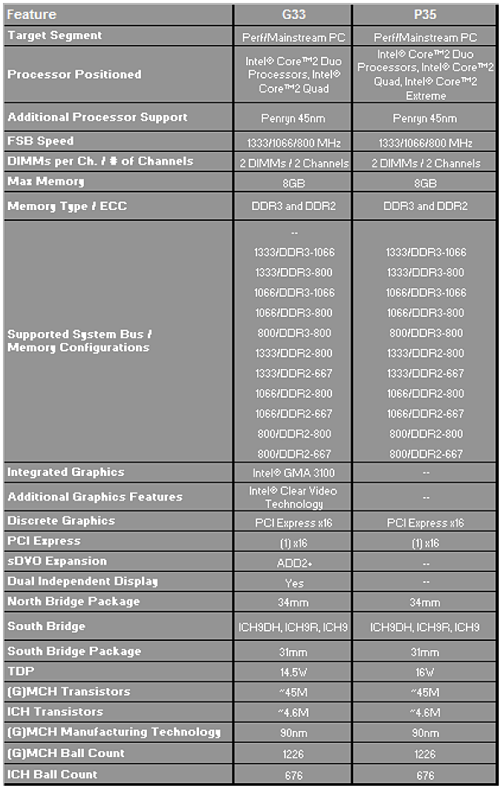
All new series 3 chipsets support DDR3 or DDR2. With DDR3 prices currently double or greater than DDR2 you will likely see DDR2 used in mainstream and OEM computers. For now DDR3 will most likely be limited to high end computers. As we saw in DDR3 vs. DDR2 the performance of DDR3 and DDR2 were virtually the same on the P35 at the same speed and timings, and DDR2 was faster on P35 than on the current P965. Therefore end users will likely want to migrate to the new 3 series chipsets for added performance, but it doesn't matter right now whether the memory is DDR3 or DDR2. In the future, when DDR3 prices drop and DDR3 timings get faster, DDR3 will be the better choice.
It is interesting that the DDR2-1333 speed is supported on the new 3 series chipsets, as this will likely spur development of even faster DDR2 for the new boards. Any of the new ICH9 MCH chips can be combined with G33 and P35, but you will more likely see the ICH9R used with P35 and the cheaper ICH9 in the G33 boards.
Like the P965/975X chipsets that preceded them, the new 3 series only supports a maximum of 8GB of memory. This is somewhat surprising when year-old AMD AM2 chipsets officially support 16GB. While not an immediate limitation, it may become one if the adoption of Vista is accelerated with a "must-have" DX10 game. For those who have asked, please note that Intel says all new Series 3 chipsets are 45nm Penryn ready. We would take this to mean that earlier P965/975X boards are not likely compatible with the upcoming Penryn, although just like we've seen a few specific boards using older chipsets with Core 2 we may see some exceptions.
Key Innovations
GAMING - X38
- Support for all Intel multi-core processors
- First DDR3 memory and PCI Express 2.0 chipset support in the industry
- Gain additional performance benefits with chipset overspeed protection removed
BUSINESS - Q35 and Q33
- Reduce IT costs, increase security and simplify manageability with Intel vPro processor technology platforms
- Lower TDP and idle power for greater energy efficiency, enhanced acoustics, and SFF
- Continue to support Energy Star2 specifications
- Enhance platform stability & improved asset deployment success with Intel SIPP
CONSUMER - G35
- Experience sharp HD DVD & Blu-ray content, high-definition video quality & usability with improved Intel Clear Video Technology
- Play the latest games with enhanced 3D compatibility with DX10
- I/O enhancements with new Intel Matrix Storage Technology features
- Support Intel ViiV processor technology
G33 Express Chipset - June 4th
Since G33 will typically be embraced by OEMs rather than by AT readers, we did not test the one motherboard available at G33 launch. However, some of you will be interested in the block diagram of G33 for details of what is included in the chipset.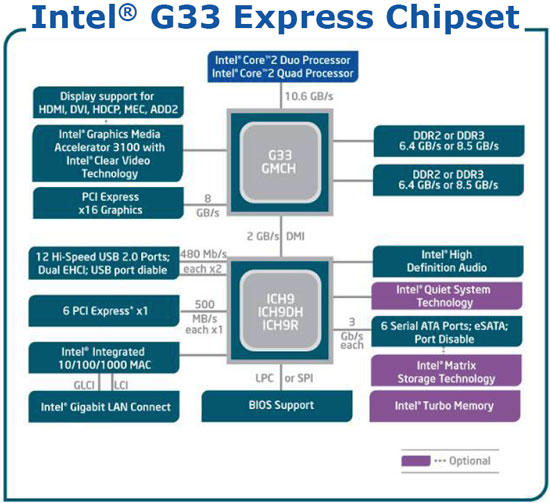
G33 will become the new OEM favorite, but the on-board Media Accelerator 3100 Graphics does not mean the chipset is stripped. The chipset can support either DDR2 or DDR3 memory, and an x16 PCIe slot is fully supported. Thanks to ICH9 G33 also supports twelve USB 2.0 ports, High Definition Audio, six serial ATA ports, an eSATA external SATA port, optional Gigabit LAN, and six PCIe x1 slots/lanes. Optional features include support for Intel Matrix Storage, Intel Turbo Memory (Robson), and Intel Quiet System technology.

G33 supports Intel Fast Memory Access coupled with the integrated Graphics, and Intel claims this will improve graphics and memory performance from 6% to 20% compared to the current 945G chipset. Keep in mind that 945G uses GMA 950 while G33 uses GMA X3100, so compared with G965 the differences may not be as great. Still, G33 is the entry-level IGP solution and it does represent an improvement over the previous entry-level 945G.
P35 Express - June 4th
For today, the chipset that will most interest our readers is the P35 Express, which replaces the P965.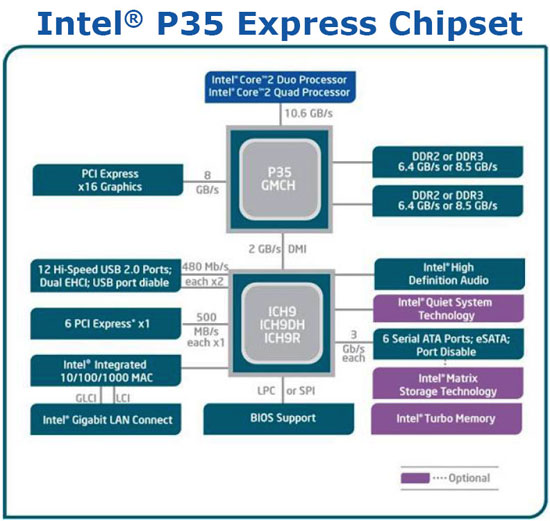
P35 will launch in both DDR3 and DDR2 versions, as you have already seen in DDR3 vs. DDR2 and Intel P35 Memory Performance: A Closer Look. No matter which memory version you chose the performance will be faster on P35 than on P965 or 975X. You will get the best memory performance from the new P35 chipset by running the processor bus at 1333 FSB. Intel has also improved their support for AMD/ATI CrossFire Graphics with the P35 chipset. Where the existing P965 struggled with a second x4 PCIe slot in CrossFire , P35 has official support for a pair of x8 PCI Express slots for the video cards and CrossFire if the manufacturer supports this setup. However, current P35 boards still utilize the x16/x4 design. With the new CrossFire internal connectors, running CrossFire on P35 is much simpler than CrossFire on P965.
| Intel P35/ICH9 Specifications | |||
| Chip | Mfg Process | Transistor Count | TDP |
| P35 | 90 nm | 45 Million | 16W |
| ICH9 | 130 nm | 4.6 Million | 4W |
The P35 chipset also features the new ICH9 series MCH, most likely the ICH9R on top P35 boards. Compared to P965 the ICH9 extends SATA to a total of six native SATA ports, expands USB 2.0 to twelve ports, and adds an eSATA port with port multiplier and port disable. Chipset power consumption for both the P35 and ICH9 are also very reasonable, with TDP for both chipsets rated at a total of 20 watts. Those who have complained about the hot-running NVIDIA chipsets will appreciate the lower power specification.
Intel also adds the Turbo Memory option, which can be a PCIe x1 card or NAND memory soldered on the motherboard. Desktop Turbo Memory is fully supported by Windows Vista but can only be activated in the P35 chipset by selecting AHCI support for the disk controllers. We will provide performance results of this feature in an upcoming storage article.
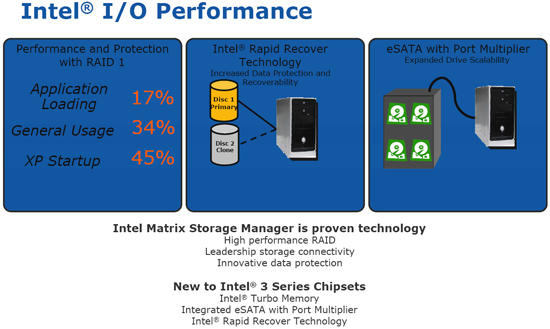
The Intel Matrix Storage is another area that has been improved on the ICH9 family. Intel claims that the new Matrix Storage Technology combined with optional Turbo Memory can enhance application loading, startup and speed up general usage by up to 34%. However, in preliminary testing we have only seen improvements of up 7% in certain scenarios.
You have already seen DDR3 and DDR2 memory test results with the ASUS P5K Deluxe (DDR2) and the ASUS P5K3 Deluxe (DDR3). We will take a closer look at the performance of these two P35 boards in this review. Performance results are also presented for the MSI P35 Platinum and Gigabyte P35-DQ6. With this broad cross-section of four P35 boards from Tier 1 manufacturers you should have the information you need to decide if P35 is your next motherboard.
P35 motherboard features and photos begin on p.6. P35 test results begin on p.10.
X38 and G35 Chipsets - 3rd Quarter
While the X38 replacement for the 975X chipset will not launch until the 3rd quarter, Intel did provide enough information to make us wish it were here today. In addition to the feature enhancements on today's P35 chipset, X38 will add several unique features.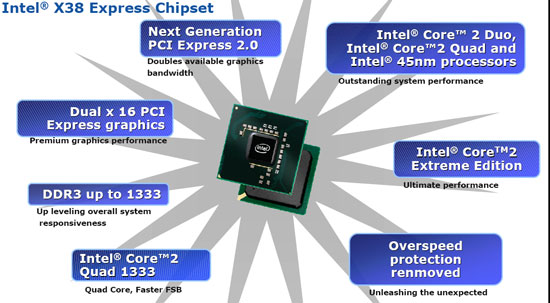
X38 will be the only Intel 3 series chipset to fully support dual x16 PCIe graphics. It was interesting that Intel did not specify CrossFire graphics in their literature, but we don't want to read too much into what wasn't said. The X38 will also be the first chipset to support PCI Express 2.0, which will replace the current PCIe standard. The other intriguing feature is something Intel calls "removing overspeed protection". This apparently refers to the fact X38 that will not have artificial bus speed limits on the chipset. We have seen what appeared to be artificial speed limits on Intel chipsets in the past, and an Intel chipset that can be pushed without artificial speed limits will be welcomed by all computer enthusiasts.
Other X38 features appear to be common to the P35 chipset, including full support for the 1333 processor bus and 1333 memory. X38 will also support all existing Intel processors and upcoming Penryn 45nm processors, just like other Intel Series 3 chipsets. X38 may also support other processor offerings, but Intel is not saying anything about that at this point.
G35
The third quarter will also see the introduction of Intel's G35 chipset, which will be Intel's most advanced integrated graphics chipset to date. While this may not be of huge interest to our readers, please keep in mind that the vast majority of computers sold today include integrated graphics. The G35 will be a very big deal for Intel and will be closely scrutinized by large-volume OEMs.
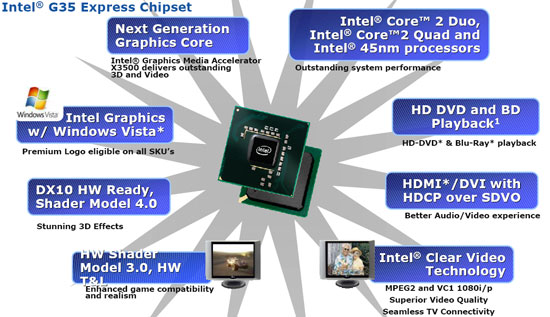
The G35 will be based on Intel's next-generation X3500 Graphics Media Accelerator. Full DX10 support is claimed, including support for Shader Model 4.0. For backwards compatibility X3500 also will support Shader Model 3.0 and Hardware Transform and Lighting (T&L). High Resolution DVD playback is also featured, with support for both HD-DVD and Blu-Ray playback. X3500 also is said to support HDMI and DVI. MPEG2 and VC1 1080i/p are also supported by the Intel Clear Video feature of X3500. Like the other series 3 chipsets, all current Intel processors are reported as well as future Penryn 45nm processors.
With DX10 support, all of the basic features are set in stone by Microsoft. That means that X3500 could actually be a true competitor on entry level configurations. Compared to previous Intel IGPs, X3500 certainly looks to bring some nice improvements to the platform, but we'll have to test actual performance and drivers before we can say for sure whether that's the case.
ASUS P5K & P5K3 Deluxe Features
| ASUS P5K Deluxe and P5K3 Deluxe | |
| Market Segment: | Enthusiast - $229.99~$249.99 |
| CPU Interface: | Socket T (Socket 775) |
| CPU Support: | LGA775-based Pentium 4, Celeron D, Pentium D, Pentium EE, Core 2 Duo, Core 2 Extreme |
| Chipset: | Intel P35 MCH and Intel ICH9R |
| Bus Speeds: | Auto, 200 ~ 800 in 1MHz increments |
| Memory Speed: DDR2 | Auto, 200 FSB - 667/800, 266 FSB - 667/800/889/1067 333 FSB - 667/800/833/1000/1067/1111/1333 |
| Memory Speed: DDR3 | Auto, 200 FSB - 800, 266 FSB - 800/889/1067 333 FSB - 800/833/1000/1067/1111/1333 |
| PCIe Speeds: | 100MHz~150MHz in 1MHz Increments |
| Core Voltage: | Auto, 1.1000V to 1.7000V in 0.0125V increments |
| CPU Voltage Damper: | Auto, Enable, Disabled |
| Core Voltage Reference: | Auto, .63x, .61x, .59x, .57x |
| CPU Clock Multiplier: | Auto, 6x-12x in 1X increments if CPU is unlocked, downwards unlocked, Core 2 Duo |
| DRAM Voltage: DDR2 | Auto, 1.80V ~ 2.55V in various increments |
| DRAM Voltage: DDR3 | Auto, 1.50V ~ 2.20V in various increments |
| DRAM Timing Control: | Auto, 9 DRAM Timing Options |
| Transaction Booster: | Auto, Enable 0/1, Disabled 0/3 |
| NB Voltage: | Auto, 1.25V, 1.40V, 1.55V, 1.70V |
| FSB Voltage: | Auto, 1.2V, 1.3V, 1.4V, 1.5V |
| Memory Slots: | Four 240-pin DDR2 DIMM Slots Dual-Channel Configuration Regular Unbuffered Memory to 8GB Total |
| Expansion Slots: | 2 - PCIe X16 (1x16, 1x4 electrical for CrossFire or Multi-GPU) 2 - PCIe x1 3 - PCI Slot 2.2 |
| Onboard SATA/RAID: | 6 SATA 3Gbps Ports - ICH9R (RAID 0,1, 10, 5) 2 e-SATA 3Gbps Port - JMicron JMB363 |
| Onboard IDE: | 1 ATA133/100/66 Port (2 drives) - JMicron JMB363 |
| Onboard USB 2.0/IEEE-1394: | 10 USB 2.0 Ports - 6 I/O Panel - 4 via Headers 2 Firewire 400 Ports by Agere FW322 - 1 I/O Panel, 1 via Header |
| Onboard LAN: | Marvell Gigabit Ethernet 88E8056 - PCI Express Gigabit Ethernet controller Realtek RTL8187 PCI Gigabit Ethernet controller |
| Onboard Audio: | ADI 1988B - 8-channel HD audio codec |
| Power Connectors: | ATX 24-pin, 8-pin EATX 12V |
| I/O Panel: | 1 x PS/2 Keyboard 1 x WiFi Port 2 x e-SATA 1 x S/PDIF Coaxial/Optical - Out 1 x IEEE 1394a 1 x Audio Panel 2 x RJ45 6 x USB 2.0/1.1 |
| BIOS Revision: | v.0304 |
| Board Revision: | v1.00 |
ASUS has loaded down this board with a wide array of options that includes their WiFi-AP Solo wireless network solution, dual Gigabit LAN, ADI AD1988B HD audio codec with improved circuitry, and the complete AI Lifestyle suite. The BIOS is fairly comprehensive and is enthusiast oriented. The two most important features we used during testing are the Transaction Booster option that on average improved unbuffered memory scores and latency by 4%~7% along with the CPU Voltage Damper setting that greatly reduced Vcore droop. We noticed under load testing with our QX6700 that average Vcore droop was around .04V and with CPU Voltage Damper enabled the average VCore droop hovered around .02V.
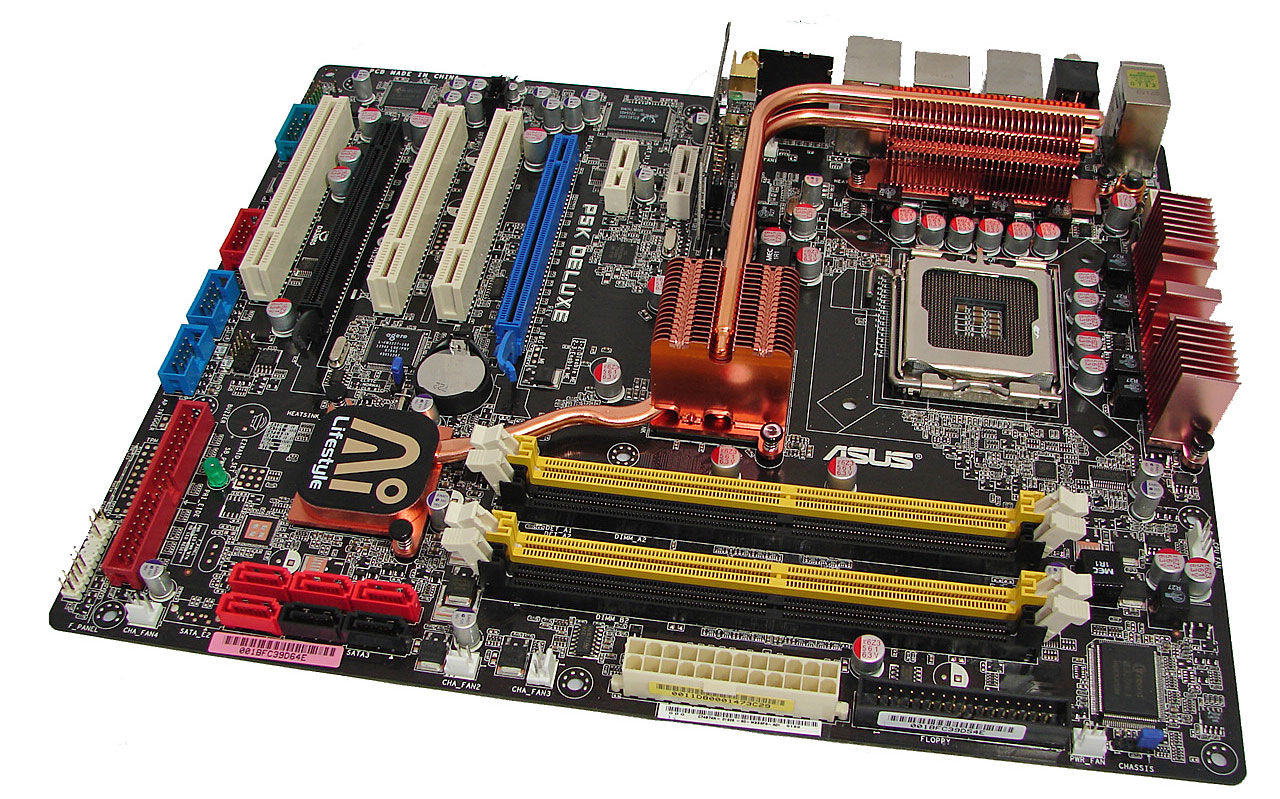
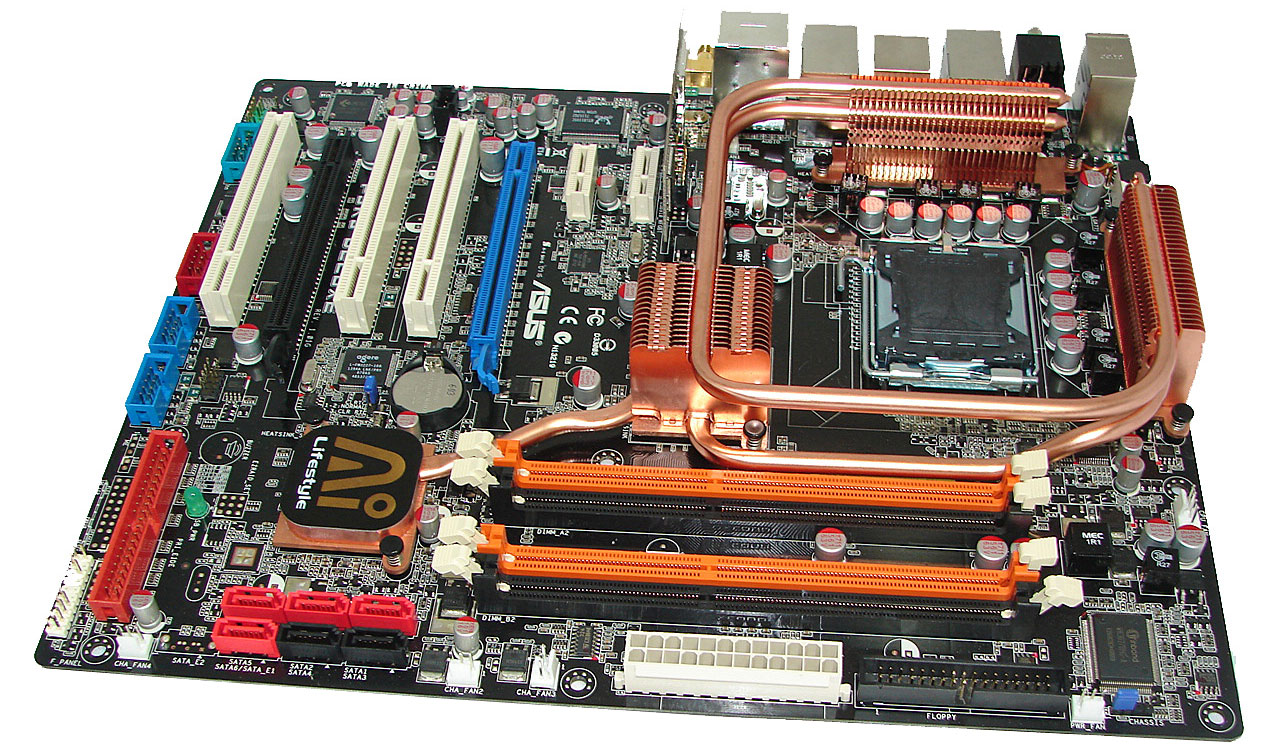
ASUS P5K Deluxe Layout and Features
 |
| Click to enlarge |
ASUS did a really nice job in the layout of this board as all features on the board except for the clear CMOS jumper are easily reached. This board features an eight-phase power regulation system and 100% use of conductive polymer aluminum capacitors that provided excellent stability during testing at stock and overclocked speeds. During our overclocking tests we found the passive heatpipe system worked well but additional airflow was required to ensure stability during overclock testing.
The board installed easily into our Cooler Master CM Stacker 830 case and cable management was very good for power, optical, and hard drives. Our only concern was that two out of six SATA connectors were partially blocked when installing an 8800 GTX. The ports could still be used with an angled SATA connector, but it seems only standard SATA cables are included in the packaging. Our larger heat sinks did fit on this board, but there was not much space left around the CPU area after installation. We will go in depth about the board and its features in our P35 roundup before Computex.
ASUS P5K3 Deluxe Layout and Features
 |
| Click to enlarge |
The P5K3 Deluxe is based on the same board design as the P5K but includes a wrap around heatpipe system that provided a slight benefit during overclock testing provided airflow was adequate. We saw an average temperature reduction of about 2C when measuring the MCH under load when compared to the P5K board. However, the drawback is that installation of a large heatsink is cumbersome with this design. Our current inventory of heat sinks worked but be prepared for some minor cuts when installing them. Of course, the real news about this board is support for DDR3 memory and some interesting test results as we will see shortly.
Gigabyte GA-P35-DQ6 Basic Features
| Gigabyte GA-P35-DQ6 | |
| Market Segment: | Enthusiast - $229.99~$249.99 |
| CPU Interface: | Socket T (Socket 775) |
| CPU Support: | LGA775-based Pentium 4, Celeron D, Pentium D, Pentium EE, Core 2 Duo, Core 2 Extreme |
| Chipset: | Intel P35 MCH and Intel ICH9R |
| Bus Speeds: | Auto, 200 ~ 750 in 1MHz increments |
| Memory Ratio: DDR2 | Auto, 2.00, 2.40, 2.50, 3.0, 3.20, 3.33, 4.0 |
| PCIe Speeds: | Auto, 90MHz~150MHz in 1MHz Increments |
| Core Voltage: | Normal, .00625V ~ 2.35000V in 0.00500V increments |
| PCIe Voltage: | Normal, +.05V ~+.35V in +.05V increments |
| FSB Voltage: | Normal, +.05V ~+.35V in +.05V increments |
| CPU Clock Multiplier: | Auto, 6x-16x in 1X increments if CPU is unlocked, downwards unlocked, Core 2 Duo |
| DRAM Voltage: DDR2 | Normal, +.05V ~ +1.55V in +.05V increments |
| DRAM Timing Control: | Auto, 12 DRAM Timing Options |
| Performance: | Standard, Turbo, Extreme |
| NB Voltage: | Normal, +.025V ~ +.375V |
| FSB Voltage: | Normal, +.05V ~ +.35V |
| Memory Slots: | Four 240-pin DDR2 DIMM Slots Dual-Channel Configuration Regular Unbuffered Memory to 8GB Total |
| Expansion Slots: | 2 - PCIe X16 (1x16, 1x4 electrical for CrossFire or Multi-GPU) 3 - PCIe x1 2 - PCI Slot 2.2 |
| Onboard SATA/RAID: | 6 SATA 3Gbps Ports - ICH9R (RAID 0,1, 10, 5) 2 SATA 3Gbps Port - JMicron JMB363 - RAID 0, 1 |
| Onboard IDE: | 1 ATA133/100/66 Port (2 drives) - JMicron JMB363 |
| Onboard USB 2.0/IEEE-1394: | 12 USB 2.0 Ports - 4 I/O Panel - 8 via Headers 3 Firewire 400 Ports by TI TSb43AB23 - 1 I/O Panel, 2 via Header |
| Onboard LAN: | Realtek RTL8111B PCIe Gigabit Ethernet controller |
| Onboard Audio: | Realtek ALC889A - 8-channel HD audio codec |
| Power Connectors: | ATX 24-pin, 8-pin EATX 12V, 4-pin Molex connector |
| I/O Panel: | 1 x PS/2 Keyboard 2 x PS/2 Mouse 1 x Parallel Port 1 x Serial Port 1 x S/PDIF Coaxial/Optical - Out 1 x IEEE 1394a 1 x Audio Panel 1 x RJ45 4 x USB 2.0/1.1 |
| BIOS Revision: | v.F4 |
| Board Revision: | v1.00 |
Gigabyte has provided a very comprehensive BIOS that is enthusiast oriented in the latest F4 release. In our opinion, Gigabyte continues to annoy the crowd that will buy this board by insisting on using the Ctrl-F1 sequence to open up the additional performance oriented BIOS settings. We were able to match most BIOS settings on the ASUS P5K when tuning the board. The most important option to change is the Performance Enhance setting from Normal to Turbo. This will improve memory performance in much the same way as the Transaction Booster from ASUS, although the level of fine tuning does not match the ASUS board. We found the Extreme setting to be just that, extremely on the edge as we could not complete our benchmarks when using it. We measured Vcore droop to be around .03V under load testing with our QX6700.
Gigabyte GA-P35-DQ6 Board Layout and Features
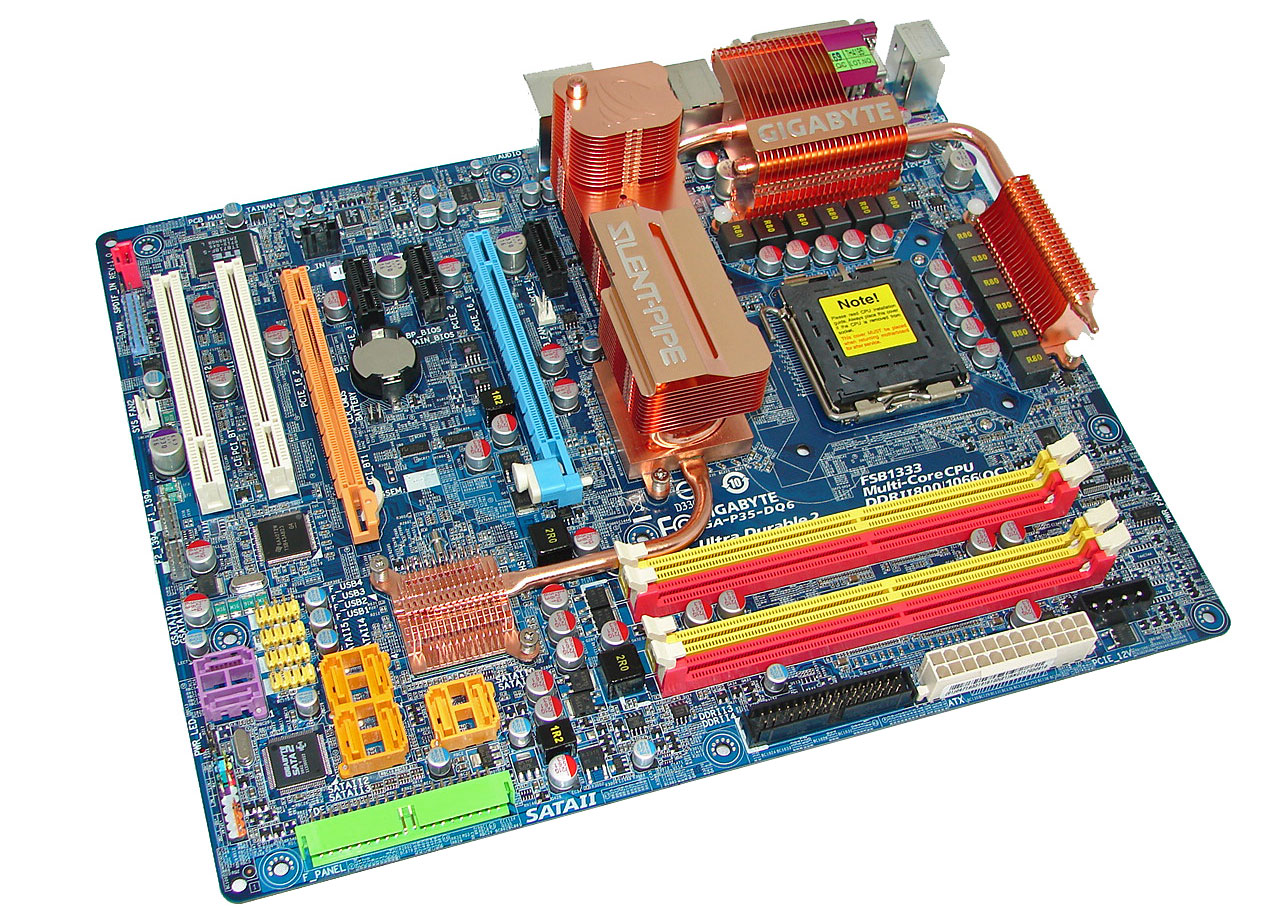 |
| Click to enlarge |
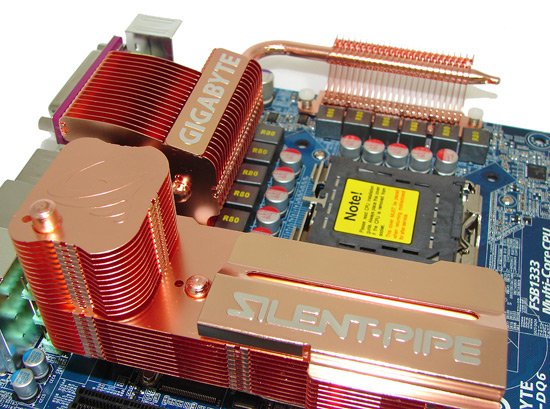
Gigabyte provides the user with a good layout considering the massive heatsink system employed on this board. This board features a twelve-phase power regulation system and 100% use of conductive polymer aluminum capacitors that provided excellent stability during testing at stock and overclocked speeds. During our overclocking tests we found the massive heatpipe system worked well but additional airflow was required to ensure stability during overclock testing. However, our larger heatsinks such as the Scythe Infinity barely fit and were difficult to install. The cooling backplate on the bottom of the board requires removal or the use of longer screws to attach coolers that require a backplate mount.
The P35-DQ6 installed easily into our Cooler Master CM Stacker 830 case and cable management was very good for power, optical, and hard drives although the 8-pin ATX connector was a tight fit due to the heatpipe system. Unlike the ASUS P5K series, Gigabyte took a more legacy approach with the rear panel options. The standard PS/2 mouse and keyboard ports, parallel, and serial ports are included compared to ASUS only including a PS/2 keyboard port.
MSI P35 Platinum Basic Features
| MSI P35 Platinum | |
| Market Segment: | Enthusiast - $199.99 |
| CPU Interface: | Socket T (Socket 775) |
| CPU Support: | LGA775-based Pentium 4, Celeron D, Pentium D, Pentium EE, Core 2 Duo, Core 2 Extreme |
| Chipset: | Intel P35 MCH and Intel ICH9R |
| Bus Speeds: | Auto, 200 ~ 600 in 1MHz increments |
| Memory Speed: DDR2 | Auto,1:1, 1:1.2, 1:2, 1:1.25, 1:1.66, 1:1.5 |
| PCIe Speeds: | Auto, 100MHz~200MHz in 1MHz Increments |
| Core Voltage: | Auto, 1.100V ~ 2.300V |
| SB Voltage: | 1.05V, 1.15V |
| SB I/O Voltage: | 1.50V ~1.80V in .05V increments |
| CPU Clock Multiplier: | Auto, 6x-50x in 1X increments if CPU is unlocked, downwards unlocked, Core 2 Duo |
| DRAM Voltage: DDR2 | Auto, 1.80V ~ 3.30V |
| DRAM Timing Control: | Auto, 9 DRAM Timing Options |
| NB Voltage: | Auto, 1.250V ~ 1.650V in .025V increments |
| FSB Voltage: | Auto, 1.175V ~ 1.500V in .025V increments |
| Memory Slots: | Four 240-pin DDR2 DIMM Slots Dual-Channel Configuration Regular Unbuffered Memory to 8GB Total |
| Expansion Slots: | 2 - PCIe X16 (1x16, 1x4 electrical for CrossFire or Multi-GPU) 2 - PCIe x1 2 - PCI Slot 2.2 |
| Onboard SATA/RAID: | 4 SATA 3Gbps Ports - ICH9R (RAID 0,1, 10, 5) 2 eSATA 3Gbps Port - ICH9R 1 SATA 3Gbps Port - Marvell 88SE6111 |
| Onboard IDE: | 1 ATA133/100/66 Port (2 drives) - Marvell 88SE6111 |
| Onboard USB 2.0/IEEE-1394: | 12 USB 2.0 Ports - 6 I/O Panel - 6 via Headers 2 Firewire 400 Ports by VIA VT6308 - 1 I/O Panel, 1 via Header |
| Onboard LAN: | Realtek RTL8111B PCIe Gigabit Ethernet controller |
| Onboard Audio: | Realtek ALC888 - 8-channel HD audio codec |
| Power Connectors: | ATX 24-pin, 8-pin EATX 12V, 4-pin Molex connector |
| I/O Panel: | 1 x PS/2 Keyboard 1 x PS/2 Mouse 2 x eSATA 1 x S/PDIF Optical - Out 1 x IEEE 1394a 1 x Audio Panel 1 x RJ45 6x USB 2.0/1.1 |
| BIOS Revision: | v.P01 |
| Board Revision: | v1.10 |
The MSI BIOS offers a decent set of options available for tweaking the board with specific emphasis placed on the available memory settings. Voltage options are rather limited but the range of voltage options available is impressive. Only our high end modules from OCZ, Corsair, and Patriot were able to operate at tight timings with absolute stability. However, until we received the latest BIOS release this weekend the board would not boot with 4GB of memory. MSI has made great strides over the past two weeks in getting this board to perform well with BIOS updates, and we fully expect the performance levels to match or come close to the other currently available P35 boards in the near future.
MSI P35 Platinum Board Layout and Features
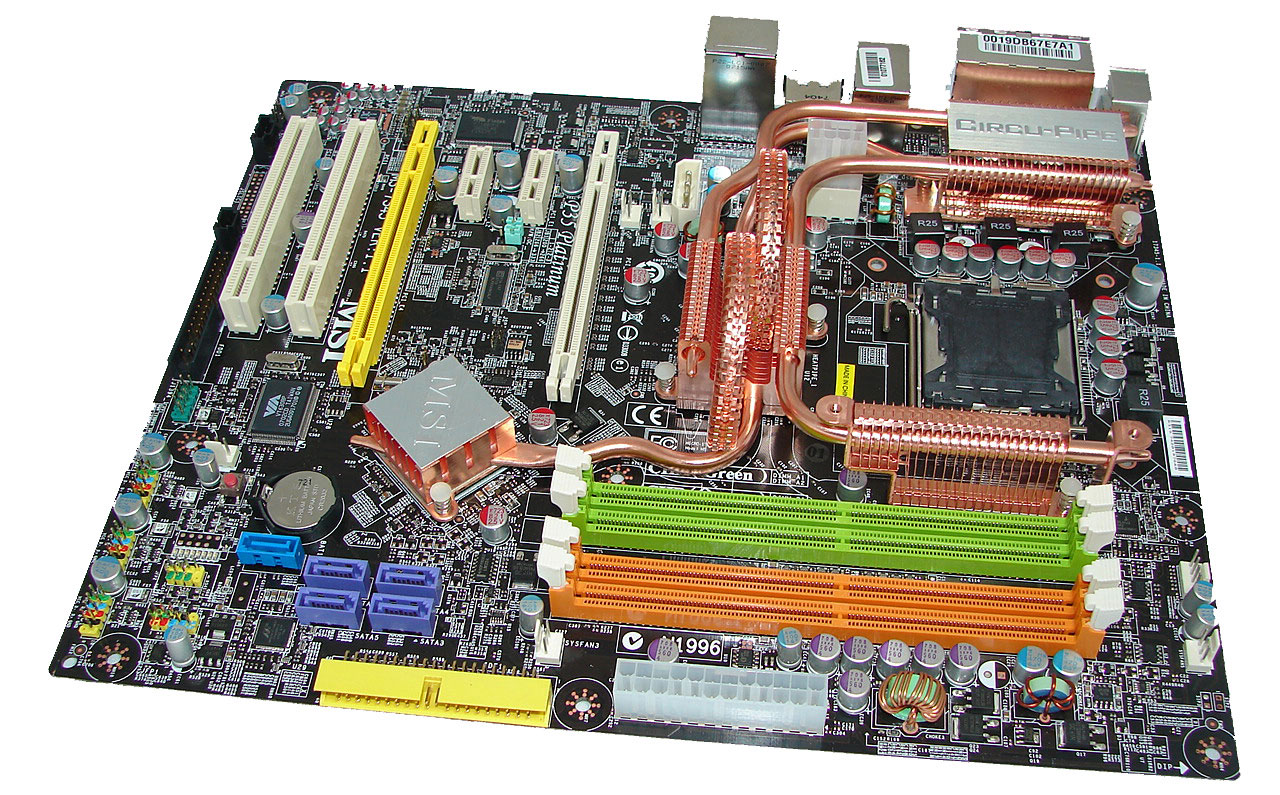 |
| Click to enlarge |
MSI did a really nice job in the layout of this board as all features on the board except for the floppy drive connector are easily reached. This board features a four-phase power regulation solution and conductive polymer aluminum capacitors that provided very good stability during testing. In a fight to outdo the other manufacturers in the heatpipe wars, MSI provided a roller coaster design that looks as interesting as it works. During our overclocking tests we found the heatpipe system results were on par with the other offerings provided additional airflow was available around the CPU area when using a cooler such as the Tuniq 120.
The board installed easily into our Cooler Master CM Stacker 830 case and cable management was very good for power, optical, and hard drives. Due to the tight clearances around the heatpipe, MSI includes an extender for the 8-pin ATX connector. We did not have any issues installing larger heat sinks on this board. The first DIMM slot is right against the rear heatpipe and the memory cannot be installed without removing the graphics card. MSI also includes a manual jumper system on the board that lets the user set a FSB speed of 200, 266, or 333 manually. The BIOS will automatically adjust settings to compensate for the change.
Test Setup
| Standard Test Bed - CrossFire Test Configuration | |
| Processor | Intel Core 2 Duo QX6700 (2.66GHz, 8MB Unified Cache) |
| RAM | OCZ Reaper PC2-9200 (4x1GB) DDR2 4-4-4-10 Corsair CM3X1024 (4x1GB) DDR3-1066 8-7-7-16 |
| Hard Drive | Western Digital 150GB 10,000RPM SATA 16MB Buffer |
| System Platform Drivers | Intel - 8.3.0.1013 |
| Video Cards | 1 x MSI HD2900XT |
| Video Drivers | ATI 8.37.4.3 (HD2900XT Release Drivers) |
| CPU Cooling | Tuniq 120 |
| Power Supply | OCZ ProXStream 1000W |
| Optical Drives | Plextor PX-760A, Plextor PX-B900A |
| Case | Cooler Master CM Stacker 830 |
| Motherboards | Intel D975XBX2KR (Intel 975X) - BIOS 2692 ASUS P5K Deluxe (Intel P35) - BIOS 0304 ASUS P5K3 Deluxe (Intel P35) - BIOS 0011 MSI P35 Platinum (Intel P35) - BIOS 7345P01 Gigabyte P35-DQ6 (Intel P35) - BIOS F4 DFI Infinity P965 (Intel P965) - BIOS 424 EVGA 680i LT SLI (NVIDIA 680i LT) - BIOS P04 |
| Operating System | Windows Vista 64-bit Ultimate |
| . | |
Test conditions were maintained the same, as much as possible, over the platforms tested. Our game tests were run at settings of 1280x1024 HQ to ensure our GPU was not a bottleneck during testing. We will provide CrossFire results in our upcoming P35 roundup but preview performance numbers are available in this article.
All results are reported in our charts and color-coded for easier identification of results. We utilize new drive images on each board in order to minimize any potential driver conflicts. Our 3DMark results are generated utilizing the standard benchmark resolution for each program. We run each benchmark five times, throw out the two low and high scores, and report the remaining score. All results are run at stock speeds for this article although we will provide overclocked results in the next article.
Our choice of software applications to test is based on programs that enjoy widespread use and produce repeatable and consistent results during testing. Microsoft Vista has thrown a monkey wrench into testing as the aggressive nature of the operating system to constantly optimize application loading and retrieval from memory or the storage system presents some interesting obstacles. This along with the lack of driver maturity will continue to present problems in the near future with benchmark selections. Our normal process was to change our power settings to performance, delete the contents of the prefetch folder, and then reboot after each benchmark run. This is a lengthy process to be sure, but it results in consistency over the course of benchmark testing. All applications were run with administer privileges.
The test results we will present today are preliminary. What do we mean by this? Although the boards we are reviewing are full retail kits, their BIOS tuning continues at a rapid pace before the "official" launch on June 4th. Over the course of the last week we have tested numerous BIOS releases from each manufacturer and we've seen positive steps along the way. We honestly thought this preview would be a cake walk for ASUS until Gigabyte/MSI provided their latest BIOS releases that improved the performance of the boards up to 9% in certain areas.
We are also using early DDR3-1066 samples with memory settings at 8-7-7-16 for 1066 scores and 9-9-9-24 for DDR3-1333 results. We just received lower latency DDR3-1333 modules and will update our results in the roundup. On a side note, ASUS provided us a new BIOS for their P5K3 board that enables 1T command rates at DDR3-1066. Early testing has shown performance improvements up to 4% in memory sensitive applications. ASUS is continuing to work on the command rate timings and hopes to have 1T settings ready when low latency DDR3-1333 hits the market shortly. Expect to see an exclusive on this memory and BIOS in the next few days.
Our Intel Intel D975XBX2KR will be at a slight disadvantage, but with memory speeds set to DDR2-800 we were able to run timings at 3-4-3-8 without issue. We did not include extensive overclocking results for the CPU or memory side as time did not permit us to run each processor series on each board for the full test suite. We received seven boards late last week and will have results on several of those along with full overclocking results before Computex starts. We will also compare P35 1333/1066 DDR2 against P965 1333/1066 at the same time. Our DFI Infinity P965 is the fastest P965 board in our labs and as such is a good match for comparison.
Memory Performance
 |
| Click to enlarge |
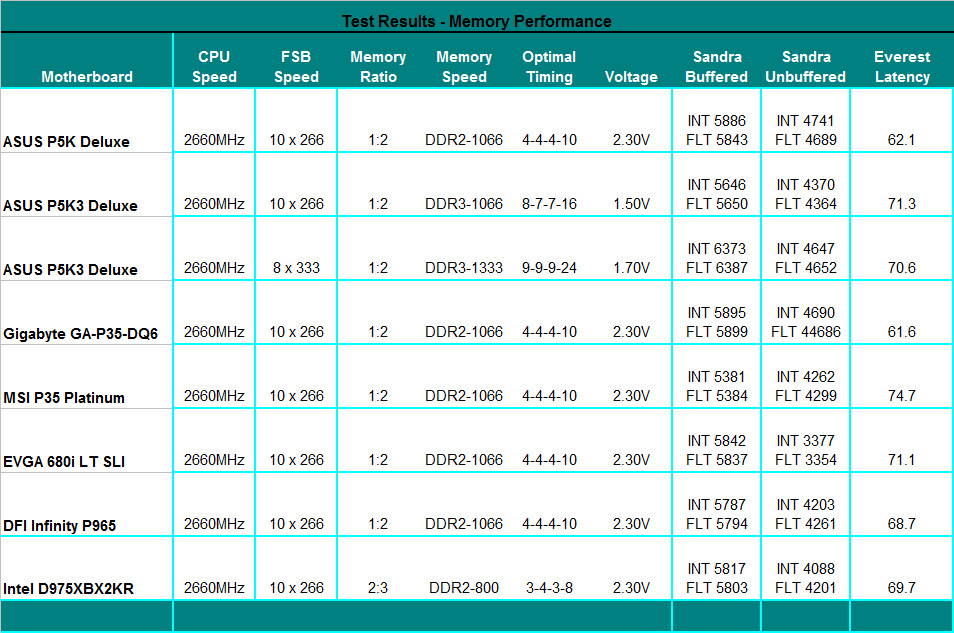
We switched to a 4GB memory configuration for this article and future motherboard tests. The P35 chipset proves to have the fastest memory performance and best latencies at stock speeds provided the BIOS is tuned properly. We still find the 975X to offer some of the fastest memory performance when overclocked provided you can change strap settings and have very good RAM.
We noticed an 11% difference in unbuffered memory speeds and a 7% difference in latencies on the ASUS P5K Deluxe board when comparing auto to manually adjusted BIOS settings using the same standard 4-4-4-10 memory timings. Our other boards are tuned to the best possible performance that still allows the board to complete our benchmark test suite. We did not compare DDR2-1333 to DDR3-1333 for the simple fact that we currently do not have any DDR2 memory capable of 1333 speeds in a stable manner. However, we do expect DDR2-1333 RAM later this summer.
Synthetic Graphics Performance
The 3DMark series of benchmarks developed and provided by Futuremark are among the most widely used tools for benchmark reporting and comparisons. Although the benchmarks are very useful for providing apples-to-apples comparisons across a broad array of GPU and CPU configurations they are not a substitute for actual application and gaming benchmarks. In this sense we consider the 3DMark benchmarks to be purely synthetic in nature but still very valuable for providing consistent measurements of performance.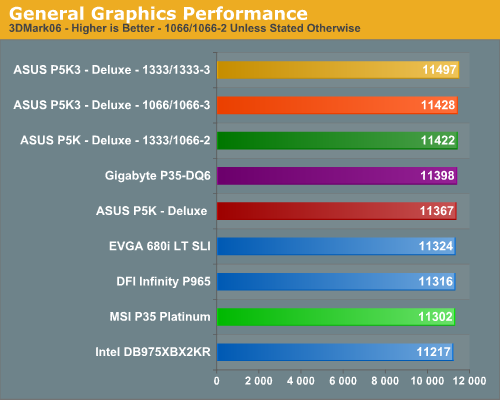
In our 3DMark06 test, all of the boards are grouped together with a 2.5% spread from top to bottom. The 975X board takes last place by a small margin, and we noticed in this benchmark that the R600 and 975X do not play well together as the 975X scores within 64 points of the P5K when using a NVIDIA 8800GTX. The latest beta R600 drivers have cured this problem and we will update our scores with the new 8.38 driver set for the roundup. The additional bandwidth available when using the P5K board at 1333/1066 settings resulted in the best CPU and SM2.0 scores in this benchmark.
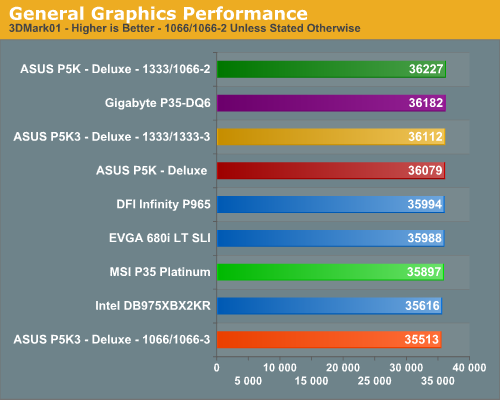
In the more memory and CPU sensitive 3DMark01 benchmark we see our ASUS P5K Deluxe board taking top honors but only with the FSB set to 1333 (8x333). The Gigabyte P35-DQ6 has the best stock scores at 1066/1066. Our 975x board is slightly handicapped at the 1066/800 settings although this chipset continues to offer excellent memory performance. The higher latencies on the P5K3 board hurt its stock performance although increasing bandwidth to 1333/1333 makes up for it. The spread from top to bottom is again only 2%, however, so minor differences in performance are not really noticeable in either 3DMark.
General System Performance
The PCMark05 benchmark developed and provided by Futuremark was designed for determining overall system performance for the typical home computing user. This tool provides both system and component level benchmarking results utilizing subsets of real world applications or programs. This benchmark is useful for providing comparative results across a broad array of Graphics, CPU, Hard Disk, and Memory configurations along with multithreading results. In this sense we consider the PCMark benchmark to be both synthetic and real world in nature, and it again provides for consistency in our benchmark results.
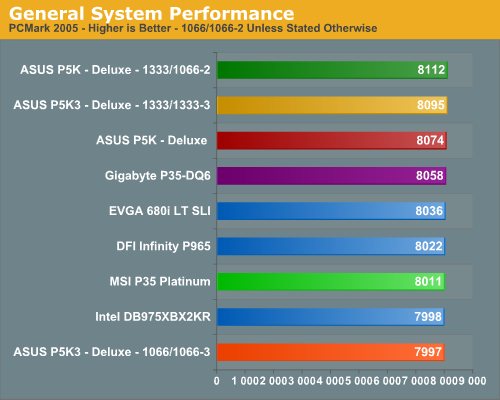
The ASUS boards have historically done well in this benchmark due to very strong multitasking performance and the same holds true once again. The stock P5K3 scores continue to show an issue with high latencies as this board scored at the bottom in the general application test. The increase to the 1333FSB provides slightly better results with the main increases coming in the multitasking tests. The spread in overall scores is only 1.5%, although in individual areas the differences between the boards may be more or less pronounced.
Rendering Performance
We are using the Cinebench 9.5 benchmark as it tends to heavily stress the CPU subsystem while performing graphics modeling and rendering. Cinebench 9.5 features two different benchmarks with one test utilizing a single core and the second test showcasing the power of multiple cores in rendering the benchmark image. We utilize the standard multiple core benchmark demo and default settings.
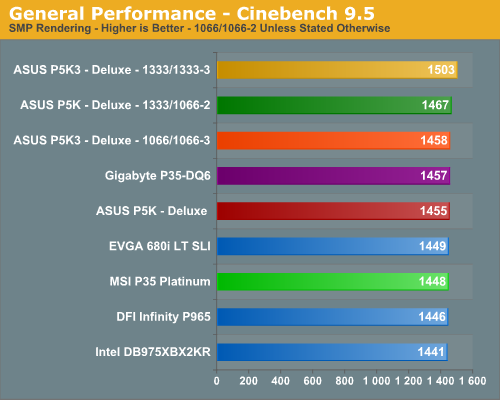
The improved bandwidth and front side bus speeds of the P5K3 board results in the top score, putting it 2.5% ahead of the closest competitor for the time being. The remaining boards are all clustered within 2% of each other, with most of the P35 boards placing ahead of the incumbents.
Media Encoding Performance
We are utilizing an updated video encoding test suite for this article that includes AnyDVD, Nero Recode 2, Windows Media Encoder 9, and QuickTime Pro 7.1.Our first series of tests is quite easy - we take our original Office Space DVD and use AnyDVD and Nero Recode 2 to copy the full DVD to the hard drive without compression, thus providing an almost exact duplicate of the DVD. We then fired up Nero Recode 2, selected our Office Space copy on the hard drive, and performed a shrink operation to allow the entire movie along with extras to fit on a single 4.5GB DVD disc. We then go back and use Nero Recode to shrink the full DVD copy and burn it onto our DVD disc. We left all options on their defaults except we checked off the advanced analysis option. The scores reported include the full encoding process and is represented in minutes/seconds, with lower numbers providing better performance.
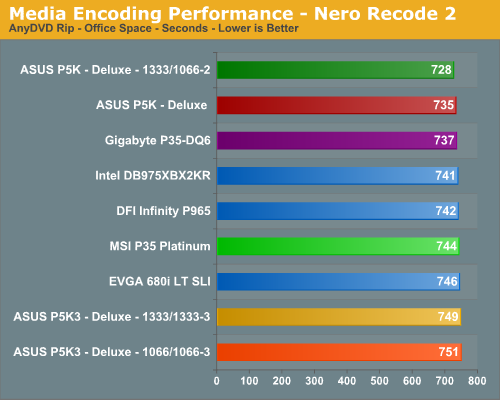
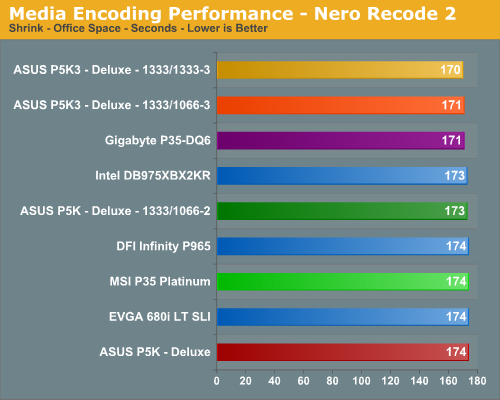
The AnyDVD Rip results are very interesting as we did not expect our DDR3 boards to perform in this manner when compared to the DDR2 boards, especially against the same chipset. Even though latencies are higher, the increased bandwidth would normally bring the DDR3 board within range of the DDR2 boards in a test that is CPU and disk intensive. The 3% performance deficit was unusual to say the least. The Shrink results are more in alignment showing a 2% difference between the boards, although for the first time we see the P5K Deluxe board falter a little at stock settings. We noticed at the beginning of the test there was always a brief stutter with this board. The change to 1333FSB really does not improve the scores.
Our next test has us converting our day at the beach AVI file into a high definition WMV file suitable for our Aunt Gertrude to view on her new high definition LCD TV. We ensured our quality settings were set to High Definition. The balance of options is set to standard settings and then we let this program do its magic. We are reporting the numbers in seconds to complete the conversion.
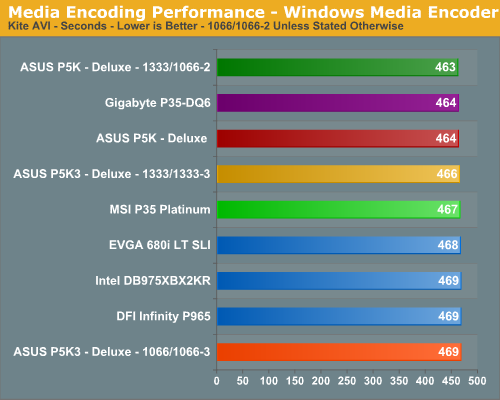
We see the boards with the best overall memory and latency performance once again leading in a test that is both CPU and memory sensitive. The difference is only a rather small 1.3% between the fastest and slowest scores, however.
Next on the list is our QuickTime Pro 7.1 test that will convert our newly downloaded .MOV file into a plasma screen pleasing H264 format. We ensured our quality settings were set to their highest levels and then let the horses loose. The values reported are in minutes/seconds for the conversion time, with lower numbers being better.
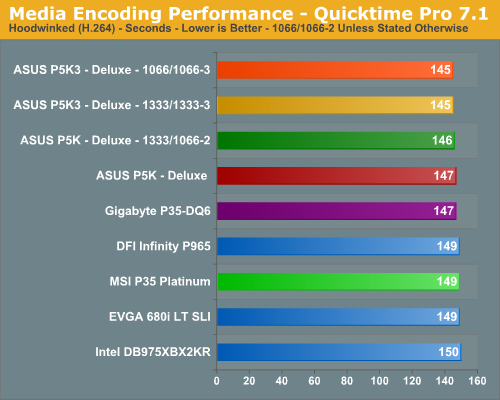
Once again, the 1333 platforms have a slight advantage in this test although the differences are minimal. Outside of the MSI board, all of the P35 boards are scoring slightly faster than the older chipsets, and the total range of scores differs by 3.5%.
Audio Encoding Performance
Our audio test suite normally consists of Exact Audio Copy v095.b4 and LAME 3.98a3. We did run these tests with basically the same results but for our purposes today we will utilize iTunes 7.1 as it is one of the most utilized audio applications available due to the immense popularity of the iPod. As in previous articles, we are using an INXS Greatest Hits CD for testing, which contains 16 tracks totaling 606MB of songs.Our first test consists of utilizing iTunes to rip our INXS CD in WAV format onto our hard drive. Even though CPU speed and optical drive selection have a great impact on these test results we are using the same optical drive between platforms for each test.
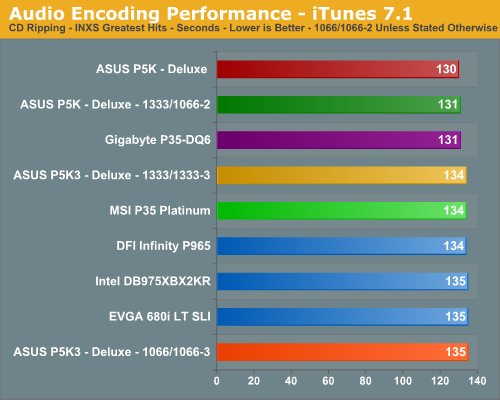
It's interesting to see our two boards from ASUS and Gigabyte at the top showing a clear separation from the rest of the pack. It wouldn't be surprising if the results of the two top boards are a result of a BIOS tweak not present on the other boards (yet). Excellent memory bandwidth and latencies are a plus for encoding although, even though these tests remain CPU and at times storage system sensitive.
Our next two tests have us utilizing iTunes to convert our WAV files into ACC or MP3 compatible formats. We utilize the 320kbps setting for both tests with the MP3 test also utilizing the variable bit rate option.
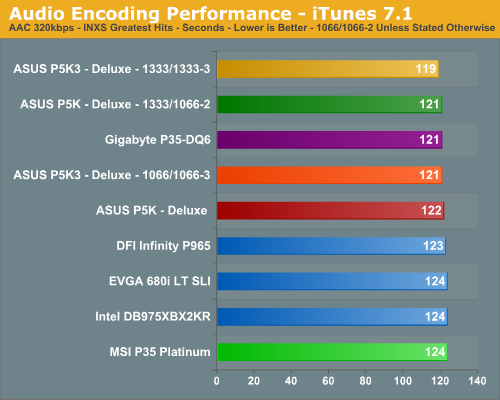
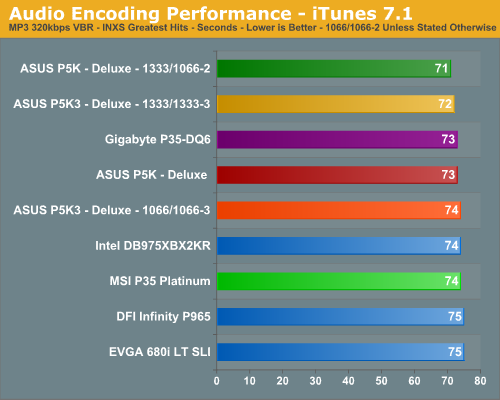
We see iTunes favoring boards with excellent CPU throughput with the 1333FSB showing a slight advantage in this test. All of the P35 boards place ahead of the older chipsets, with the exception of the MSI board. As we have mentioned already, the MSI board appears to be about two BIOS updates behind the Gigabyte and ASUS offerings right now, so we expect its scores to improve to match the other offerings with a few more updates.
Our final test has us creating a legal use copy CD from the base WAV files we collected when ripping the INXS Greatest Hits CD. Not that the world needs any more of these CDs but it makes for a good closing test. We promise all CDs are destroyed after testing much to the pleasure of our ears and those at the RIAA.
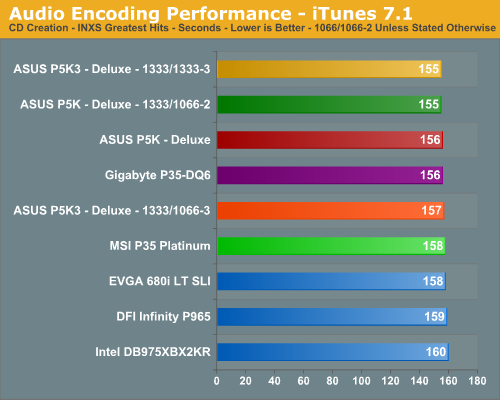
Once again our test results are extremely close with the optical drive playing a leading role in ensuring our results are fairly close. The minor differences are all attributable to the better disk performance of the P35/ICH9R combination in this case. We noticed in this test that the ICH8, ICH7, and 680i LT equipped boards always started writing to the DVD drive a little slower on the first track than the P35 boards.
Media Performance
We will take a brief look at general media performance with our test suite for that includes Adobe Photoshop CS3, Adobe Photoshop Elements 5.0, and Windows Movie Maker.We utilize the widely available Retouch Artists Photoshop Speed Test for measuring platform performance in Adobe's Photoshop CS3. The benchmark applies a number of actions to a test image while we measure the total time elapsed during the active portion of the test. We set history states to 1, cache levels to 4, and CS3 is configured to make use of all available system memory. The scores reported include the full conversion process and are represented in seconds, with lower numbers indicating better performance.
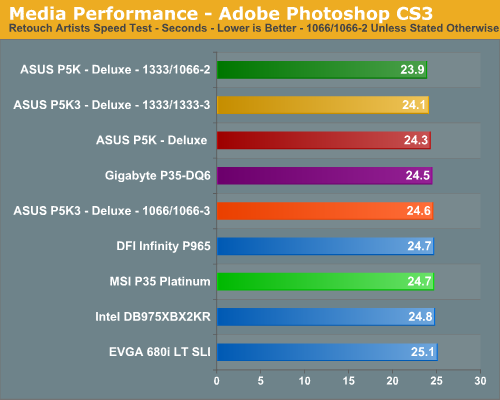
The results are in alignment with the majority of our tests to date. The 1333FSB platforms hold an advantage, although minor, in tests where CPU throughput and memory bandwidth are important.
Our next test is one recommended by Intel, but the test itself appears to be fair and results are very repeatable. This test simply measures the amount of time required to fix and optimize 103 different photos weighing in at 63MB. Time is measured in seconds and lower times indicate better performance:
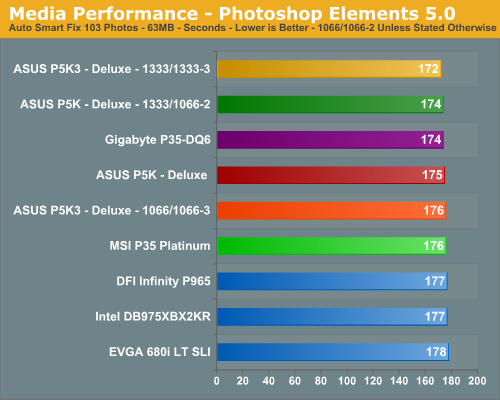
This test not only stresses the CPU but also gives the storage systems a good workout. However, our results basically mirror those of our other media tests wtih the 1333FSB boards finishing slightly ahead and the Gigabyte/ASUS boards fighting for first place in the 1066/1066 setups.
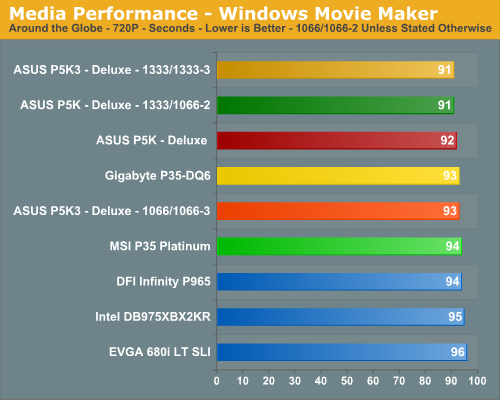
Again, the new Intel platform boards come out on top in this test, with the 1333 FSB offerings providing the best performance. The total spread is 5.5% here, showing that the memory and FSB optimizations of P35 can certainly be felt in video encoding.
File Compression Performance
In order to save space on our hard drives and ensure we had another CPU crunching utility, we will be reporting our file compression results with the latest version of WinRAR that fully supports multi-treaded operations and should be of particular interest for those users with dual core or multi-processor systems. Our series of file compression tests utilizes WinRAR 3.62 to compress our test folder that contains 444 files, ten subfolders, and 602MB worth of data. All default settings are utilized in WinRAR along with our hard drive being defragmented before each test.
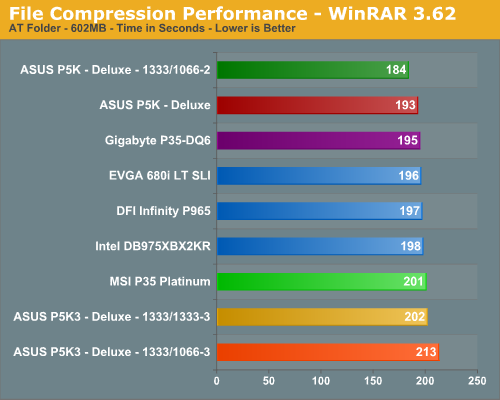
Our 1333/DDR2-1066 platform provides the top score and actually distances itself from the other boards in this CPU intensive test that heavily relies on memory throughput and latency for improved performance. In our second test that stresses latency we see the DDR3 configurations finishing last. The nature of file compression is such that memory is accessed almost constantly in a very random fashion, so page misses requiring additional time as memory banks are swapped is common.
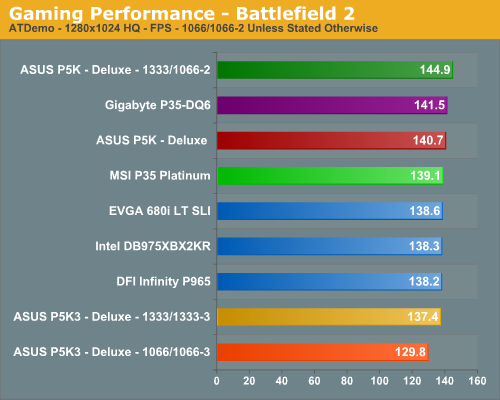
Gaming Performance
As usual, gaming performance was tested with a variety of current games. We ran benchmarks with our standard 1280x1024 resolution with all games set to High Quality mode. Given the number of users that run 19" LCDs these days, 1280x1024 represents one of the most commonly used resolutions. We will provide final CrossFire numbers in our P35 roundup.Battlefield 2
This benchmark is performed using DICE's built-in demo playback functionality with additional capture capabilities designed in house. When using the built-in demo playback features of BF2, frames rendered during the loading screen are counted in the benchmark. In order to get a real idea of performance, we use the instantaneous frame time and frames per second data generated from our benchmark run. We discard the data collected during the loading screen and calculate a result that represents actual game play. While DICE maintains that results over 100fps aren't always reliable, our methods have allowed us to get useful data from high performing systems.
During the benchmark, the camera switches between players and vehicles in order to capture the most action possible. There is a significant amount of smoke, explosions, and vehicle usage as this a very GPU intensive Battlefield 2 benchmark. We run Battlefield 2 using the highest quality graphics settings available in the video settings. The game itself is best experienced with average in-game frame rates of 40 and up.
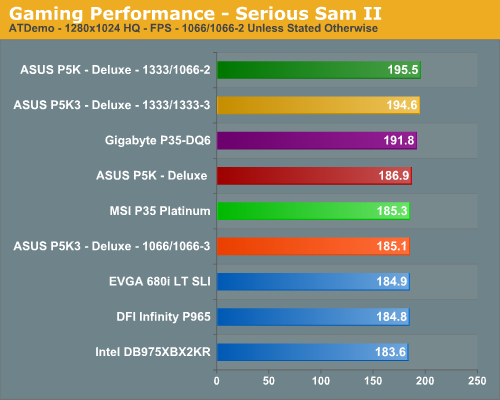
Serious Sam 2
This benchmark is performed using Croteam's built-in demo capability in the Serious Sam II engine. We utilize the included Branchester Demo and capture the playback results using the Ctrl-~ function. The benchmark features a large number of combatants, explosions, and general mayhem. The benchmark is primarily GPU sensitive with the actual percentage of GPU/CPU/Audio activity being displayed during the benchmark run. We typically find this game is very playable at average in-game rates of 60 and above. We maximize all settings except antialiasing and anisotropic filtering within the general and advanced video settings.
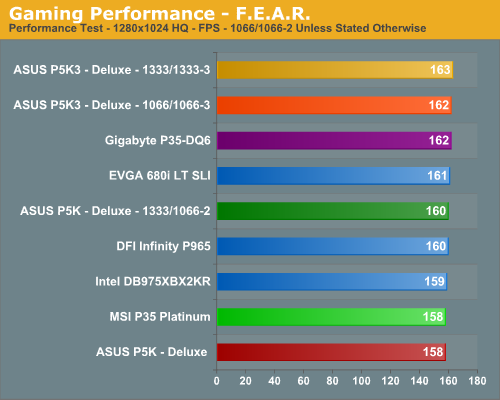
F.E.A.R.
F.E.A.R. uses a built-in performance test that generates graphical test scenes based upon the actual game engine. This test consists of a couple of different action sequences, a stressful water flyby, and heavy use of shadows while traveling through hallways. F.E.A.R. is a very graphics intensive game and we switch all settings to maximum for both the system and GPU. During our testing of F.E.A.R., we noted that the "soft shadows" don't really look soft and the performance hit is drastic, so we disable this setting. An average frame rate for F.E.A.R. can dip drastically during game play and that is not good for a first person shooter but the game is still playable around 35fps although we prefer a solid 45fps.
Gaming Summary
We see the DDR3 setups struggling in the Battlefield 2 tests in a game that is both CPU and memory sensitive. The high latencies of our DDR3 systems are taking their toll in this game. Fortunately, in the CPU/GPU bandwidth hungry F.E.A.R., the DDR3 platforms have a slight advantage. Our Serious Sam 2 benchmark is CPU/memory sensitive and the increased bandwidth offered by the 1333FSB boards allows them to take the lead.
Supreme Commander
Supreme Commander is one of the better RTS games to be released in recent memory although we are still huge fans of Command and Conquer 3 along with Company of Heroes. We chose Supreme Commander as it is both a GPU and CPU hog when it comes to systems resources. We utilize the built-in performance test to benchmark the game. We set all of the settings to high and only change the resolutions between benchmark runs. This benchmark provides a cornucopia of results but for our tests we will report the average frame rates during the benchmark. We generally find this game to be playable with frame rates at or above 35fps.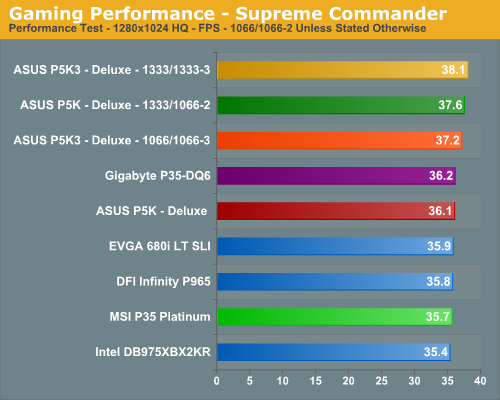
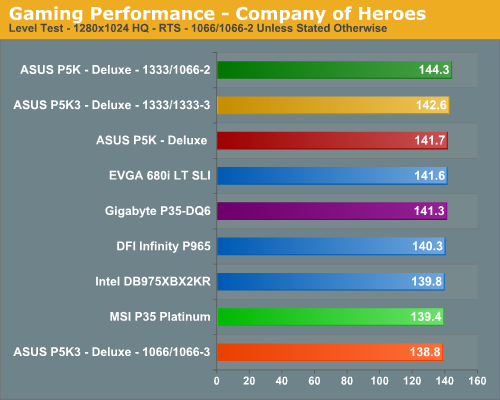
Company of Heroes
Company of Heroes was released last year and is still proving to be a very addictive RTS game around the office. The game is extremely GPU intensive and also requires a hefty CPU at times. If this is beginning to sound a lot like Oblivion, well CoH is very similar to Oblivion in system requirements. The visuals and audio experience within the game will at times have you believing the game is based more on a First Person Shooter than a traditional Real Time Strategy game. We set all options to High and turn on all additional video options.
The game contains a built-in performance test that utilizes the game engine to generate several different action scenes along with a coffee argument as a sideline distraction before the war starts. We found the performance test gives a good indication of how well your system will perform throughout the game on average. We have found some of the in-game action sequences to be more demanding than the performance test and are working on game play benchmark that is repeatable. We generally found the game to be enjoyable with an average frame rate above 35fps.
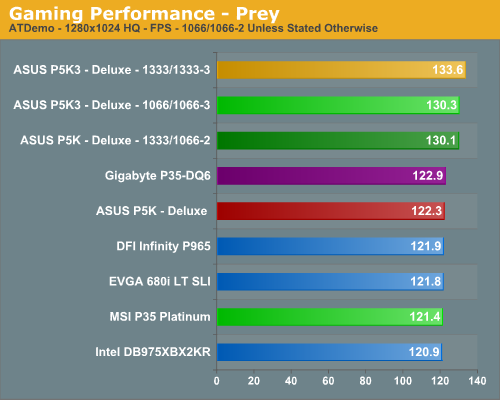
Prey
Prey offers some superb action sequences, unique weapons and characters, and is a visually stunning game at times. It still requires a very good GPU to run it with all of the eye candy turned on. We set all graphic settings to their maximum except for AA/AF and utilize a custom timedemo that takes place during one of the more action oriented sequences. We generally found the game to be enjoyable with an average frame rate above 35fps.
S.T.A.L.K.E.R.
S.T.A.L.K.E.R. is one of the favorite first person shooter games around the office as it continues to provide a great deal of replay value and the graphics are very good once the eye candy is turned on. What we especially like about the game is the atmosphere and the fact that it makes for a great system benchmark.
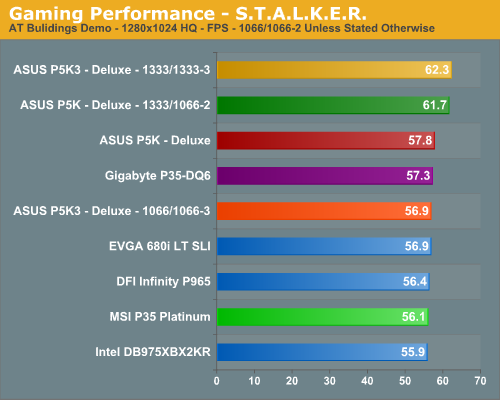
Gaming Summary
Once again the P35 boards, especially when operating at 1333 FSB, lead the pack although the differences overall are minimal when looking at the separation between boards except in Prey and S.T.A.L.K.E.R. Gaming continues to be driven by the GPU but every extra bit of performance always helps.
Disk Controller Performance
The AnandTech iPeak test is designed to measure "pure" hard disk controller performance, and in this case we keep the hard drive as consistent as possible while varying the hard drive controller. The idea is to measure the performance of each hard drive controller with the same hard drive. We report the scores as an average number of I/O operations per second so that higher scores translate into better performance. This number is somewhat meaningless as far as hard disk performance is concerned; however, the scores are useful for comparing "pure" performance of the storage controllers in this case. Results are taken from trace files of Winstones 2004. Due to compatibility issues with Vista, our IPEAK tests are run on Windows XP SP2.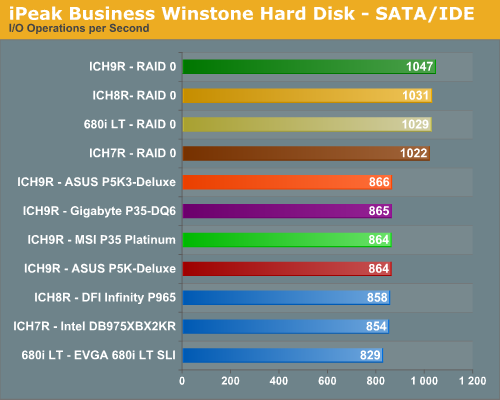
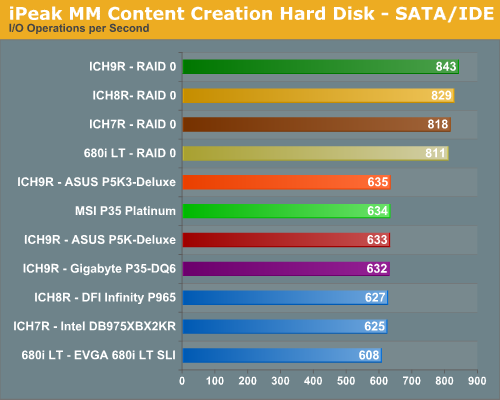
The performance patterns hold steady across both Multimedia Content I/O and Business I/O with the ICH9R outperforming the Intel ICH7R, Intel ICH8R, and NVIDIA 680i chipsets in our tests. Intel told us we should see up to a 4% difference between the ICH9 and ICH8; while our tests do not reveal that, we have noticed a difference in actual usage within Vista, especially when transferring large files. We will have Vista specific tests in the near future. Although our NVIDIA boards generally score lower in these "pure" throughput tests, we find their actual performance in disk intensive applications are generally equal to other solutions during actual usage. We did not experience any RAID 0 issues with the NV controller or drivers under Vista during normal usage but users have reported their RAID arrays degrading over time. We are still investigating these issues.
Power Consumption
As always, we measured power consumption at two states: at idle sitting at the Vista desktop and under load while running our 3DMark06 and Company of Heroes benchmarks. At both settings, EIST/C1E were disabled to show power usage with the system in a normal desktop state.
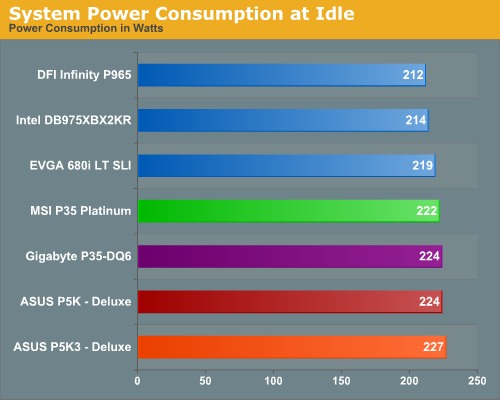
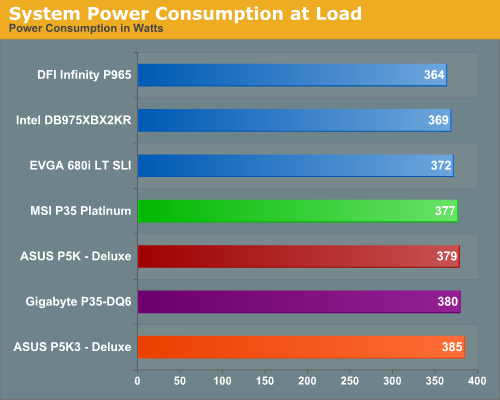
The surprise is that despite a 16W TDP, the P35 boards actually consume more power than the other chipsets at both idle and load. Even though the DDR3 board has a lower power rating for the memory, it consumes more power than the DDR2 board due to additional circuitry . We can no longer say that NVIDIA is the only high performance chipset approved by OPEC.
FSB Overclocking
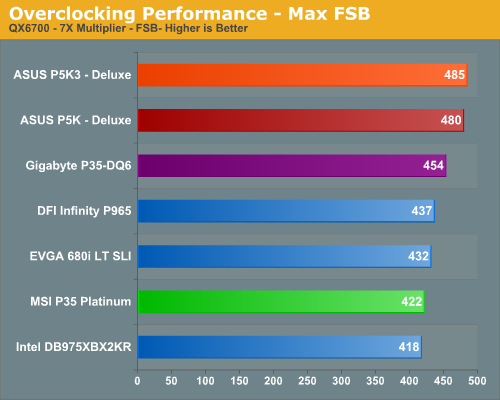
Our FSB overclocking results are limited to the quad core QX6700 for this article. We will greatly expand our overclocking results for the roundup that will include five different CPUs. Our ASUS boards overclock the quad core the best at this time thanks to a fairly mature BIOS and great board design. Our Gigabyte and MSI boards have improved greatly over the last week with new BIOS designs and we expect overclocking to improve before the official launch date. In limited testing with the E6600, we were able to hit a 576 FSB on the ASUS boards, 514 on the Gigabyte board, and 508 on the MSI board with the latest BIOS releases.
Final Words
The P965 launch is still too fresh in our memory to ignore. It appeared the roughest launch in recent Intel memory with a BIOS a day, and sometimes several a day, in the early going. Many of the features did not work, or at least did not work consistently until several months of BIOS updates. While the hard work has paid off for manufacturers and P965 is now a capable chipset, it is still not the paragon of reliability that we normally expect of Intel chipsets.Contrast that to today's performance launch of P35, and the differences are striking. P35 is very mature at launch and is generally a joy to work with. That is not to say it is perfect, as manufacturers are still scrambling to fully support all the new added features of the chipset. The base performance, however, is stable, and P35 returns us to the confidence we normally feel for Intel chipsets.
Some will say this is the result of the fact that P35 is just a mild upgrade of P965, fixing what is wrong with that chipset. We don't agree, since features like 1333 processor bus and support for DDR3 memory to 1333 speed and beyond are significant additions that definitely impact performance. Also significant is full support for the upcoming 45nm Penryn processors. As you have seen in the P35 benchmarks these are not just minor "fixes" - they are features that have a significant impact in improving system performance. No doubt Intel did tweak the base P965 code in the process, and we are grateful for that, but P35 introduces too much new that improves performance to just be considered a respin.
Looking at the four motherboards evaluated in this launch review, it is clear that all of the boards are very good with existing features like memory to DDR2-1066 and the current 1066 processor bus. However, when we move into the new performance areas of 1333 processor bus, DDR3, and 1333 memory speed, the ASUS P5K3 and P5K twins have the edge over the Gigabyte and MSI offerings. The MSI and Gigabyte are very good boards, and BIOS updates received during testing have us expecting them to be the equal of the ASUS boards in another BIOS spin or two. In fact, the Gigabyte BIOS received this weekend moves the P35 DQ6 into performance parity with the ASUS boards in early testing. For now, however, the ASUS pair is more polished in their implementation.
You will not, however, have to suffer with the Gigabyte or MSI as they both perform exceptionally well with the components we now have. Any of the four platforms will provide a rock solid base for a new system, performing better than just about any P965 board we have tested. You will not have to struggle with these P35 boards as many of you did with early P965. We also fully expect the Gigabyte and MSI to mature quickly in the "added features and refinement" category of P35.
What we did find in testing the P35 boards is that BIOS tuning is paramount to extracting the best possible performance from each board. ASUS's BIOS is very mature at this point and the extra features like Transaction Booster and CPU Voltage Damper actually make a difference in the performance of the board. We have also noticed the manufacturers starting to open up the BIOS with settings that will greatly assist the enthusiast in extracting the best possible performance from this chipset. However, we would still like to see the ability to change chipset straps and additional memory settings in the high-end P35 products.
Overall performance of the P35 chipset was impressive with it constantly finishing at the top of our benchmarks. Even though the differences in scores were minimal at times, the level of consistency shown by this chipset was impressive. The addition of DDR3 memory support, the improved memory controller, and the upcoming 1333FSB processors indicate that this mainstream chipset is a force to be reckoned with both with today's components and those on the horizon.
In current games like Prey we found a 9% increase in frame rates between the ASUS P5K3 at 1333/1333 and the Gigabyte P35-DQ6 at 1066/1066. Granted, the move to a 1333 FSB provided about a 6% improvement in frame rates on the DDR2 platform. However, once lower latency DDR3-1333 is available we expect the combination of this memory and the switch to 1333FSB processors to possibly create double-digit improvements in applications that are memory bandwidth and latency sensitive. Our main concern at this time is the cost and lack of widespread availability for DDR3 memory. Latency and speed improvements are developing quickly for DDR3 but cost appears to be the biggest stumbling block for entry into this technology now. Hopefully this will not be an issue six months from now as DDR3 ramps up in both production and system installs at major OEMs.
The ICH9R brings improved disk performance and in early RAID 5 and 10 testing we are seeing a 2% ~ 4% improvement in certain applications when compared to the ICH8R. The ICH9 also blesses us with an additional two USB ports and improved performance. Typical benchmarks like HD Tach or HD Tune do not show a difference in USB performance over the ICH8R currently; however, we are seeing measurable improvements in write and read speeds under Vista when comparing the two chipsets and a few minor compatibility issues seemed to have been solved. While not up to the speed of NVIDIA's USB solution, it is nice to see Intel making incremental improvements quickly.
We have explained the benefits of the chipset and provided an early look at its performance potential. What are the drawbacks? The P35 performance is impressive and the chipset along with the first wave of boards seem to be very solid. The problem is the cost of entry might be more than one is willing to spend to upgrade from a recently purchased P965, 680i, 650i, or even 975X board. Power consumption was a concern for us. Based on the current chipset TDP ratings we expected the power envelope to be near the P965 or possibly improved depending upon how aggressive Intel implemented power saving features on this chipset. Instead, we end up with a chipset that now consumes more power than the 680i and requires even more elaborate cooling. Something the motherboard companies have obviously taken to heart by the amount of heat pipes on the boards now. We doubt all of it is really needed but it is amusing for the time being to see the manufacturers trying to outdo each other in both design and amount of aluminum they can squeeze into a three inch square space.
There is no doubt after testing P35 that it is clearly the best-performing chipset you can buy today. Intel has done an excellent job in the added features, and performance is superb. P35 is at its best in gaming and memory-intensive applications, where the performance improvements are most dramatic. If you are building a new system there is a lot to like with P35, and it all starts with improved performance.


