The Zalman Twins: 9500 & 9700 Air Tunnels
by Wesley Fink on February 19, 2007 12:40 AM EST- Posted in
- Cases/Cooling/PSUs
CPU Cooling Test Configuration
The standard test bed for cooling tests uses an EVGA NVIDIA 680i SLI motherboard. This is primarily based on the consistent test results on this board and the excellent NVIDIA Monitor temperature measurement utility, which is part of the nTune program.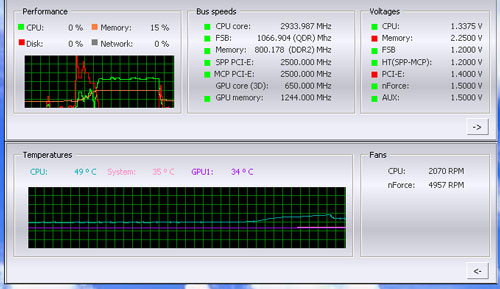
NVIDIA Monitor has a drop-down pane for temperature measurement which reports CPU, System, and GPU results. Reviews at this point will concentrate primarily on CPU temperature. In addition to the real-time temperature measurement, NVIDIA Monitor also has a logging feature which can record temperature to a file in standard increments (we selected every 4 seconds). This allows recording of temperatures during testing and play back, for example, of stress test results that can then be examined when the stress tests are completed. There is also the handy reference of speeds and voltages in the top pane to confirm the test setup.
Other components in the cooling test bed are generally the same as those used in our motherboard and memory test bed:
| Cooling Performance Test Configuration | |
| Processor | Intel Core 2 Duo X6800 (x2, 2.93GHz, 4MB Unified Cache) |
| RAM | 2x1GB Corsair Dominator PC2-8888 (DDR2-1111) |
| Hard Drive(s) | Hitachi 250GB SATA2 enabled (16MB Buffer) |
| Video Card: | 1 x EVGA 7900GTX - All Standard Tests |
| Platform Drivers: | NVIDIA 9.53 |
| NVIDIA nTune: | 5.05.22.00 (1/16/2007) |
| Video Drivers: | NVIDIA 93.71 |
| CPU Cooling: | Zalman CNPS9700 Zalman CNPS9500 Cooler Master Hyper 6+ Vigor Monsoon II Lite Thermalright MST-9775 Scythe Katana Tuniq Tower 120 Intel Stock HSF for X6800 |
| Power Supply: | OCZ PowerStream 520W |
| Motherboards: | EVGA nForce 680i SLI (NVIDIA 680i) |
| Operating System(s): | Windows XP Professional SP2 |
| BIOS | Award P24 (1/12/2007) |
All cooling tests are run with the components mounted in a standard mid-tower case. The idle and stress temperature tests are run with the case closed and standing as it would in most home setups. We do not use auxiliary fans in the test cooling case, except for the north bridge fan attached to the 680i for overclocking.
We first tested the stock Intel cooler at standard X6800 speed, measuring the CPU temperature at idle and while the CPU was being stressed. We stressed the CPU by running continuous loops of the Far Cry River demo. The same tests were repeated at the highest stable overclock we could achieve with the stock cooler. Stable in this case meant the ability to handle our Far Cry looping for at least 30 minutes.
The same tests were then run on the cooler under test at stock, highest stock cooler OC speed (3.73GHz), and the highest OC that could be achieved in the same setup with the cooler being tested. This allows measurement of the cooling efficiency of the test unit compared to stock and the improvement in overclocking capabilities, if any, from using the test cooler.
Noise Levels
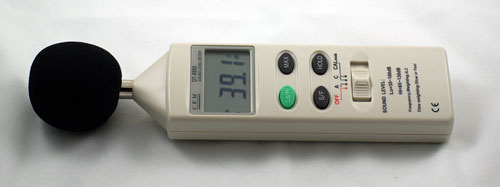
In addition to cooling efficiency and overclocking abilities, users shopping for CPU cooling solutions may also be interested in the noise levels of the cooling devices they are considering. Noise levels are measured with the case open on its side and are measured using a C.E.M. DT-8850 Sound Level meter. This meter allows accurate sound level measurements from 35bdB to 130dB with a resolution of 0.1dB and an accuracy of 1.5dB. This is sufficient for our needs in these tests, as measurement starts at the level of a relatively quiet room. Our own test room, with all computers and fans turned off, has a room noise level of 36.4dB.
Our procedures for measuring cooling system noise are described on page seven along with noise results comparing the stock Intel cooler and recently tested CPU coolers to the Zalman CNPS9500 and CNPS9700 coolers.


50 Comments
View All Comments
Scorpion - Wednesday, February 21, 2007 - link
Page 5 states:So for 30 minutes, you capture 450 data points. It's expected that the data will ramp up over the 30 minute interval and reach an approximately linear stability region towards the end.
I have a problem with your measurement evaluation and findings. I do not think this is a very conclusive or accurate measurement and evaluation criteria. This information could be useful, yes, but only as an additional evaluation criteria.
All tests need a good, quantifiable evaluation metric. The "goodness" of a test is only as good as that metric. And I conclude that what you've chosen is a poor metric. Your posterior evaluation is highly influenced by noise. The maximum could be the result of a large noise addition to the measurement.
A better choice would have been to analyze the data results from all the tests to determine a stability region in the latter part of the data measurements, for all tests. Treat the data in that region as a random variable and take the expectation over that region. That would give you a much better evaluation criteria. You could also compute the variance of the data in this region to determine how stable the performance is for each cooler. This could also be a useful metric, although I know that this may not mean much to your typical audience. Another interesting metric would be to evaluate the other region in the data, in order to measure how quickly temperature ramps up. Or put into other words, how quickly each fan responds to temperature changes.
I'm saddened to see a good and useful article brought down by it's poor evaluation criteria. It effectively reduces the confidence in your conclusions.
Wesley Fink - Friday, February 23, 2007 - link
We try to answer two questions in our cooling tests. First, most users beef up cooling to improve overclocking. We determine the highests stable overclock using a standard CPU/test bed by finding the overclock the cooler can maintain for 30 minutes of looping a demanding game. The highest OC is a very good measure of the effectivenes of the cooler and is compared to other coolers. We also measue and report the highest temperature in this load condition - and yes it does spike up and level off as you suggest. We haven't seen the huge spikes you might fear are there in our test data. Temps rise quickly and stabilize at the temp we report. This is a good indication of cooler efficiency.Second, some users beef up cooling to reduce noise. We also report the lowest noise measurements for the cooler we are testing.
Your suggestions would provide much useful information, and we may add additional testing in the future. However, for now, we are trying to cut through all the hype surrounding cooler testing and provide as much useful info to our readers as possible in a timely manner. We are comfortable that we answer the two questions above in our cooler reviews, and those are the main questions our readers are always asking us about cooler performance.
cyberkost - Tuesday, February 20, 2007 - link
I did not quite get the methodology of the noise level comparisons...Were the coolers required to provide "same cooling performance" (e.g., same CPU temperature some long time into running some stress test)? It does not seem that they were. I'm worried about Anandtech intending to adapt the noise-comparison technique described in this article. The proper technique (IMHO) would be:
1) install cooler
2) run a stress test
3) dial cooler RPM till a (judiciously) chosen (same for all coolers) CPU temperature is achieved (say 40C) in a stable manner
4) record the noice level and put it on the comparison chart
strikeback03 - Tuesday, February 20, 2007 - link
Reading the respective reviews, it would appear that at stock speeds (and possibly some others) that the Katana, for example, does not get as cool as the Tuniq even when the Katana is at max RPM and the Tuniq at minimum.rjm55 - Tuesday, February 20, 2007 - link
Can you please review the Austrian Noctua NH-U12. I've seen good and bad reviews and I want to see what you find.gloutch - Tuesday, February 20, 2007 - link
The performance of those headpipes coolers is reduced if not properly oriented.SO: What was the position of the Zalmann coolers during the test ????????????????????
Wesley Fink - Tuesday, February 20, 2007 - link
From page 4 - CPU Cooling Test Configuration:"All cooling tests are run with the components mounted in a standard mid-tower case. The idle and stress temperature tests are run with the case closed and standing as it would in most home setups. We do not use auxiliary fans in the test cooling case, except for the north bridge fan attached to the 680i for overclocking."
As an aside we have found the impact of heatpipe cooler orientation to be pretty small - we just don't leave that test criteria to chance. An article on the impact of heatpipe cooler orientation on performance could be interesting.
orion23 - Monday, February 19, 2007 - link
Hi!Thanks for this awesome review. Only 2 top coolers left to review:
Thermalright Ultra 120
Scythe Infinity!
It is great to see Anandtech starting to review other PC components such as CPU Coolers and RAM. Things can be very quiet around here unless a new CPU, GPU or MotherBoard comes along......
Hopefully this is only the beginning of a new Anandtech that will review other important PC components such as the PSU, CPU Coolers, (AIR / Water), Fan Controllers...
It wouldn't hurt to have more stuff to read around here!
DrMrLordX - Tuesday, February 20, 2007 - link
Actually, the SI-128 and Noctua NH-U12F probably deserve a review at some point as well. Maybe even the Scythe Mine? The Mine can supposedly outperform the Ninja when using high-cfm fans, but your guess is as good as mine when it comes to actually mounting a 120mm fan on the Mine that normally takes a 100mm fan.DrMrLordX - Tuesday, February 20, 2007 - link
Woops, I forgot the Big Typhoon and Big Typhoon VX.