Balancing Power, Price, and Performance in the Server CPU World
by Johan De Gelas on March 3, 2011 7:07 PM EST- Posted in
- IT Computing
- AMD
- Intel
- 1000W
- Xeon
- Opteron
- Cloud Computing
Virtual Performance on vSphere 4
Performance might not be the top priority when you buy these types of servers, but it is still important. The Tyan server can have up 96GB of RAM, so you don't want the CPU to become a bottleneck when you are consolidating your workloads. You also want quite a bit of future headroom in case you like postponing the capital investment in new servers.
So we turned to our vApusMark II, which runs eight virtual machines. Each virtual machine contains a real-world application, not just benchmarks. You can find a detailed description of how vApusMark II is set up and configured here.
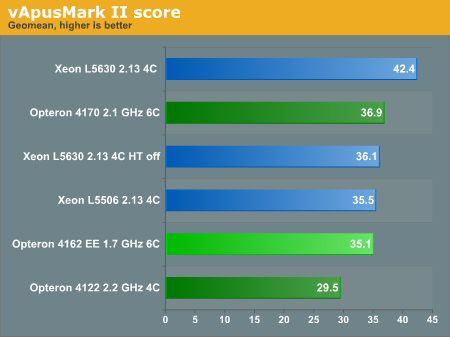
Interestingly, the L5630 wins with a 17% margin thanks to Hyper-Threading. The Opteron 4170 HE holds its own pretty well considering it is three times cheaper. However, it is important to understand that the lower the price of the CPU, the less impact it will have in the overall capital investment in the servers.


35 Comments
View All Comments
pvdw - Thursday, March 10, 2011 - link
Don't worry duploxxx, no company in their right mind would hire him. And those who do, deserve what they get for just hiring a zealot with little to no expertise.pvdw - Thursday, March 10, 2011 - link
He's just a mindless troll, let's ignore him.theangryintern - Friday, March 11, 2011 - link
This is a bit OT, did I miss the full article about AnandTech's server upgrade, or has the story not been posted yet? I remember we got a couple preview articles, and now nothing for several months. I was really interested in seeing the full story of the upgrades.gujiong2002 - Tuesday, April 5, 2011 - link
Typo?meorah - Wednesday, April 20, 2011 - link
Its too bad the benchmarks didn't include comparisons to a mainstream processor like the E5620. That way we could get a sense of scale between all the low power processor performance/power usage levels.In other words, if the E5620 is only slightly worse than the low power processors, it makes the scale smaller so the differences between the low power processors are more pronounced, similar to the charts in the article.
However, if the E5620 is much worse than the low power procs, it makes the chart scale much higher and suddenly the relative difference between the low power procs seems almost insignificant.
I understand the concept of max density and therefore max performance/watt for datacenters, but there are plenty of small businesses with 1-4 racks in a corporate site computer closet running back-office systems who are also interested in balancing TCO on a smaller scale, and including a mainstream proc in your charts would help them (me). :)