Samsung SSD 840 Pro (256GB) Review
by Anand Lal Shimpi on September 24, 2012 7:00 AM EST- Posted in
- Storage
- SSDs
- Samsung
- Samsung SSD 840
AnandTech Storage Bench 2011
Two years ago we introduced our AnandTech Storage Bench, a suite of benchmarks that took traces of real OS/application usage and played them back in a repeatable manner. I assembled the traces myself out of frustration with the majority of what we have today in terms of SSD benchmarks.
Although the AnandTech Storage Bench tests did a good job of characterizing SSD performance, they weren't stressful enough. All of the tests performed less than 10GB of reads/writes and typically involved only 4GB of writes specifically. That's not even enough exceed the spare area on most SSDs. Most canned SSD benchmarks don't even come close to writing a single gigabyte of data, but that doesn't mean that simply writing 4GB is acceptable.
Originally I kept the benchmarks short enough that they wouldn't be a burden to run (~30 minutes) but long enough that they were representative of what a power user might do with their system.
Not too long ago I tweeted that I had created what I referred to as the Mother of All SSD Benchmarks (MOASB). Rather than only writing 4GB of data to the drive, this benchmark writes 106.32GB. It's the load you'd put on a drive after nearly two weeks of constant usage. And it takes a *long* time to run.
1) The MOASB, officially called AnandTech Storage Bench 2011 - Heavy Workload, mainly focuses on the times when your I/O activity is the highest. There is a lot of downloading and application installing that happens during the course of this test. My thinking was that it's during application installs, file copies, downloading and multitasking with all of this that you can really notice performance differences between drives.
2) I tried to cover as many bases as possible with the software I incorporated into this test. There's a lot of photo editing in Photoshop, HTML editing in Dreamweaver, web browsing, game playing/level loading (Starcraft II & WoW are both a part of the test) as well as general use stuff (application installing, virus scanning). I included a large amount of email downloading, document creation and editing as well. To top it all off I even use Visual Studio 2008 to build Chromium during the test.
The test has 2,168,893 read operations and 1,783,447 write operations. The IO breakdown is as follows:
| AnandTech Storage Bench 2011 - Heavy Workload IO Breakdown | ||||
| IO Size | % of Total | |||
| 4KB | 28% | |||
| 16KB | 10% | |||
| 32KB | 10% | |||
| 64KB | 4% | |||
Only 42% of all operations are sequential, the rest range from pseudo to fully random (with most falling in the pseudo-random category). Average queue depth is 4.625 IOs, with 59% of operations taking place in an IO queue of 1.
Many of you have asked for a better way to really characterize performance. Simply looking at IOPS doesn't really say much. As a result I'm going to be presenting Storage Bench 2011 data in a slightly different way. We'll have performance represented as Average MB/s, with higher numbers being better. At the same time I'll be reporting how long the SSD was busy while running this test. These disk busy graphs will show you exactly how much time was shaved off by using a faster drive vs. a slower one during the course of this test. Finally, I will also break out performance into reads, writes and combined. The reason I do this is to help balance out the fact that this test is unusually write intensive, which can often hide the benefits of a drive with good read performance.
There's also a new light workload for 2011. This is a far more reasonable, typical every day use case benchmark. Lots of web browsing, photo editing (but with a greater focus on photo consumption), video playback as well as some application installs and gaming. This test isn't nearly as write intensive as the MOASB but it's still multiple times more write intensive than what we were running in 2010.
As always I don't believe that these two benchmarks alone are enough to characterize the performance of a drive, but hopefully along with the rest of our tests they will help provide a better idea.
The testbed for Storage Bench 2011 has changed as well. We're now using a Sandy Bridge platform with full 6Gbps support for these tests.
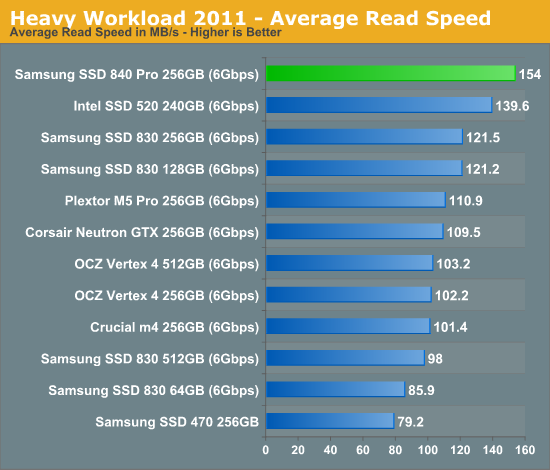
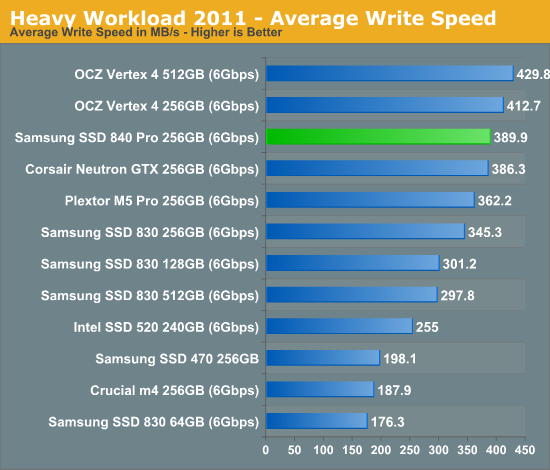
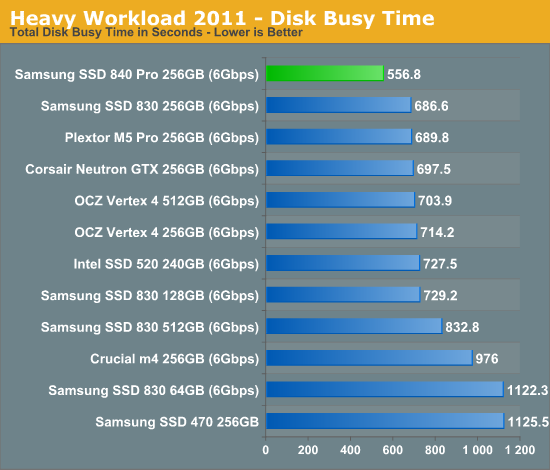
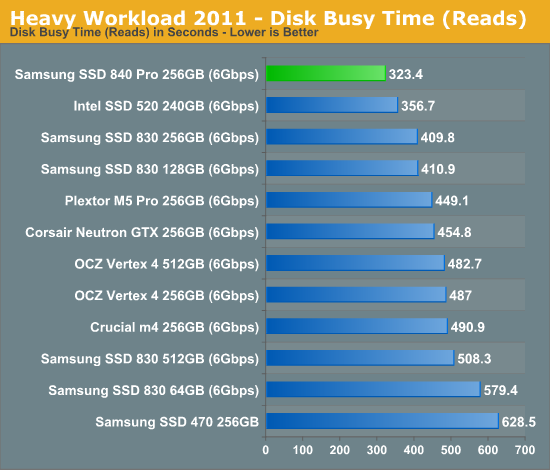
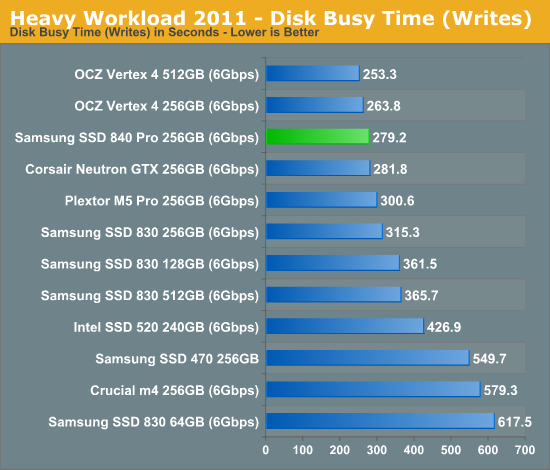
AnandTech Storage Bench 2011 - Heavy Workload
We'll start out by looking at average data rate throughout our new heavy workload test:
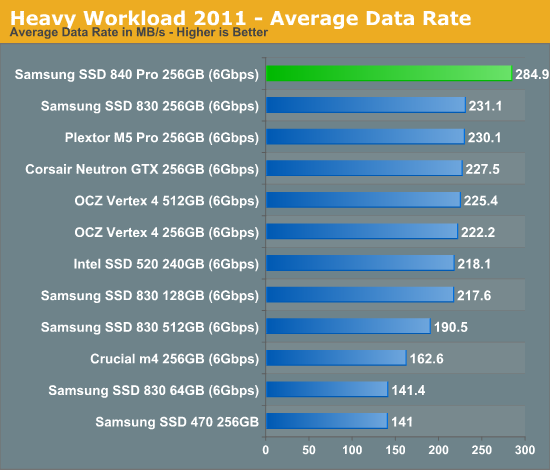
A strong showing in all of our low level IO tests, with no drawbacks, results in 24% better performance than the 830 in our heavy workload. There's simply no faster drive than the 840 Pro.
The next three charts just represent the same data, but in a different manner. Instead of looking at average data rate, we're looking at how long the disk was busy for during this entire test. Note that disk busy time excludes any and all idles, this is just how long the SSD was busy doing something:


96 Comments
View All Comments
Kristian Vättö - Wednesday, September 26, 2012 - link
We managed to run all of our normal tests (i.e. the stuff needed for this review) and Anand was simply running some enterprise tests to see how the 840 Pro behaves there. This is quite normal testing for us, so it's not like we were trying to break the drive on purpose.A new drive is already on its way to Anand, plus I have the regular 840.
Benny_k80 - Friday, November 16, 2012 - link
What happened to the information about the defect drives? Did Samsung have any explanation?hasseb64 - Thursday, September 27, 2012 - link
Why the big differens between claimed and tested power consumption?Roughly 3 watts is very high in a ultrabook, are there any sub 1 watt SDD left out there?
Per Hansson - Friday, September 28, 2012 - link
hasseb64: look at the previous comments regarding DIPM & EIST.There might be some problems with the testing performed, lack of DIPM can have a huge power consumption difference...
The sampling interval of the device they use to measure power consumption is also very important since SSD's switch power states very very frequently...
GullLars - Friday, September 28, 2012 - link
I just have to say, this drive impressed me. If the stability is the same as 830 Samsung has a real winner here.One of the things i note here is something i've noticed the lack of in other SSDs earlier, and been vocal about. Since the SSDs have large DRAM buffers, they should easily be able to use it as a read-ahead for small block sequential and low QD sequential reads. Going by the iometer 128KB seq read and ATTO graphs, i'd say this is exactly what samsung has done.
It also seems they have implemented a decent sized write buffer to do the same for writes. Let's hope it's implemented safely so you don't loose or corrupt data on powerloss.
I've been recommending 830 lately, and if early reports (after the first month) indicate 840 pro is stable, it will be the my recommendation if the prices are decent.
With the maxing of SATA 6Gbps getting close (or is already here?), it's now time for SATA Express or just native PCIe SSDs.
thefizzle656 - Monday, October 1, 2012 - link
Hey Kristian between the 840 Pro and the M5 Pro which would you choose? It would be going into a 2011 MBP for both OS X and Boot Camp. I'm looking to get a 512 GB drive and it looks like the M5 Pro is going to coming in at less than $450, so my thought is to get the drive that is the cheapest. Please let me know. Thanks.chrcoluk - Friday, October 12, 2012 - link
Whilst these benchmarks all look pretty sweet, they ultimately dont mean much.In real world usage I expect a 840 PRO wont feel any faster than my 830 at all, and the fact they sweep aside a quickly driving drive as not relevant is a worry.
Whilst performance is important, reliability is something I value higher. Also value for money shouldnt be ignored either, so in my opinion the best thing about this drive is it is making the 830 cheaper.
Also the non pro 840 uses TLC which I suspect reduces life expectancy and increases CRC error rates, I would avoid the normal 840 completely whilst MLC drives are still on the market.
So thanks for the review and thanks for the price drops samsung so now I can buy another 830 this time for my laptop :).
dgigibao - Wednesday, October 17, 2012 - link
Several times you recommend the Samsung 830 for Mac OSX users for the same kind of controller whitch Apple in puts in their factory SSD. Whould would recommend 840 Pro for Mac OSX users to?Benny_k80 - Tuesday, November 13, 2012 - link
What happened to the information about the defect drives? Did Samsung have any explanation?FCss - Wednesday, November 14, 2012 - link
I was about to buy this SSD today and just went through the article again and saw the update about the second drive dying. I hope it's not a design flaw.