LG 29EA93 Monitor Review - Rev. 1.25
by Chris Heinonen on February 12, 2013 8:49 PM ESTOnce again we are copying our charts from our Tablet and Smartphone workflow here for monitors. As I mentioned earlier, you can’t compare these to prior results due to the use of dE2000 for numbers. Another key change here is the ability to use meter profiling for doing measurements, which I’ll elaborate on here a bit to put these numbers into context.
There are two main types of meters: colorimeters and spectrometers. Colorimeters are usually cheaper, and use color filters to read the different colors of light. Spectrometers often cost more but actually “read” the light instead of using filters. This difference is key as color filters were very good when the only light sources were CRTs or CCFL lamps, but now with White and Multi-colors LEDs, and OLED displays, we have light with a different spectral makeup than before, which the filters are often not designed around. This can cause a colorimeter to have incorrect readings but a spectrometer will not.
The reason we don’t always use spectrometers is because they are much slower, and they read at low light much worse that a colorimeter. With meter profiling, you use a spectrometer and colorimeter to read colored patches from a display, and then the software analyzes the results. This creates a 3x3 correction matrix for the colorimeter that then allows it to correctly read the light from the display, even if it is LED or OLED based. The key thing here is this now allows us to read shadows better, and do more readings to produce better results.
The main area of difference here is going to be in blues. Compared to 100% White, 100% Blue has only 7% of the light output, making it very dim. This makes it harder to read for a spectrometer, which makes it more prone to error. Now that we can use a profiled colorimeter to make this reading, and in my case use a C6 meter that can average 10 results at a time to produce a more accurate number, our blue numbers may be different than before, but they will be more accurate.
| Pre-Calibration | 200 cd/m² Target | 80 cd/m² Target | |
| Primary and Secondaries dE2000 | 2.3002 | 1.4839 | 2.0847 |
| Colorchecker dE2000 | 2.1689 | 1.0185 | 0.9915 |
| Saturations dE2000 | 1.7017 | 1.0126 | 1.1254 |
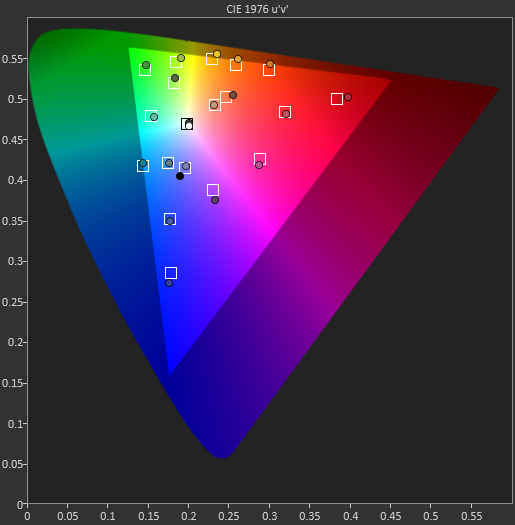
With that out of the way, we can look at the CIE gamut chart and see that the LG 29EA93 has a bit more than the sRGB gamut available, with reds and greens that extend beyond the CIE triangle. Pre-calibration our numbers look very good, but with a bit of over-saturation in the reds and greens. The 200 cd/m² calibration numbers look better than the 80 cd/m² when it comes to the CIExy chart, but frankly I’m more concerned with the color checker and saturation charts. Most people only focus on the CIE chart, but it really just shows the performance of 6 colors and the size of the gamut, but tells you nothing about the performance of the other 16.7 million colors you might use.

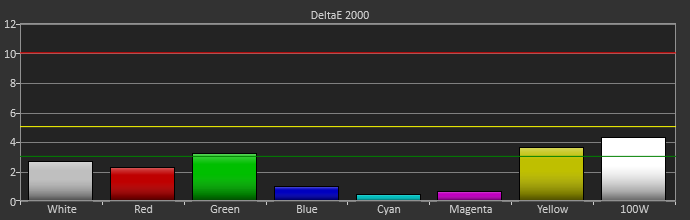
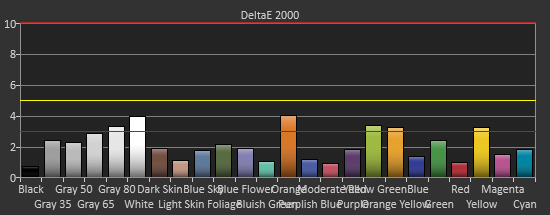
Pre-calibration, the dE2000 number for the Color Checker chart is quite good on the LG 29EA93. Until we have more monitors done with the new workflow we can’t be certain of how good this is, but overall it does look very nice. The main issues are in pure white, and those Yellow-Red-Green tones that fall at the edge of the gamut. The bit of over-saturation that we saw earlier causes these to be a bit too-rich and leads to some visible errors there.
After calibration, only those over-saturated colors provide anything to care about at all. Beyond those four points, the other 20 samples are nearly perfect, with no visible error at all even in blues. If those final four points were perfect there would be nothing to complain about at all with the LG 29EA93, but even with them it produces overall dE2000 numbers that are fantastic.
Pre-calibration, the saturation numbers for the LG are good, but you can see quite a few of the measurements are at or close to the dE2000 3.0 mark. Post-calibration this improves, especially the 20% data, with only the 100% green and yellow color swatches measuring over 3.0, and only four measurements total over a dE2000 of 2.0. The calibrations push the saturation measurements from good to excellent.

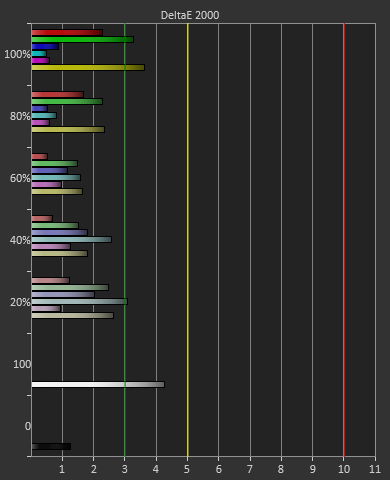
Taking these measurements in full, it seems that after calibration, the only place you will see any color errors on the LG 29EA93 is in a fully saturated red, green, or possibly yellow. As soon as the saturation drops below 100% the error level drops drastically, and you won’t be able to see an error at all. Unless you start at a pure-red screen all day long, the color of the LG 29EA93 is going to be very impressive.


108 Comments
View All Comments
Lifted - Tuesday, February 12, 2013 - link
Just to clarify, that was all on the homepage, before clicking on the review. I only clicked on the review as the last tiny little paragraph, tucked in below the image, gave a clue that it may be worth a read. That last paragraph should go up top.inighthawki - Tuesday, February 12, 2013 - link
Same here, I almost stopped reading after about two sentences. The only reason I continued was because I believed down to earth there had to be a "but" in there somewhere, nobody could actually start a review and just say "it's bad" and be done with it :).bovinda - Tuesday, February 12, 2013 - link
I actually liked the way it was done - it set the stage well. I actually think the first few sentences do a good job of piquing one's curiosity, for exactly the reasons inighthawki stated. I wouldn't have changed it. To each their own. :)niva - Tuesday, February 12, 2013 - link
Right on, this is exactly how I felt. The title and first few words in this article almost caused me to not read thinking it was a bad product... subsequently it turned out it's actually a really good display.THizzle7XU - Tuesday, February 12, 2013 - link
Ya, the entire opening of this article made it sound like the first review was a disaster of a product. I went back to read it and it was actually a mixed, leaning positive review of the 1.09 version. And this is the much improved version.Very misleading opening...
cheinonen - Wednesday, February 13, 2013 - link
Alright, I'll get an edit in there then to make it more clear. I liked the opening, but it seems that what is clear in my head certainly didn't get communicated well once it was written.wujj123456 - Tuesday, February 12, 2013 - link
Does anyone know detailed documentations of how to perform these calibration and tests? I just searched a bit, and the CalMAN software/tool doesn't seem to be expensive. I'd love to get a hold of it so that I can calibrate my own monitors.I've been long aware that many monitors look so awful without calibration, but without a good workflow, I was just messing around until I am comfortable with what I saw...
jjj - Tuesday, February 12, 2013 - link
It's not so much about the software but the hardware , you can try to rent or find a store that calibrates screens for cheap or at the very least try the ICC profiles on TFT Central.,if they have one for your screen.cheinonen - Wednesday, February 13, 2013 - link
The PC portion of CalMAN is still in an Open Beta, which is why the uniformity numbers aren't taken from CalMAN. I can export all of the data to use, but I can't have it generate the charts for me the way that I want them yet.The real cost is hardware. As mentioned in the LG Calibration Hardware review, I'm using an i1Pro ($900 or so), a SpectraCal C6 ($700), and CalMAN ($400 or so for this package). You can get decent results with a cheaper meter, but it can also be hit-and-miss depending on the display. Most PC calibration is fairly automated, it's video displays that take a lot more work to get right.
CalMAN has a free download available I believe. It only uses a simulated meter, so you can't take actual measurements, but you could get that and then the open beta of the PC Calibration Workflow on their forums and see how it works.
kevith - Tuesday, February 12, 2013 - link
Watch out, or that's gonna be your new title...Nice review.