The Intel Haswell Refresh Review: Core i7-4790, i5-4690 and i3-4360 Tested
by Ian Cutress on May 11, 2014 3:01 AM ESTReal World Benchmarks
2D to 3D Rendering –Agisoft PhotoScan v1.0: link
Agisoft Photoscan creates 3D models from 2D images, a process which is very computationally expensive. The algorithm is split into four distinct phases, and different phases of the model reconstruction require either fast memory, fast IPC, more cores, or even OpenCL compute devices to hand. Agisoft supplied us with a special version of the software to script the process, where we take 50 images of a stately home and convert it into a medium quality model. This benchmark typically takes around 15-20 minutes on a high end PC on the CPU alone, with GPUs reducing the time.
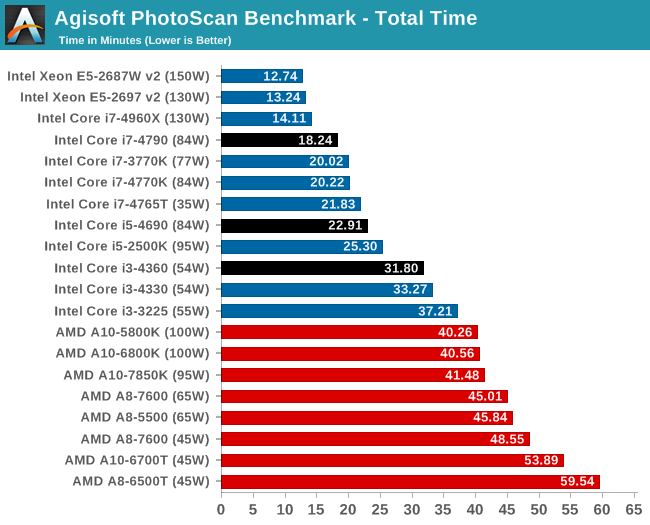
For Photoscan we see the incremental speedup with the i3 models, but the increased single thread speed of the i7 makes more of a difference.
Compression – WinRAR 5.0.1: link
Our WinRAR test from 2013 is updated to the latest version of WinRAR at the start of 2014. We compress a set of 2867 files across 320 folders totaling 1.52 GB in size – 95% of these files are small typical website files, and the rest (90% of the size) are small 30 second 720p videos.
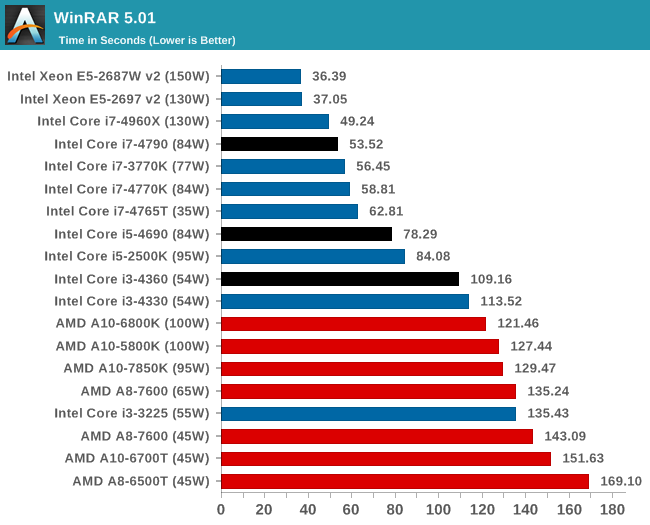
For WinRAR, the increase in the threads makes the most difference here, moving from i5-4690 to i7-4675T.
Image Manipulation – FastStone Image Viewer 4.9: link
Similarly to WinRAR, the FastStone test us updated for 2014 to the latest version. FastStone is the program I use to perform quick or bulk actions on images, such as resizing, adjusting for color and cropping. In our test we take a series of 170 images in various sizes and formats and convert them all into 640x480 .gif files, maintaining the aspect ratio. FastStone does not use multithreading for this test, and thus single threaded performance is often the winner.
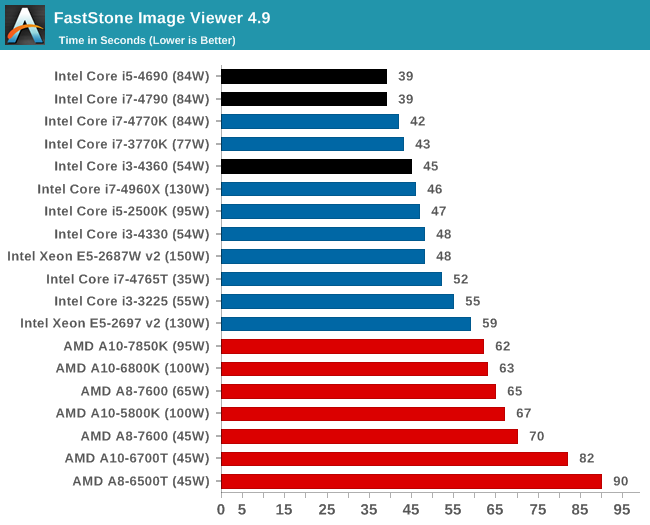
FastStone is all about the single thread speed.
Video Conversion – Xilisoft Video Converter 7: link
The XVC test I normally do is updated to the full version of the software, and this time a different test as well. Here we take two different videos: a double UHD (3840x4320) clip of 10 minutes and a 640x266 DVD rip of a 2h20 film and convert both to iPod suitable formats. The reasoning here is simple – when frames are small enough to fit into memory, the algorithm has more chance to apply work between threads and process the video quicker. Results shown are in seconds and time taken to encode.
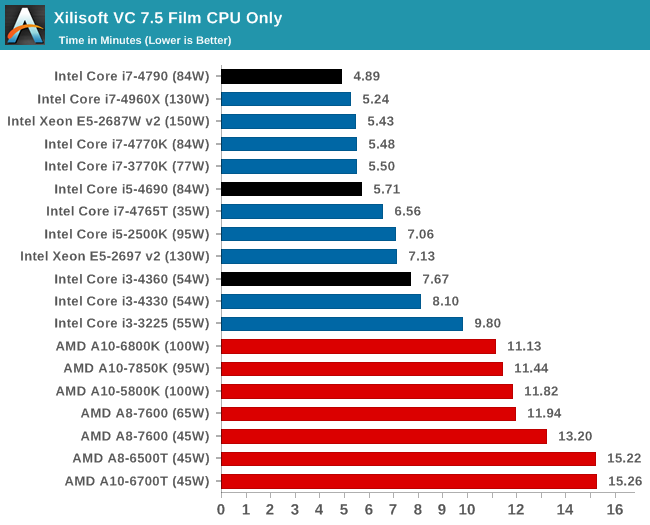
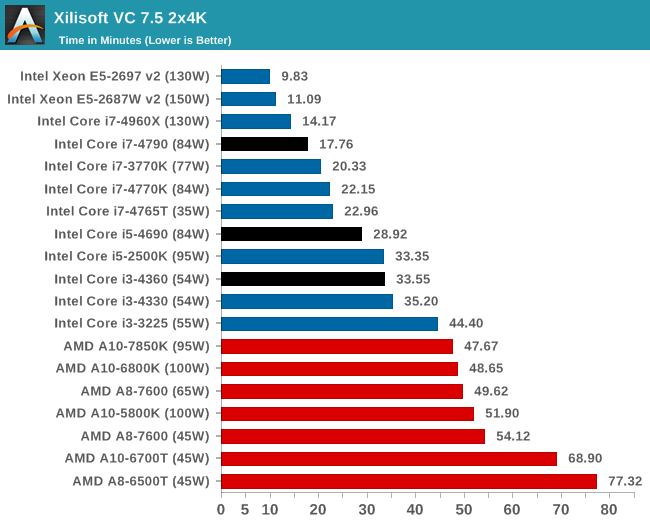
Small frames prefer more single thread MHz, whereas the dual 4K frame conversion prefers threads.
Video Conversion – Handbrake v0.9.9: link
Handbrake is a media conversion tool that was initially designed to help DVD ISOs and Video CDs into more common video formats. The principle today is still the same, primarily as an output for H.264 + AAC/MP3 audio within an MKV container. In our test we use the same videos as in the Xilisoft test, and results are given in frames per second.
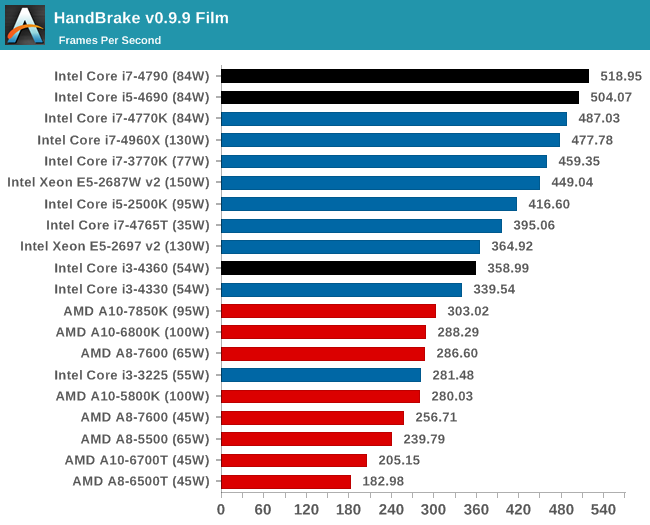
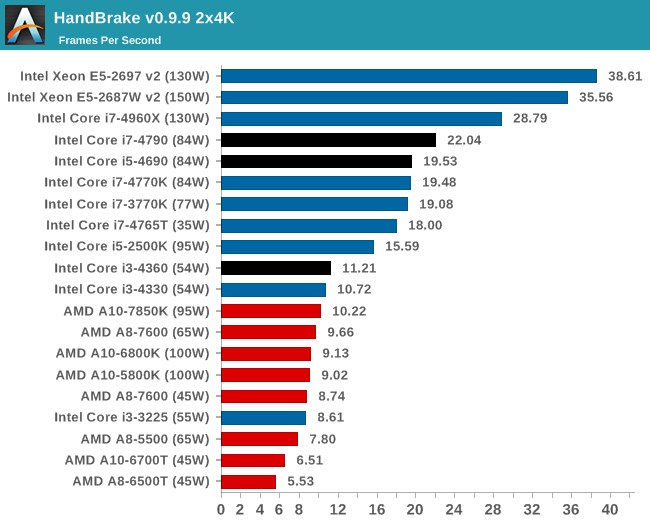
With Handbrake it would seem that it prefers actual cores rather than hyperthreading, given by the i5 and i7 being relatively close and 2x the i3.


130 Comments
View All Comments
roxamis - Monday, May 12, 2014 - link
Take the measurement as qualitative not quantitive.Power consumption at the wall doesn't mean much as a number. Its wrong on many levels, only one of which is the PSU efficiency. It doesn't really matter what % is the load, you measure one thing and you try to deduce something else
Wall plug wattmeters can't measure PSUs correclty anyway. Take these numbers with a grain of salt.
MrSpadge - Monday, May 12, 2014 - link
The way it is done now fold the power efficiency curve of the PSU (which is rather steep at low loads) with the actual differences between components (which is what we actually want to measure). Noting that the method in general is not very precise doesn't change this.And since power consumption is not plotted for the multi-GPU setups (and doesn't need to, for such an article) it's not necessary to keep the PSU similar across all configurations. I'd rather have a flat PSU curve for all CPUs - this way I could better judge the differences between them.
rajod1 - Friday, May 30, 2014 - link
Wall power readings do mean something to some people just not you.wpcoe - Sunday, May 11, 2014 - link
The chart comparing the three new Haswell Refresh CPUs with the three previous counterparts shows the i3-4330 as 3500 base frequency, but all the benchmarks following a bit later show the i3-4330 as 3.6Ghz. The ark.intel.com page shows the i3-4330 to be 3.5Ghz, so I think maybe the benchmarks have an incorrect speed?Ian Cutress - Sunday, May 11, 2014 - link
It was just those power test graphs that had it mistyped, my bad. Review updated, 3.5 GHz is the correct frequency.The0ne - Sunday, May 11, 2014 - link
The separation of desktop and workstation hasn't changed. It is technology that has changed and allowed for smaller, faster, quieter, more energy efficient hardware to be use. I felt it was unnecessary to give labels to something such as this. Human-Limiting?bji - Sunday, May 11, 2014 - link
"Human limited" vs "CPU limited" is a much, much clearer way of saying what the author is trying to say than is an artificial definition of "workstation" vs. "desktop" that you are proposing.Flunk - Monday, May 12, 2014 - link
Splitting workstation and desktop has always been about fleecing more money out of people for top end systems. There really isn't a practical difference.Smile286 - Sunday, May 11, 2014 - link
What about temperatures? Are those Haswell Refresh processors less hotter or not?Laststop311 - Sunday, May 11, 2014 - link
Well this was a pointless waste of time. We already know how Haswell performs. Should of just copy pasted the specs and linked back to previous haswell reviews. The only interesting thing, the devil's canyon with better TIM, was the only thing not covered.What people want to see is a bunch of DC OC attempts from various sites to see the average max oc and max temp it has and compare that to the 4770k. Everything else in this refresh is meaningless as we have already seen haswell benchmarked. Grats wasting your time, at least u got paid.