The NVIDIA GeForce GTX 980 Review: Maxwell Mark 2
by Ryan Smith on September 18, 2014 10:30 PM ESTMetro: Last Light
As always, kicking off our look at performance is 4A Games’ latest entry in their Metro series of subterranean shooters, Metro: Last Light. The original Metro: 2033 was a graphically punishing game for its time and Metro: Last Light is in its own right too. On the other hand it scales well with resolution and quality settings, so it’s still playable on lower end hardware.
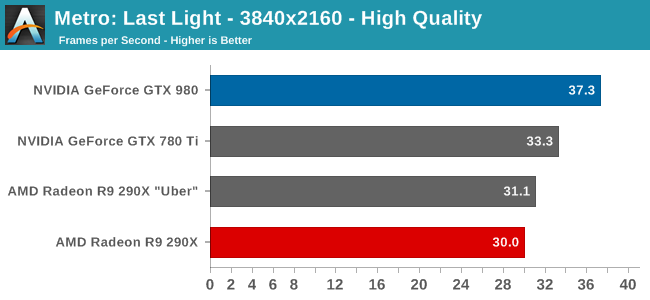
As has become customary for us for the last couple of high-end video card reviews, we’re going to be running all of our 4K video card benchmarks at both high quality and at a lower quality level. In practice not even GTX 980 is going to be fast enough to comfortably play most of these games at 3840x2160 with everything cranked up – that is going to be multi-GPU territory – so for that reason we’re including a lower quality setting to showcase just what performance looks like at settings more realistic for a single GPU.
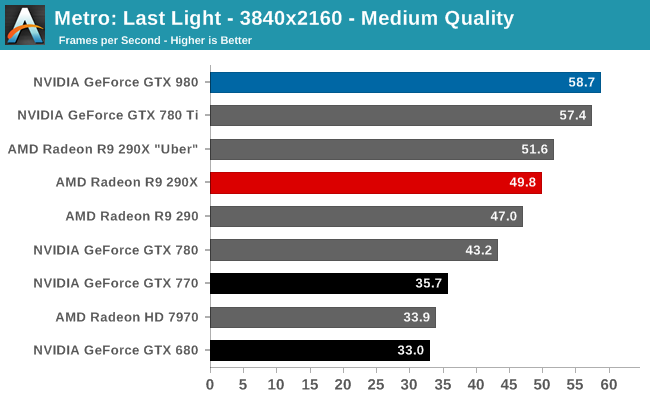
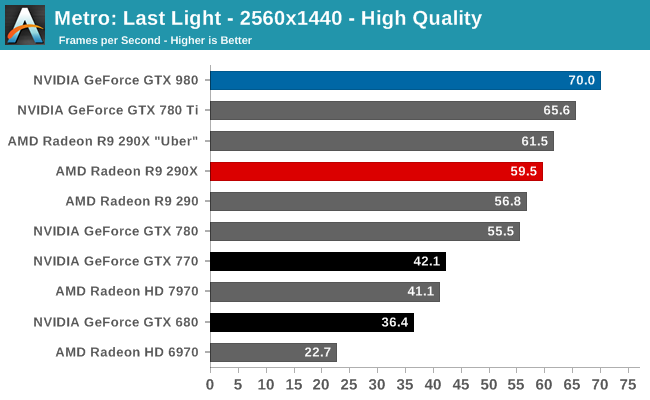
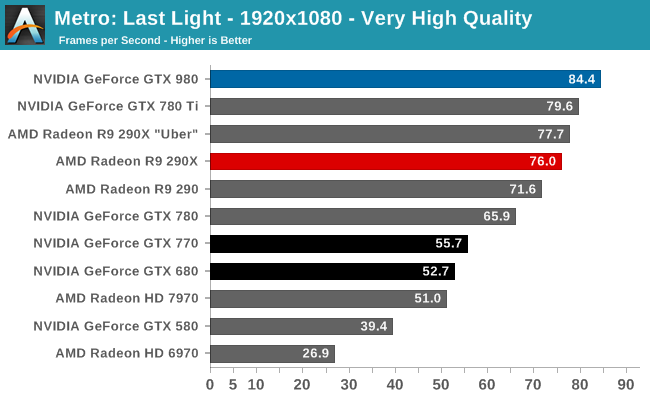
GTX 980 comes out swinging in our first set of benchmarks. If there was any doubt that it could surpass the likes of R9 290XU and GTX 780 Ti, then this first benchmark is a great place to set those doubts to rest. At all resolutions and quality settings it comes out on top, surpassing NVIDIA’s former consumer flagship by anywhere from a few percent to 12% at 4K with high quality settings. Otherwise against the R9 290XU it’s a consistent 13% lead at 2560 and 4K Medium.
In absolute terms this is enough performance to keep its average framerates well over 60fps at 2560, and even at 3840 Medium it comes just short of crossing the 60fps mark. High quality mode will take the wind out of GTX 980’s sails though, pushing framerates back into the borderline 30fps range.
Looking at NVIDIA’s last-generation parts for a moment, the performance gains over the lower tier GK110 based GTX 780 are around 25-35%. This is about where you’d expect to see a new GTX x80 card given NVIDIA’s quasi-regular 2 year performance upgrade cadence. And when extended out to a full 2 years, the performance advantage over GTX 680 is anywhere between 60% and 92% depending on the resolution we’re looking at. NVIDIA proclaims that GTX 980 will achieve 2x the performance per watt of GTX 680, and since GTX 980 is designed to operate at a lower TDP than GTX 680, as we can see it means performance over GTX 680 won’t quite be doubled in most cases.


274 Comments
View All Comments
kron123456789 - Friday, September 19, 2014 - link
Look at "Load Power Consuption — Furmark" test. It's 80W lower with 980 than with 780Ti.Carrier - Friday, September 19, 2014 - link
Yes, but the 980's clock is significantly lowered for the FurMark test, down to 923MHz. The TDP should be fairly measured at speeds at which games actually run, 1150-1225MHz, because that is the amount of heat that we need to account for when cooling the system.Ryan Smith - Friday, September 19, 2014 - link
It doesn't really matter what the clockspeed is. The card is gated by both power and temperature. It can never draw more than its TDP.FurMark is a pure TDP test. All NVIDIA cards will reach 100% TDP, making it a good way to compare their various TDPs.
Carrier - Friday, September 19, 2014 - link
If that is the case, then the charts are misleading. GTX 680 has a 195W TDP vs. GTX 770's 230W (going by Wikipedia), but the 680 uses 10W more in the FurMark test.I eagerly await your GTX 970 report. Other sites say that it barely saves 5W compared to the GTX 980, even after they correct for factory overclock. Or maybe power measurements at the wall aren't meant to be scrutinized so closely :)
Carrier - Friday, September 19, 2014 - link
To follow up: in your GTX 770 review from May 2013, you measured the 680 at 332W in FurMark, and the 770 at 383W in FurMark. Those numbers seem more plausible.Ryan Smith - Saturday, September 20, 2014 - link
680 is a bit different because it's a GPU Boost 1.0 card. 2.0 included the hard TDP and did away with separate power targets. Actually what you'll see is that GTX 680 wants to draw 115% TDP with NVIDIA's current driver set under FurMark.Carrier - Saturday, September 20, 2014 - link
Thank you for the clarification.wanderer27 - Friday, September 19, 2014 - link
Power at the wall (AC) is going to be different than power at the GPU - which is coming from the DC PSU.There are loses and efficiency difference in converting from AC to DC (PSU), plus a little wiggle from MB and so forth.
solarscreen - Friday, September 19, 2014 - link
Here you go:http://books.google.com/books?id=v3-1hVwHnHwC&...
PhilJ - Saturday, September 20, 2014 - link
As stated in the article, the power figures are total system power draw. The GTX980 is throwing out nearly double the FPS of the GTX680, so this is causing the rest of the system (mostly the CPU) to work harder to feed the card. This in tun drives the total system power consumption up, despite the fact the GTX980 itself is drawing less power than the GTX680.