The NVIDIA GeForce GTX 980 Review: Maxwell Mark 2
by Ryan Smith on September 18, 2014 10:30 PM ESTBattlefield 4
Our latest addition to our benchmark suite and our current major multiplayer action game of our benchmark suite is Battlefield 4, DICE’s 2013 multiplayer military shooter. After a rocky start, Battlefield 4 has finally reached a point where it’s stable enough for benchmark use, giving us the ability to profile one of the most popular and strenuous shooters out there. As these benchmarks are from single player mode, based on our experiences our rule of thumb here is that multiplayer framerates will dip to half our single player framerates, which means a card needs to be able to average at least 60fps if it’s to be able to hold up in multiplayer.
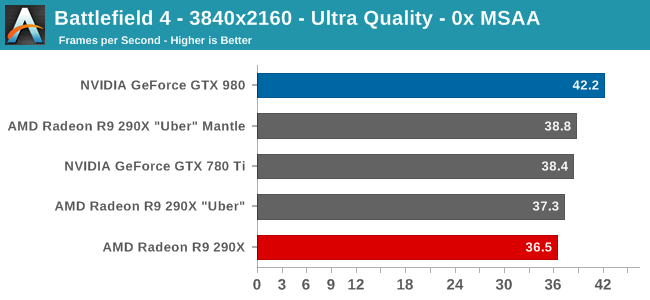
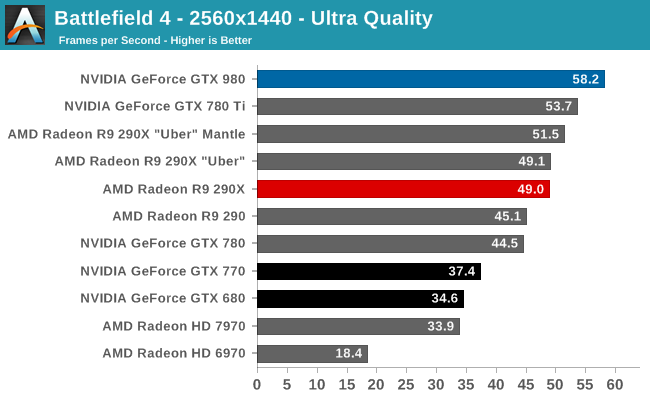
Battlefield 4 is one of our tougher games, especially with the bar set at 60fps to give us enough headroom for multiplayer performance. To that end the GTX 980 turns in another solid performance, though the dream of averaging 60fps at 1440p Ultra is going to have to wait just a bit longer to be answered.
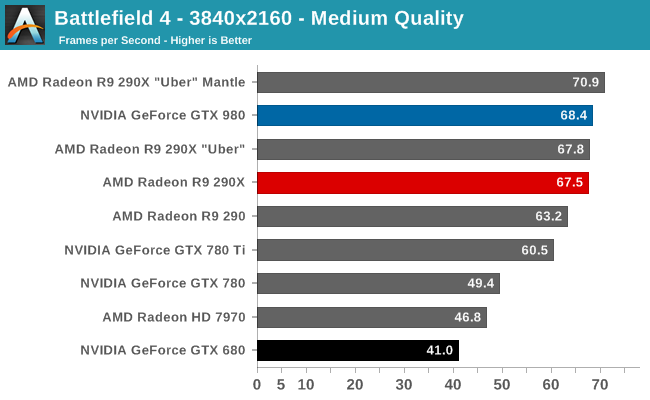
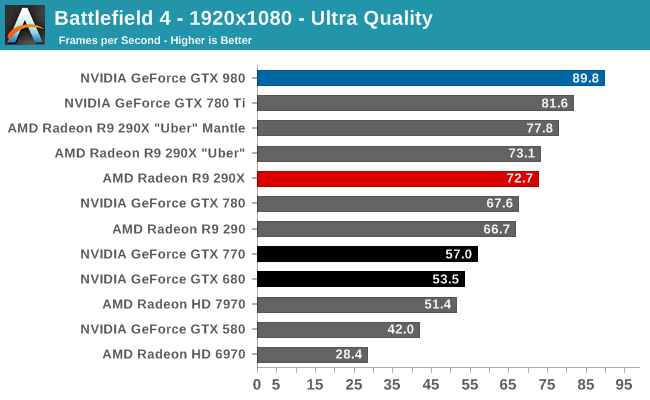
Overall on a competitive basis the GTX 980 looks very strong. Against the GTX 780 Ti it further improves on performance by 8-13%, 30%+ against GTX 780, and 66% against GTX 680. Similarly it fares well against AMD’s cards – even with their Mantle performance advantage – with the exception of one case: 4K at Medium quality. With maximum quality settings, at all resolutions the GTX 980 can outperform AMD’s best by around 15%. But in the case of 4K Medium, with the lesser shader overhead in particular the R9 290XU gets to pull ahead thanks to Mantle. At this point NVIDIA is losing by just 4%, but it goes to show how close the race between these two cards is going to be at times and why AMD is never too far behind NVIDIA in several of these games.
In any case for Ultra quality you’re looking at the GTX 980 being enough for 1080p and even 1440p if you flex the 60fps rule a bit. 4K at these settings though is going to be the domain of multi-GPU setups.
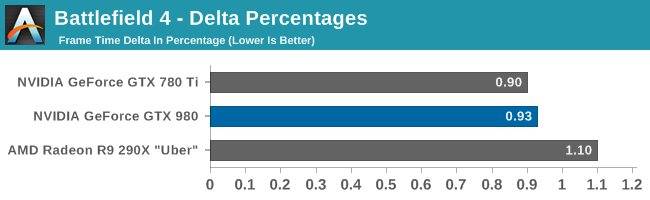
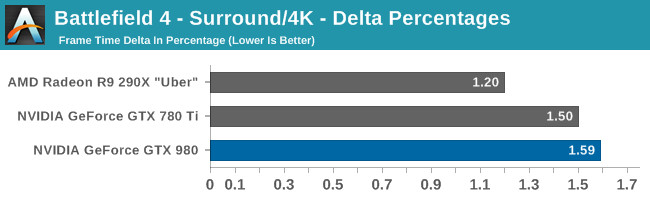
Meanwhile delta percentage performance is extremely strong here. Everyone, incuding the GTX 980, is well below 3%.


274 Comments
View All Comments
kron123456789 - Friday, September 19, 2014 - link
Look at "Load Power Consuption — Furmark" test. It's 80W lower with 980 than with 780Ti.Carrier - Friday, September 19, 2014 - link
Yes, but the 980's clock is significantly lowered for the FurMark test, down to 923MHz. The TDP should be fairly measured at speeds at which games actually run, 1150-1225MHz, because that is the amount of heat that we need to account for when cooling the system.Ryan Smith - Friday, September 19, 2014 - link
It doesn't really matter what the clockspeed is. The card is gated by both power and temperature. It can never draw more than its TDP.FurMark is a pure TDP test. All NVIDIA cards will reach 100% TDP, making it a good way to compare their various TDPs.
Carrier - Friday, September 19, 2014 - link
If that is the case, then the charts are misleading. GTX 680 has a 195W TDP vs. GTX 770's 230W (going by Wikipedia), but the 680 uses 10W more in the FurMark test.I eagerly await your GTX 970 report. Other sites say that it barely saves 5W compared to the GTX 980, even after they correct for factory overclock. Or maybe power measurements at the wall aren't meant to be scrutinized so closely :)
Carrier - Friday, September 19, 2014 - link
To follow up: in your GTX 770 review from May 2013, you measured the 680 at 332W in FurMark, and the 770 at 383W in FurMark. Those numbers seem more plausible.Ryan Smith - Saturday, September 20, 2014 - link
680 is a bit different because it's a GPU Boost 1.0 card. 2.0 included the hard TDP and did away with separate power targets. Actually what you'll see is that GTX 680 wants to draw 115% TDP with NVIDIA's current driver set under FurMark.Carrier - Saturday, September 20, 2014 - link
Thank you for the clarification.wanderer27 - Friday, September 19, 2014 - link
Power at the wall (AC) is going to be different than power at the GPU - which is coming from the DC PSU.There are loses and efficiency difference in converting from AC to DC (PSU), plus a little wiggle from MB and so forth.
solarscreen - Friday, September 19, 2014 - link
Here you go:http://books.google.com/books?id=v3-1hVwHnHwC&...
PhilJ - Saturday, September 20, 2014 - link
As stated in the article, the power figures are total system power draw. The GTX980 is throwing out nearly double the FPS of the GTX680, so this is causing the rest of the system (mostly the CPU) to work harder to feed the card. This in tun drives the total system power consumption up, despite the fact the GTX980 itself is drawing less power than the GTX680.