SanDisk Extreme Pro SSD (240GB, 480GB & 960GB) Review: The Fastest Just Got Faster
by Kristian Vättö on June 16, 2014 4:00 PM EST- Posted in
- Storage
- SSDs
- SanDisk
- Extreme Pro
Random Read/Write Speed
The four corners of SSD performance are as follows: random read, random write, sequential read and sequential write speed. Random accesses are generally small in size, while sequential accesses tend to be larger and thus we have the four Iometer tests we use in all of our reviews.
Our first test writes 4KB in a completely random pattern over an 8GB space of the drive to simulate the sort of random access that you'd see on an OS drive (even this is more stressful than a normal desktop user would see). We perform three concurrent IOs and run the test for 3 minutes. The results reported are in average MB/s over the entire time.
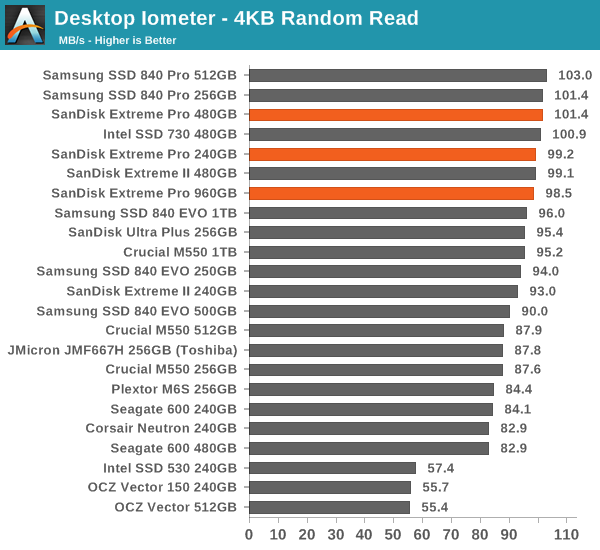
The random read performance is great, which was expected when coming from the Extreme II.
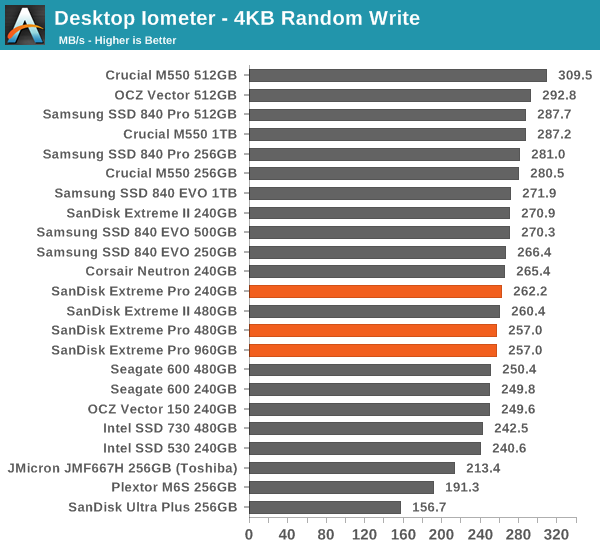
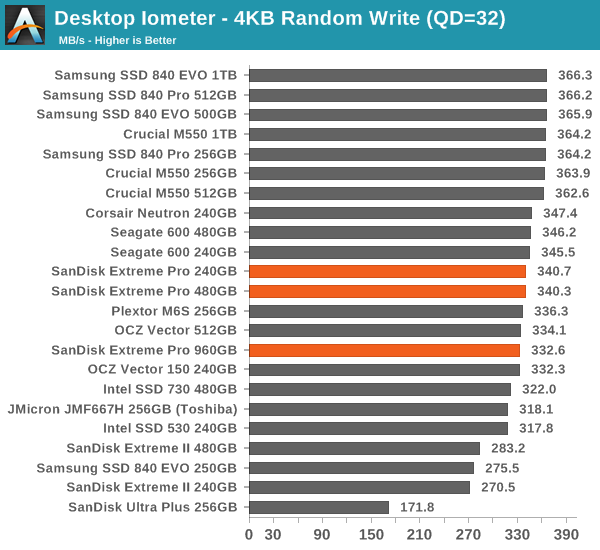
Random write performance, on the other hand, is only mediocre, although it's consistency that matters and not necessarily the peak performance. It seems that drives with high consistency do not have as good peak performance because the Extreme Pro, Vector 150 and SSD 730 are in the middle, whereas the 840 EVO and M550 lead the pack despite their relatively poor IO consistency. I would take consistency over ~10% better peak performance, though.
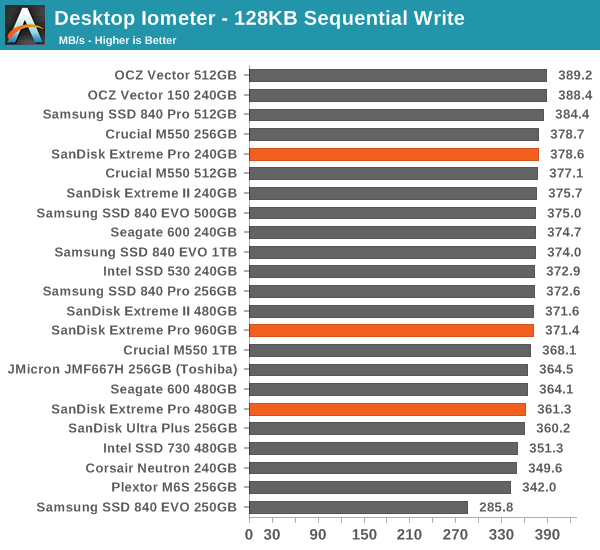
Sequential Read/Write Speed
To measure sequential performance we run a 1 minute long 128KB sequential test over the entire span of the drive at a queue depth of 1. The results reported are in average MB/s over the entire test length.
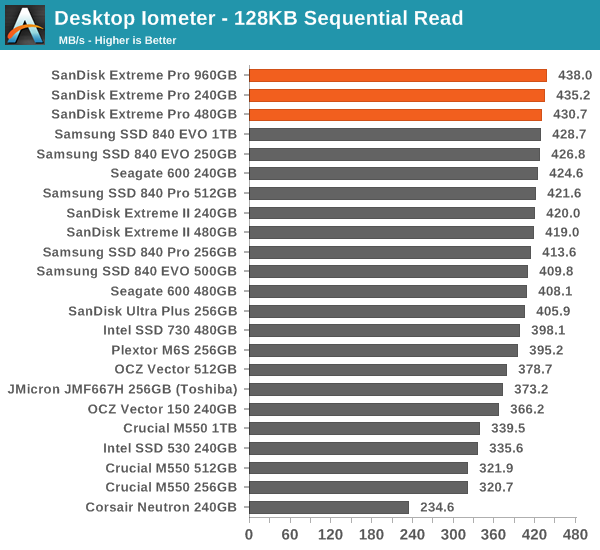
Sequential performance is definitely good. I think the high read speed is one of the reasons why the Extreme Pro did so well in the 2013 Storage Bench because both the SSD 730 and Vector 150 are noticeably slower.
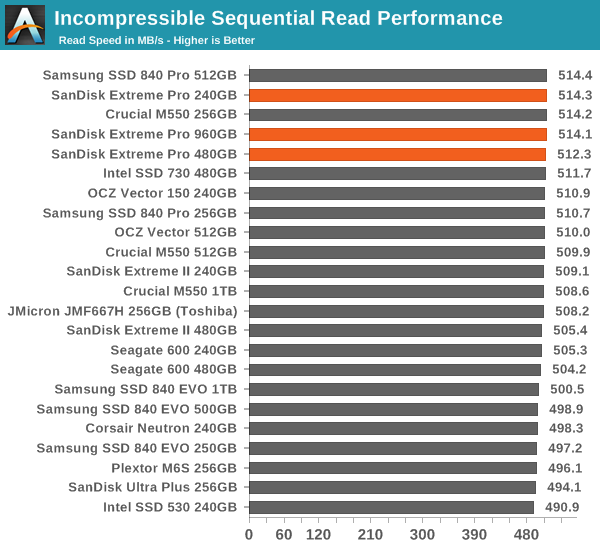
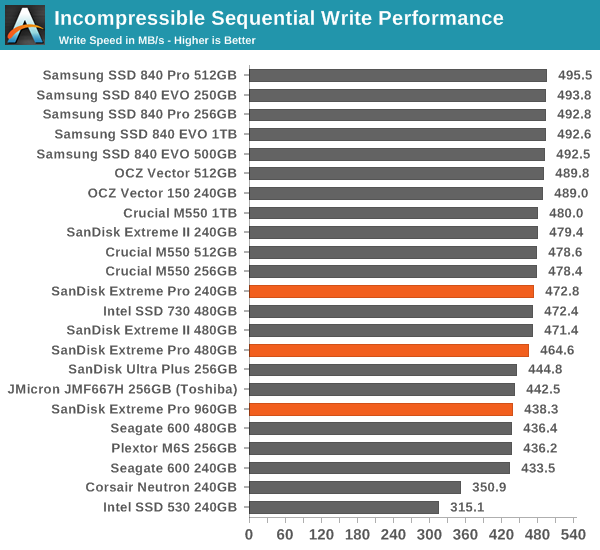
AS-SSD Incompressible Sequential Read/Write Performance
The AS-SSD sequential benchmark uses incompressible data for all of its transfers. The result is a pretty big reduction in sequential write speed on SandForce based controllers.


85 Comments
View All Comments
fackamato - Monday, June 16, 2014 - link
Nice. Time to replace the old Intel 320 in RAID0 perhaps.MikeMurphy - Monday, June 16, 2014 - link
I always like a good review, but I'm finding SSD benchmarks difficult to respect when the real-world difference between this drive and the MX100 will be invisible to most users.Samus - Tuesday, June 17, 2014 - link
I agree, Ferrari's vs Lamborghini's. Anybody coming from a hard drive or even a last-gen SSD (like an Intel X25) isn't going to notice the difference between a $100 MX100 and a $200 Sandisk Extreme Pronathanddrews - Tuesday, June 17, 2014 - link
No one will notice... except people that can and do distinguish between Ferraris and Lambos. I would imagine that someone that could tell the difference between a WD Velociraptor and a Seagate Barracuda would notice the difference between these two drives. Different users have different needs, that should be obvious.MyrddinE - Tuesday, June 17, 2014 - link
The issue is that many power users *think* they can tell the difference, but fail to in blind tests. This has been proven true frequently, usually in relation to more subjective domains like audio, but it applies everywhere. Sit a user at two computers, one overclocked 5%, one not, and it's likely not a single power user will be able to tell without a FPS meter or perf test result.nathanddrews - Tuesday, June 17, 2014 - link
Depends on what operation is boosted by 5%. If 5% allows you to maintain solid vsync vs dips, then you sure as heck will be able to tell. If 5% is the difference between completing 5% more editing projects in the same amount of time, then people who spend more will see a benefit. There's always a case to be made for measurable improvements.I'm sorry, but the audiophile straw man doesn't apply here.
Chaser - Tuesday, June 17, 2014 - link
A 5 % performance difference with selective benchmarks using higher end SSD WON'T be noticed in real world user experiences. No need to apologize.Kristian Vättö - Tuesday, June 17, 2014 - link
5%? The difference between 240GB Extreme Pro and 256GB MX100 is more like 162% in the Storage Bench 2013...http://www.anandtech.com/bench/product/1240?vs=122...
Bear in mind that that's real-world IOs played back on the drive, so it's not as synthetic as e.g. Iometer tests are.
TheWrongChristian - Wednesday, June 18, 2014 - link
It's entirely synthetic, even if derived from real trace data.As I understand it, the trace is replayed as fast as possible. In the real world, the trace probably would have been collected over a period of hours or days. In those time frames, different levels of near instantaneous is the same if it's too quick for human perception. Consider the microcontroller controlling your washing machine. It does all it needs to do fast enough, that adding a 10000% faster CPU won;t make your washing clean any quicker.
Plus, in the real world, other factors come into play. Had the trace been replayed in real time (as in takes as long to replay as to collect, pauses and all) different drives will do things like background GC, which will improve performance of the next burst of activity. A drive that takes 162% as long to replay the trace at full speed may complete the real time trace within milliseconds of the faster drive. Result, no perceptible difference to the user.
Kristian Vättö - Wednesday, June 18, 2014 - link
Maximum idle time (i.e. when QD=0) is set to 25 seconds, otherwise the trace is played as it was collected. Sure that's still not the same as playing it back in real time but it's still quite a bit of time for the SSD to do GC.