ASUS PB278Q Review: An IPS Competitor Emerges
by Chris Heinonen on November 19, 2012 11:00 PM ESTASUS PB278Q Screen Uniformity
The larger the display, the more concerned I am about how uniform the display is. There is more room for uneven backlighting as they have a larger area to illuminate, and users will view the display at wider angles that already will cause some drop in light output. Here again I am measuring this using a 5x5 ANSI pattern using the i1DisplayPro to provide better real-world results and prevent dynamic contrast from creating totally irrelevant results.
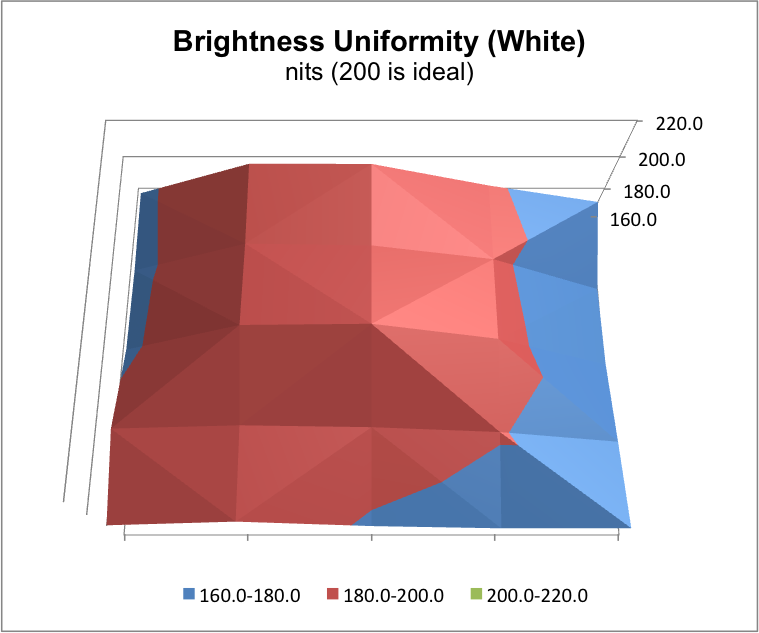
With the center at 200 nits plus the surrounding eight measurements, it averages out to 190.6 nits. When looking at the whole display we see an average of 182 nits with a pretty good roll-off on the right side and the upper-left area of the screen. These areas fall down to as low at 157 nits, which is almost a 25% drop off from the center of the screen. I really like displays to stay within 15% at the outer edge, which would be 170 nits here, but the ASUS can’t quite do this. The average brightness level for the outside edge is 178 nits because the top of the screen averages 196 nits, but the right side drops down pretty far.
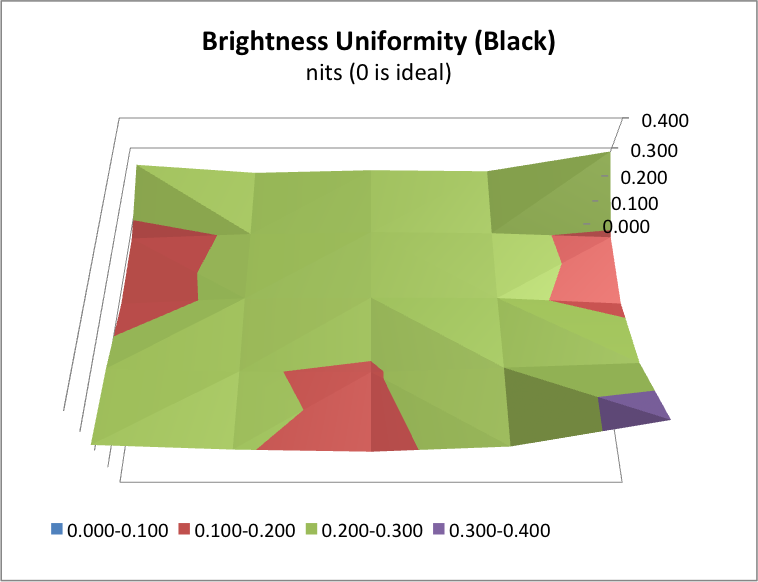
With the black measures, we see some light bleed in the upper right and lower right corners. The black level is bit higher, all the way up to 0.356 nits in the lower right, compared to the 0.212 nits in the center of the screen. The center of the screen is very close to the same, with an average difference of only 0.004 nits. The outside does worse with an average difference of 0.012 nits compared to the center. If those corners weren’t bright this would be a very uniform black screen, but those two measurements really cause an issue here.
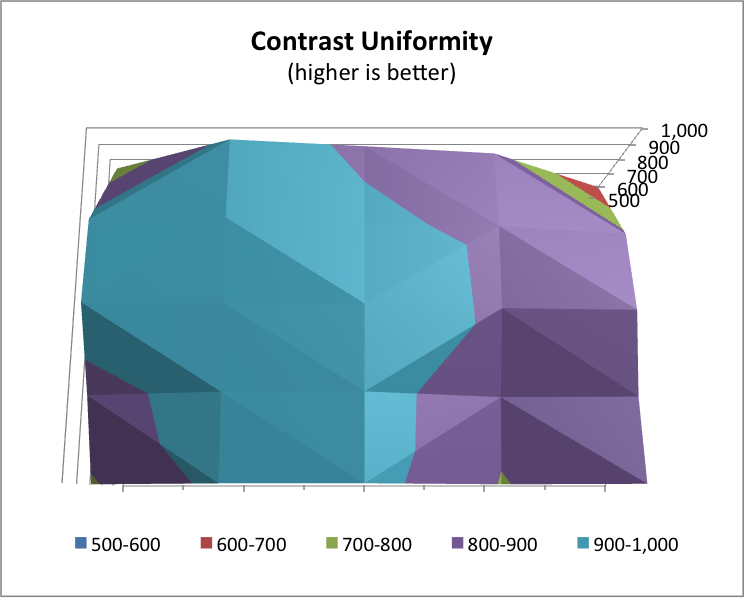
Contrast uniformity is mostly good with exceptions in the corners of the screen. The center is 942:1 and the average of the surrounding area is 916:1, but the average contrast of the outside edge falls down to 850:1 for an overall 25-point average of 874:1. This is really undone by the corners that have an average of 746:1. Where the Dell U2713HM had 16 locations that managed a contrast ratio of 950:1 or better, there were only 3 measurements on the ASUS that were at the same level.
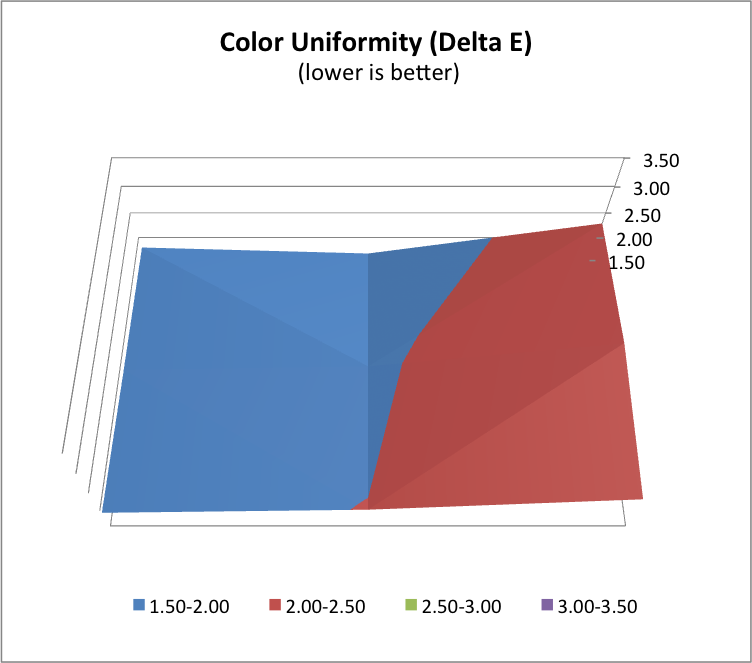
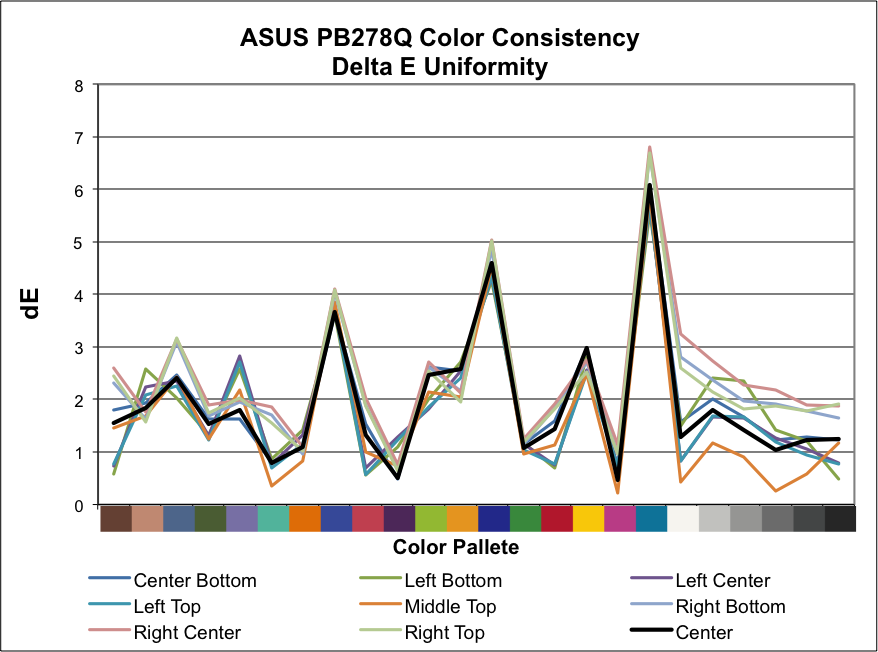
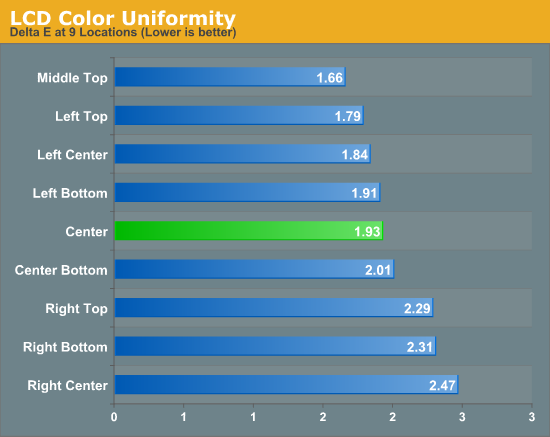
The dE uniformity was very strange, with a large jump in the dE on the right side of the screen, just like we had a fall off in light level. I made sure to run this multiple times after seeing these results but they were consistent across the different measurements. For the center and left side of the screen, the dE measures were fine, staying at 2.0 or below. On the right side the grayscale values were far different than the rest of the screen, with the white dE going from around 1.5 to around 3.0, and the rest of the shades being worse as well. The color numbers are pretty close, but the uneven backlighting on the right side seems to also influence the grayscale uniformity here and leads to a higher error level than I would like to see.
Overall the center of the PB278Q scores very well for uniformity, but once we get to the outside edge there are issues with bright corners and light fall-off on the edges that leads to worse overall results. I don’t think that any of the issues are deal breaking, but they seem to indicate an issue with the backlighting system in the PB278Q.


55 Comments
View All Comments
cheinonen - Tuesday, November 20, 2012 - link
I don't have the 21:9 Dell, but I have the LG EA93 being written up now.jjj - Tuesday, November 20, 2012 - link
That's great,looking forward to the review.I guess it's the same penel,Dell might use it better but the LG could be cheaper.bcseime - Tuesday, November 20, 2012 - link
The values for U2412M in the processing lag comparison graph does not match the value in the total response time graph.Avalon - Tuesday, November 20, 2012 - link
Ahh, I see you beat me to it.JarredWalton - Tuesday, November 20, 2012 - link
Had the same name twice; fixed now with the slower U2713HM correctly labeled. Thanks!dishayu - Tuesday, November 20, 2012 - link
You should probably try an include a couple of 120Hz LCDs like the Benq XL2410T, atleast in the input lag charts. I'd like to see how far behind IPS panels are, and of course, how close to CRT can a 120Hz LCD get.h107474 - Tuesday, November 20, 2012 - link
Actually they should use the Hazro HZ27WC for input lag comparison of 27" displays. It is also based on the LG panel but it's the ultra cut down cheap version with no scalars, only DVI input and no OSD at all! This means ultra low lag and is why I bought it. Check out the TFT Central review and input lag measurements below:http://www.tftcentral.co.uk/reviews/content/hazro_...
HisDivineOrder - Tuesday, November 20, 2012 - link
I agree. Input lag is quite commonly a problem with monitors with built-in scalers. But then, that was true years ago, too. Not sure why it's still surprising reviewers today...The shocker is they haven't figured out a way to fix or improve this problem.
cheinonen - Tuesday, November 20, 2012 - link
The question was really if using the 1:1 mode with non-native content instead of Full mode, so there was no scaling, would get around the lag hit of the scaler, but it does not do that. I'd like it if monitor vendors could make a lower lag mode, as some TV makers do with their game console modes, but I haven't seen one that has that effect yet.120 Hz LCDs are on the list to do soon and get some better numbers on them.
Olaf van der Spek - Wednesday, November 21, 2012 - link
1:1 requires more buffering than normal scalingBut nobody has been able to explain yet why normal scaling takes so much time.