Snapdragon 800 (MSM8974) Performance Preview: Qualcomm Mobile Development Tablet Tested
by Brian Klug on June 18, 2013 8:00 PM EST3DMark
3DMark for Android features the Ice Storm benchmark and uses OpenGL ES 2.0. Ice Storm is divided into two graphics tests and a physics test. The first graphics test is geometry heavy while the second test is more pixel shader intensive. The physics test, as you might guess, is CPU bound and multithreaded. The overall score takes into account both graphics and physics tests. The benchmark is rendered to an offscreen buffer at 720p/1080p and then scaled up to the native resolution of the device being tested. This is a very similar approach we've seen by game developers to avoid rendering at native resolution on some of the ultra high resolution tablets. The beauty of 3DMark's approach here is the fact that all results are comparable, regardless of a device's native resolution. The downside is we don't get a good idea of how some of the ultra high resolution tablets would behave with these workloads running at their native (> 1080p) resolutions.
For these benchmarks we stuck with the default presets (720p, normal quality).
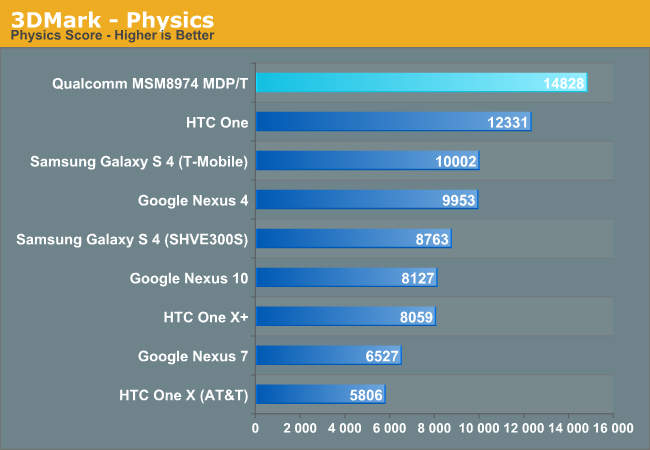
Here the key comparisons are against the Adreno 320 based HTC One/SGS4 (T-Mobile) and the PowerVR SGX 544MP3 based SGS4 (SHEVE300S). The Nexus 10 is interesting but pretty much a blowout. Snapdragon 800 is clearly the new high-end Android tablet SoC of choice.
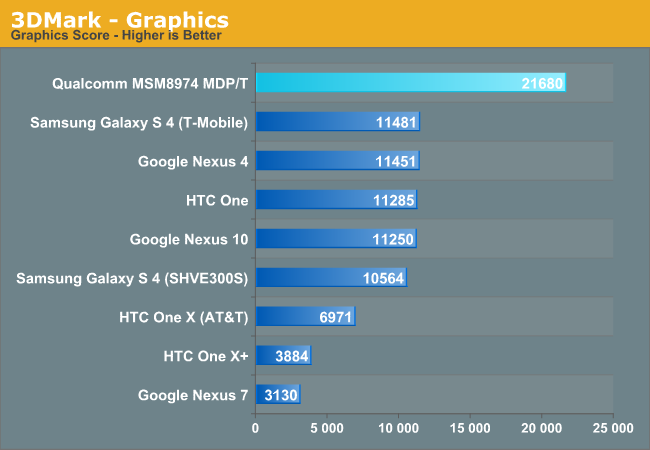
The overall graphics score from Adreno is amazing. We're looking at almost 2x the next fastest contender here, the Adreno 320 based Snapdragon 600.
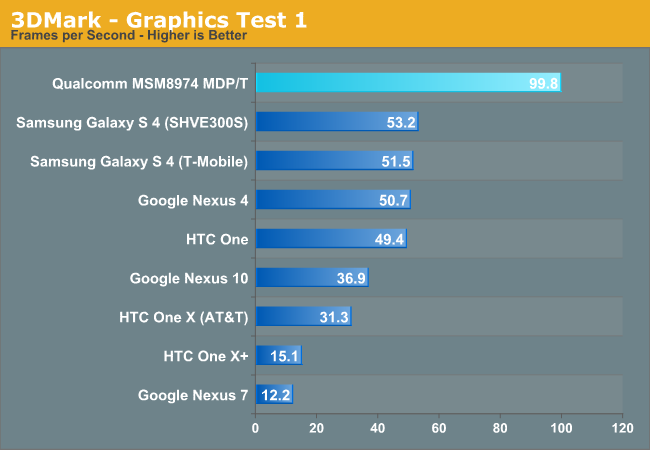
Graphics Test 1
Ice Storm Graphics test 1 stresses the hardware’s ability to process lots of vertices while keeping the pixel load relatively light. Hardware on this level may have dedicated capacity for separate vertex and pixel processing. Stressing both capacities individually reveals the hardware’s limitations in both aspects.
In an average frame, 530,000 vertices are processed leading to 180,000 triangles rasterized either to the shadow map or to the screen. At the same time, 4.7 million pixels are processed per frame.
Pixel load is kept low by excluding expensive post processing steps, and by not rendering particle effects.
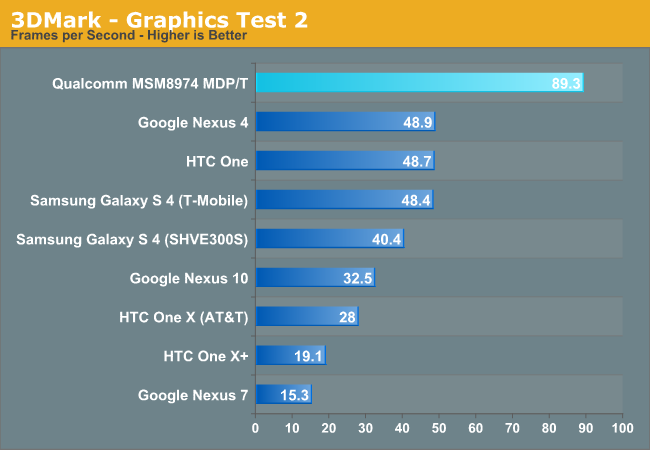
Graphics Test 2
Graphics test 2 stresses the hardware’s ability to process lots of pixels. It tests the ability to read textures, do per pixel computations and write to render targets.
On average, 12.6 million pixels are processed per frame. The additional pixel processing compared to Graphics test 1 comes from including particles and post processing effects such as bloom, streaks and motion blur.
In each frame, an average 75,000 vertices are processed. This number is considerably lower than in Graphics test 1 because shadows are not drawn and the processed geometry has a lower number of polygons.
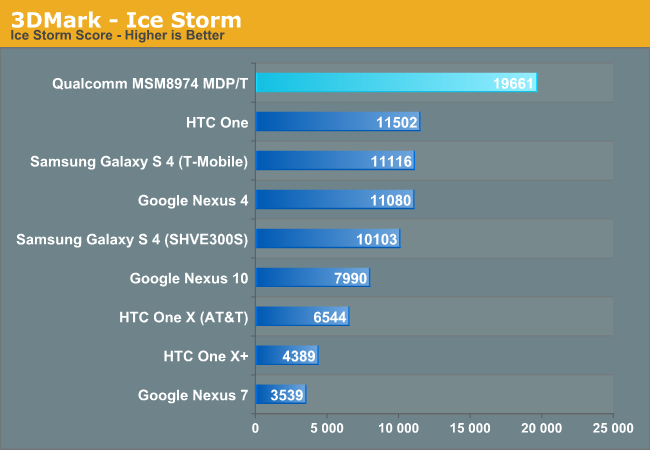
The overall Ice Storm score shows a 71% improvement over Snapdragon 600, which is the closest competitor.
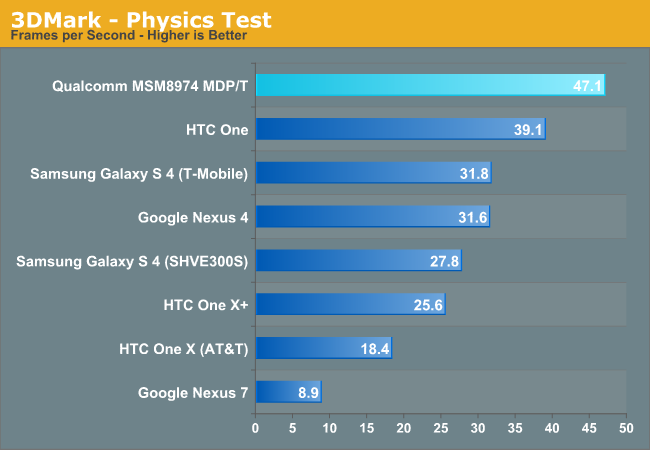
The physics test takes multicore CPU performance into account, but even then the Snapdragon 800 remains ahead of the pack. The performance advantage over the lower clocked Snapdragon 600 shrinks to just 20%, which is a bit lower than clock speeds alone would normally tell us.


115 Comments
View All Comments
Wilco1 - Thursday, June 20, 2013 - link
A low clocked single or dual Haswell won't be anywhere close to 4 times faster than a high clocked quad A15/Krait.jeffkro - Wednesday, June 19, 2013 - link
Cool, should make a great chromebook processor.WagonWheelsRX8 - Wednesday, June 19, 2013 - link
Good stuff, always like hardware reviews on Anandtech!Feature Request: When you create the charts, can you include the SoC next to the device name? It's good to know that a Google Nexus 10 is faster than Google Nexus 4, but I think the additional information of the SoC contained within would help chart readability greatly.
Thanks!
Kill16by9TN - Thursday, June 20, 2013 - link
I very much second that, since I was struggling with the very issue, always scrolling up and down in an effort to keep up with which SoC is in which product.MrPhilo - Wednesday, June 19, 2013 - link
Anyone know the reason why the Galaxy S4 (Exynos 5420) GPU performs slower than the iPhone 5 GPU on offscreen test? Even though the GPU is similar but the S4 having a higher clockspeed and higher bandwidth?Cotita - Wednesday, June 19, 2013 - link
I don't think Tegra 4 will be able to compete here. Tegra 5+kepler will be its last chance.Alberto - Wednesday, June 19, 2013 - link
Since performance comes at a cost, this Soc seems in the 8/10 W Tdp range running games. The comparison is pretty clear with A4-5000, done on the same process.Likely the power draw is lower in cpu only tasks but IMO users will enjoy a fast battery death under games. It's a Qualcomm choice, will see the market acceptance.
I prefer more balanced socs, this do not seem the case.
virtual void - Wednesday, June 19, 2013 - link
I will be interesting to see how the Silvermont based SoC stand up against Snapdragon 800 and Tegra 4. I guess it will do quite well considering that CloverTrail+ seem to beat even Exynos 5 Octa. CT+ is a dual core CPU using a 5 year old Atom design...And this is the most interesting part "Intel's chip scores highest on the most tests and draws the least current"
http://www.androidauthority.com/intel-clovertrail-...
I don't feel that today's phone need more CPU-power, they should instead focus on reducing power consumption. But tables can definitely use a lot more CPU-power!!
Wilco1 - Wednesday, June 19, 2013 - link
Exynos Octa beats the current fastest Atoms by a huge margin at a lower clock speed, so don't expect Silvermont to come close to A15: http://browser.primatelabs.com/geekbench2/compare/...That link seems to be an Intel sponsored test without any details how it was done. The benchmark I linked however is known to be independent and doesn't favour either Intel or ARM.
virtual void - Wednesday, June 19, 2013 - link
How does that link seem Intel sponsored? The numbers presented by the analyst firm is just the numbers from Antutu and that has been verified by others (search YouTube for example).If you read the review of the Z2460 & Z2670, then notice that Geekbench is really the only benchmark where those SoC performs bad against ARM SoC used at that time (Tegra 3 was very popular at that point).
If you ever actually used units based on Z2460 or Z2670 (tablets) side by side with units using Tegra 3 running the same OS and application, then you would know that the Atom systems definitely feels faster so I don't really trust Geekbench as a measurement on how things feel.
Cortex A15 is not that far behind Core i5-3320M according to Geekbench, which to anyone that used systems using those CPUs know is kind of ridiculous.
http://browser.primatelabs.com/geekbench2/compare/...
The question one can ask oneself: how come that two benchmarks that are supposed to measure roughly the same attributes of a system get such radically different result? Do you have other benchmarks? The only other benchmarks I can find myself are the web-based ones and they show the Atom in pretty good light.