ASUS PQ321Q UltraHD Monitor Review: Living with a 31.5-inch 4K Desktop Display
by Chris Heinonen on July 23, 2013 9:01 AM ESTUniformity is tested by using 25 locations across the screen and measuring the color checker chart at each of them. From there we can pull out contrast, black and white uniformity, and color uniformity. This review is the first to utilize the newest measurement available in CalMAN 5.1.2: dE From Center. Now instead of measuring the dE2000 at every location, we measure it relative to the center measurement.
This gives us a true uniformity measure. I could measure the left side and the right side of the monitor and get a dE2000 of 2.0 for each side. What that doesn’t tell me is that the left side might be red tinted, and the right side blue tinted, while the center might be green tinted. In this case they could all measure the same dE2000, but look totally different. By comparing the measured values to the center, we get an actual measurement of if one area of the screen will look the same as another area. Since we always use the center of the screen as our calibration target, which is why everything is measured relative to that.
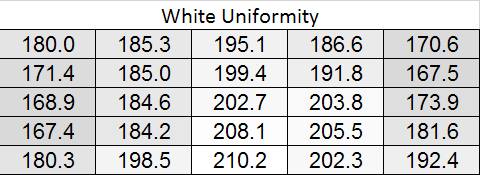
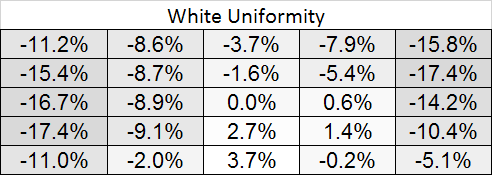
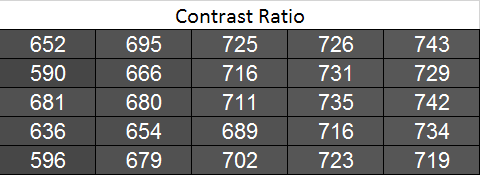
Starting out with White Uniformity, we see decent but not amazing results. The panel stays within +/- 10% for the center, but falls down to a 17% variation at the edges. The light fall-off is relatively high, and makes me wonder if the look of the panel, and its thin design, might place a bit of emphasis on style over substance.
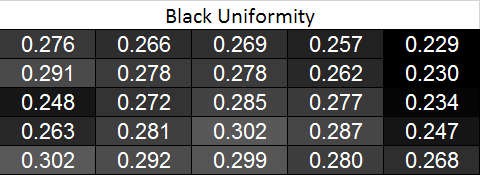
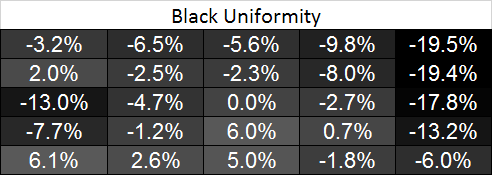
With the black level charts we see similar results. The middle of the panel is +/- 10% again, but the edges fall off to a nearly 20% difference. There is a curious rise in black level in one measure where there was a fall-off in white level, but otherwise the results between the two measurements are similar.
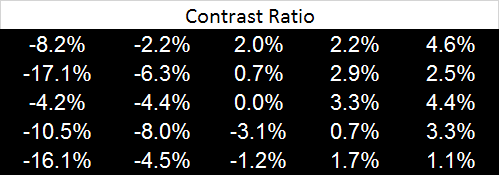
Looking at the resulting contrast, the numbers here are much closer to 100%, which we expect to see. Areas with light fall-off affect the white and black levels almost equally, so the contrast ratios are very similar all across the screen. That gives us a 700:1 expected contrast ratio for the screen as a whole.
Now we can see the new dE2000 From Center data. The issues here crop up at the outsides of the screen, where we see the backlighting issues earlier. Uneven lighting is the issue most likely to cause color issues on the screen, and that is certainly backed up here. In the center of the screen, you are going to not see a difference in colors when you look directly at the screen. With a light loss of less than 10%, and a color dE2000 of <2 for most of the center screen, everything will look identical. As you get to the extreme edges you will run into more issues. I will need more monitors to be tested with this new method, but I think this is going to wind up as a good result in the end.

Going with an LED lighting system, and not a backlit array one, is always a bit of a concern for me. Overall the PQ321Q does well for uniformity for using one, and it avoids some of the massive issues we have seen with some LED systems before. But we are looking for near-perfection from the ASUS and it can’t quite do that. The center 60% of the screen is excellent overall, and for most people that will mean you may not notice these issues at all, but they are there.


166 Comments
View All Comments
1Angelreloaded - Wednesday, July 24, 2013 - link
Your brain can process more than that from your optical socket.Kamus - Wednesday, July 24, 2013 - link
What a load of crap. You have no clue what you are talking about do you?piroroadkill - Thursday, July 25, 2013 - link
I can 100% tell the difference between 720p and 1080p on my 24" monitor at a reasonable difference.The fuzzy edges and aliasing are a dead giveaway.
Film on the other hand, tends to soften the crap out of edges anyway, and has natural motion blur built in, and at only 23.976 frames per second, tends to give little in the way of real resolution when motion is occurring.
However, games are not film. They are not rendered at a low framerate, and objects and absolutely, perfectly crisp. Rendered geometry. You can easily tell the difference.
SlyNine - Friday, July 26, 2013 - link
Where did you come up with that?? You need to substantiate your comments with some sources and objective tests.I can DEFENETLY tell the difference between 720 and 1080 on SOME moving content. Even if it is not as noticeable.
mdrejhon - Wednesday, July 31, 2013 - link
Integr8d, that's only because the display has motion blur. On a CRT, motion clarity is the same during stationary motion and fast motion (this is known as the "CRT effect"). You get that on LightBoost LCD's too as well. So fast-panning motion of a constant speed (e.g. horizontally strafing left/right while you track eyes on moving objects), the panning image is as clear as stationary image. This is the "CRT effect", and you don't get that on most TV's except for certain modes like Sony's new low-latency interpolation-free "Motionflow IMPULSE" mode (Game Mode compatible) found in some TV's such as KDL55-W802A -- it's essentially Sony's version of LightBoost.1Angelreloaded - Wednesday, July 24, 2013 - link
Your statement would be fine if we came from the same mold, but we don't people vary and the capabilities of their bodies also vary, kind of why certain army personel are chosen to become snipers.random2 - Friday, July 26, 2013 - link
People need to look a the the recommended viewing distances on HD TV's. Most people sit way too far away to take advantage of HD content. Distances are recommended between 5.5 ft to 6.5 feet for 42" to 50" TVs. The whole idea being to move close enough to replicate the feel of a large movie screen.Impulses - Wednesday, July 24, 2013 - link
Audiophiles are just terrible at objective testing, but the differences between a $500 stereo and a $2K one are definitely measurable and not terribly hard to pin down... They're also not very large in many cases (audiophiles are also amongst the worst hobbyists when it comes to paying for diminishing returns).1Angelreloaded - Wednesday, July 24, 2013 - link
Huh? you could have fooled me vintage stereo equipment goes for thousands over the original retail. Cars have the worst diminishing return of any other hobby that exists btw.cremefilled - Wednesday, July 24, 2013 - link
"Diminishing returns" != "depreciation." He's saying that if speakers that cost $500 would rate 90/100, and $5,000 would rate 95/100, and $50,000 98/100, audiophiles would spend the $50,000 or more if they had the money, even though each 10-fold price increase gets you a smaller increment of quality. Average people would say that they all sound pretty good.